Summary: The weight of the evidence says the pain trade remains higher, but there are growing cracks and mounting evidence (RoC in yields, diverging internals, weakening breadth) suggesting we will likely see a small 3-5% correction first.
FOMC this week with market pricing in 90% odds of a 25bps hike. At this point, it’d be bearish for the market if they don’t hike 25bps. Historically, stocks falter in the 6+ weeks following the first hike in a renewed hiking cycle. Though this time the market is already pricing in roughly 65bps of hikes over the next six months, so there’s now a relatively high bar for the Fed to surprise hawkish. We cover the main drivers behind the resiliency of this cycle to higher rates and geopol shocks. I show off a new narrative tracking dashboard I’ve been building and make the continued case for long energy plays, and more.
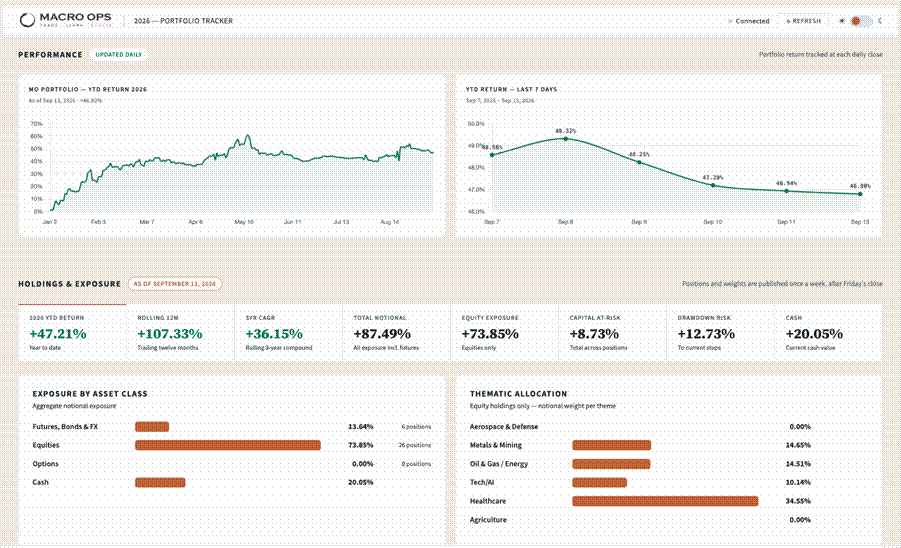
***The MO port is currently up +47.21% ytd in 26’. The Collective is where we discuss the theory behind the positioning, publish the differentiated research, track the book in real time, and argue it out with a global group of serious investors. If that’s your kind of group, join us in Slack. ***
MO Portfolio & Trades
1. The portfolio fell -224 basis points last week, leaving us +47.21% on the year, below our ytd high-water mark of +61%. We’re long Ags, energy, miners, a little ETH. Long biotech, healthcare, crypto miners, and natty producers.
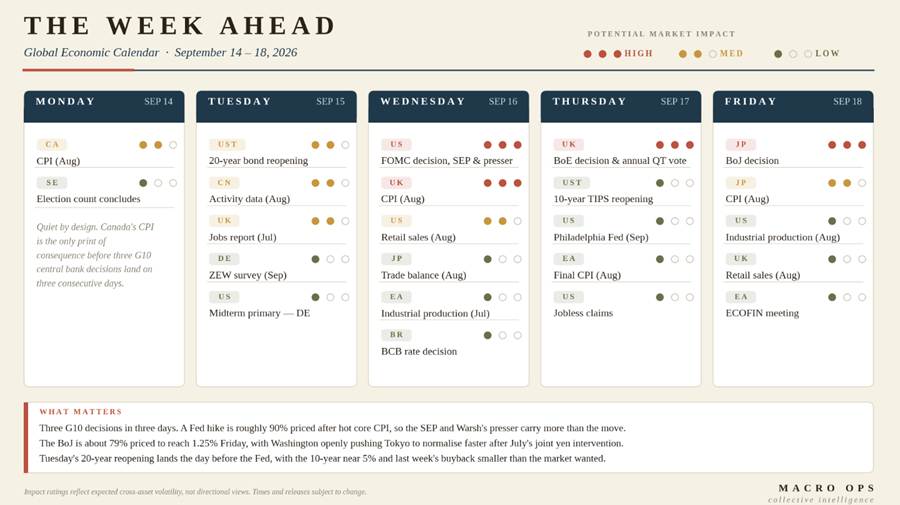
2. The week ahead in data: A Fed hike is roughly 90% priced after hot core CPI, so the SEP and Warsh’s presser carry more than the move. The BoJ is about 79% priced to reach 1.25% Friday, with Washington openly pushing Tokyo to normalise faster after July’s joint yen intervention.Tuesday’s 20-year reopening lands the day before the Fed, with the 10-year near 5% and last week’s buyback smaller than the market wanted.
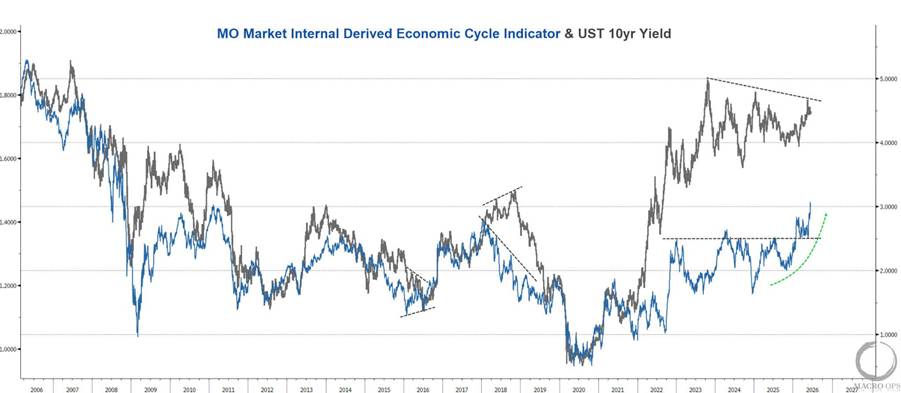
3. Back in early July I wrote a DD titled “High Gear: A New Economic Regime.” It covered the compression in rates, argued a breakout was near, and made the case that the break would be higher in yields. Here’s the chart I shared. Article here.
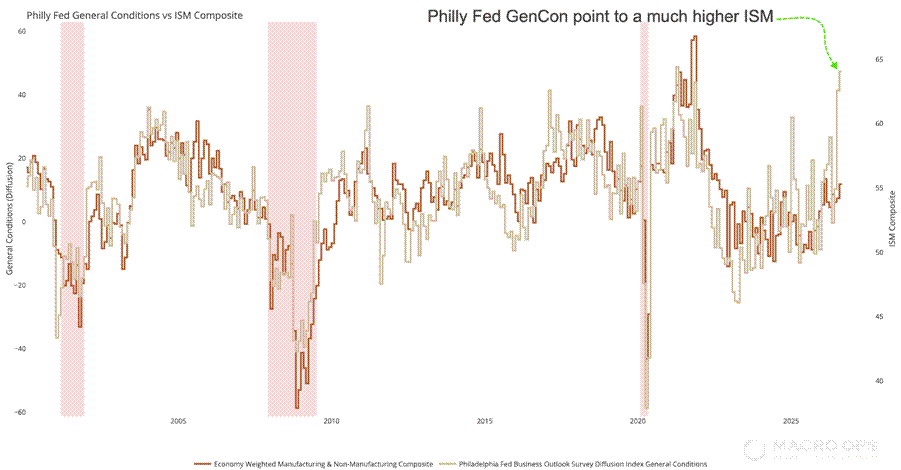
4. That thinking continues to be affirmed by the inbound data. The Philly Fed General Conditions Index (tan line) is climbing to levels last seen in the ’21 run-it-hot economy, which suggests ISM (amber line) inflects significantly higher from here.
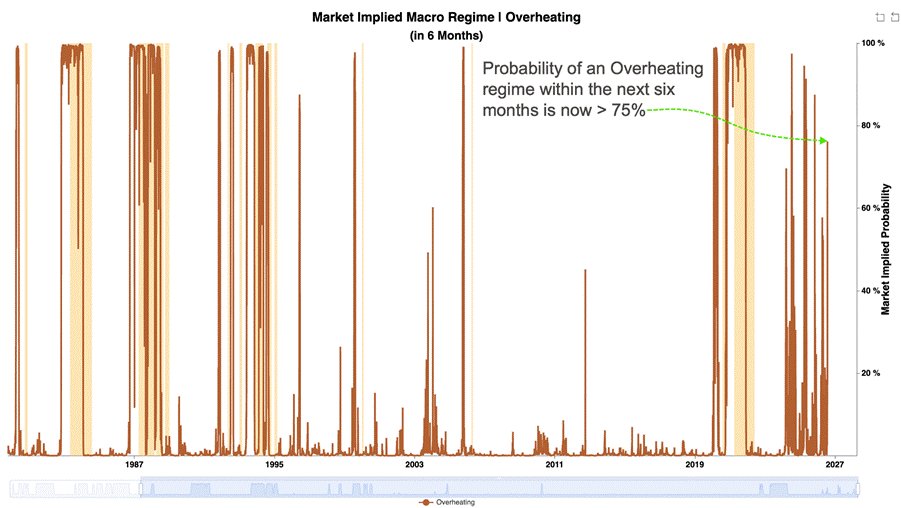
5. On that note, our Market Implied Macro Regime “Overheating” indicator is rising again and is now pricing in a 75% probability of an overheating regime within the next six months.
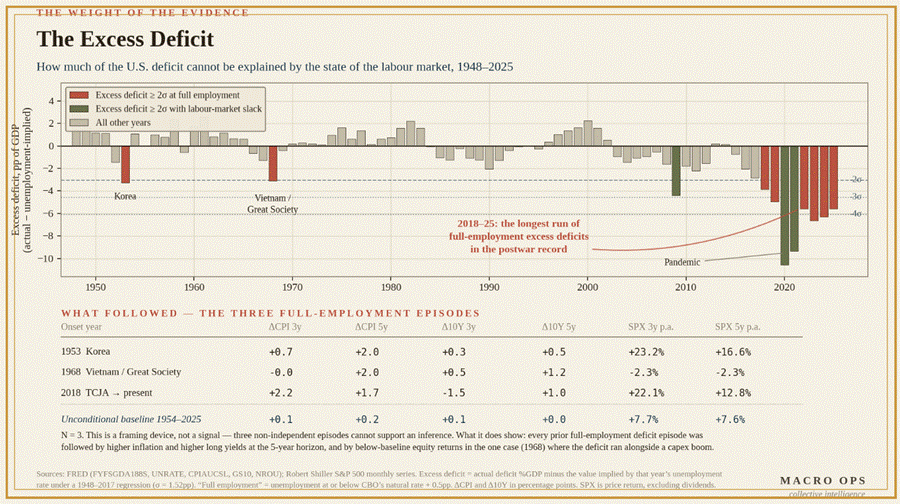
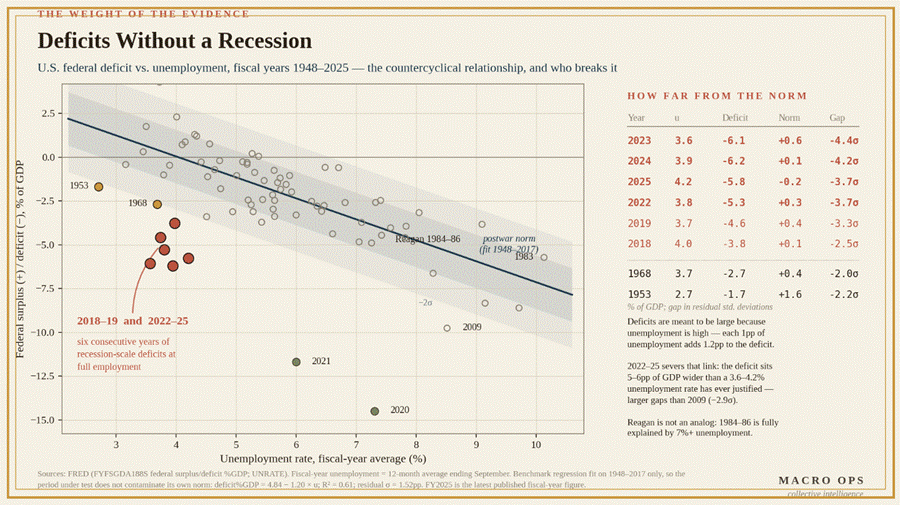
6. One of the primary reasons this economy and market have shrugged off higher rates, geopolitical shocks, and commodity shocks is in the two graphs below. We’re in a completely anomalous period in US history: massive deficits run alongside full employment. Per the Levy/Kalecki Profit Equation, those deficits translate into corporate profits. And that profit source is non-cyclical, which is where the resiliency comes from.
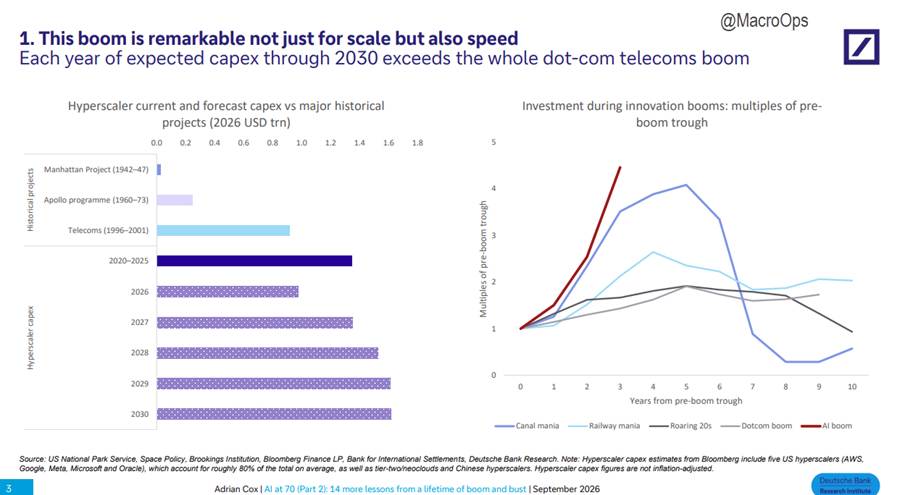
7. We’re also getting the boost from an aggressive CAPEX cycle, which feeds back into profits again. The hyperscalers funding that buildout treat losing the AI race as an existential outcome, so a 25bps hike does nothing to slow the spend (chart via DB).
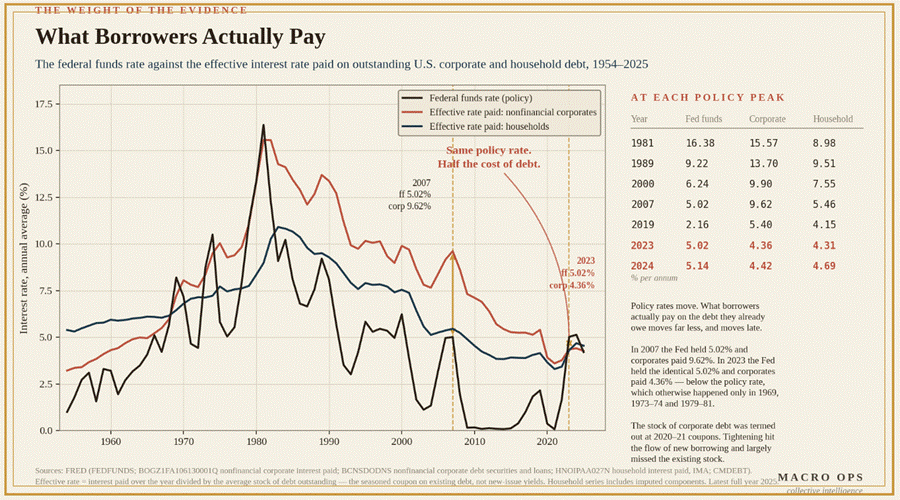
8. On top of that, most corporate debt was termed out at generational lows in 2020-21. This hiking cycle only hits new borrowing, which is why the effective rate paid by nonfinancial corporates and households sits below the policy rate.
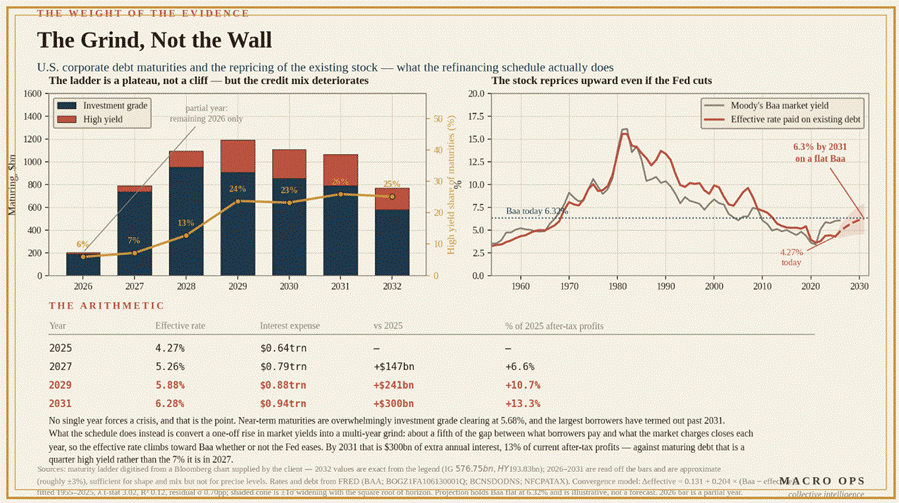
9. That doesn’t run much longer. The stock of debt needing to be refinanced climbs steadily and peaks in 2029. By 2031 we’re looking at roughly $300bn of additional annual interest expense, about 13% of current after-tax corporate profits — and the paper coming due by then is a quarter high yield, versus 7% in 2027.
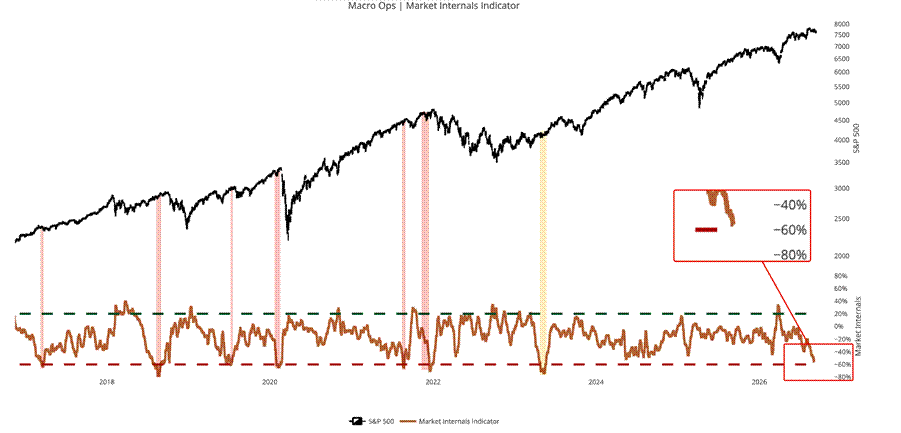
10. Our MO Aggregate Internal indicator is likely to cross below the -60% sell signal threshold this week. Highlights mark past instances with six of those preceding 5%+ corrections, and one signal failure in 23’.
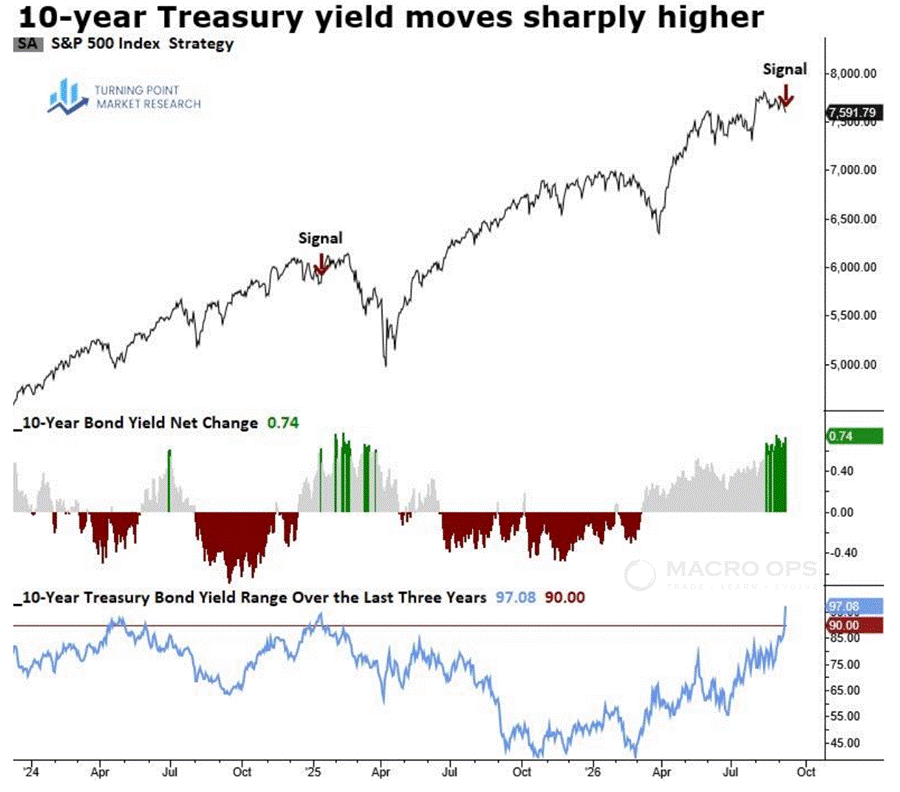
11. Additionally, my teammate Dean Christians notes in his latest brief that the RoC in the 10yr yield has triggered a sell signal, wich is a core component of his TCTM RIsk-on/off signal. Forward returns for equities were overwhelmingingly negative during similar episodes. Collective members can find his report in our Slack.
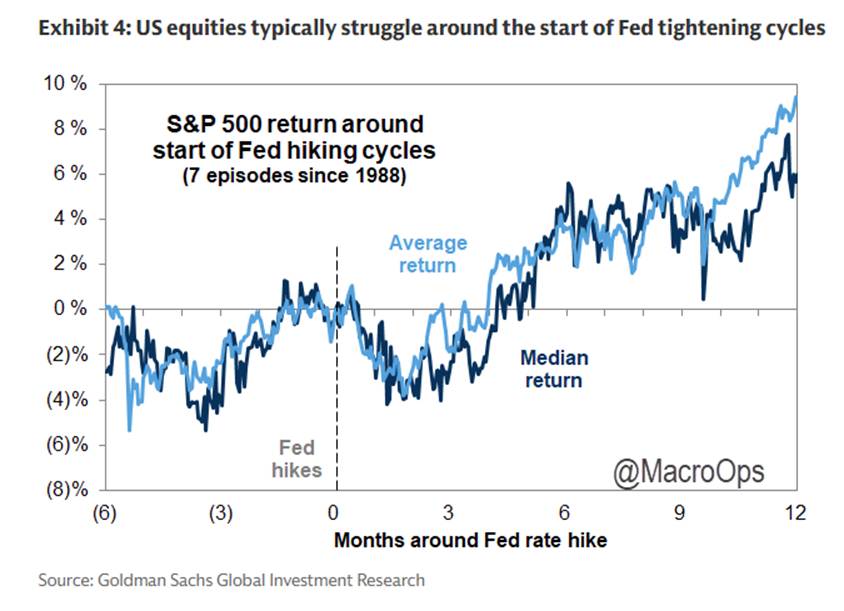
12. From GS: “Equities typically struggle at the start of Fed hiking cycles, but the market has already priced substantial Fed tightening in coming months. The S&P 500 has generated an average 3-month return of -2% at the start of seven hiking cycles during the last few decades.
“However, the S&P 500 then generated an average 12-month return of +9%, with positive returns in every episode but 2022. In 1997, for example, the S&P 500 declined by 10% alongside the Fed’s 25 bp hiking “cycle.” Stocks bottomed when the market ceased pricing additional tightening, and the S&P 500 reached new highs within three months. Today, the rates market is already pricing more than three 25 bp hikes by the middle of 2027, lifting the bar for policy to surprise in a hawkish direction. The medium-term impact of Fed tightening on equities will depend on how tightening affects earnings growth, which is the most important driver of stocks.”
13. Oracle gave an exceptionally bullish read-through on AI compute last week. OCI grew 121%, GPU utilization hit 97%, renewals and resales cleared at roughly 20% premiums, and RPO reached $664 billion. Compute is still scarce and pricing is still strong. I think the long AI / long energy barbell starts working in tandem again, though I’d widen the second leg from energy to broad commodities. The AI narrative is getting exuberant fast, though.
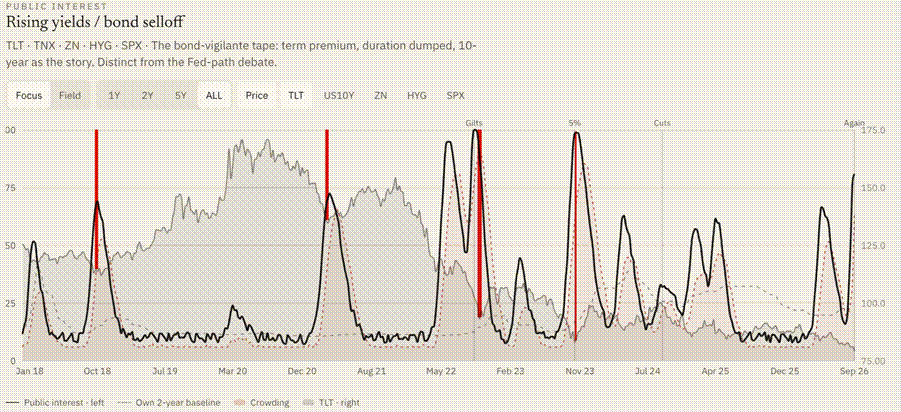
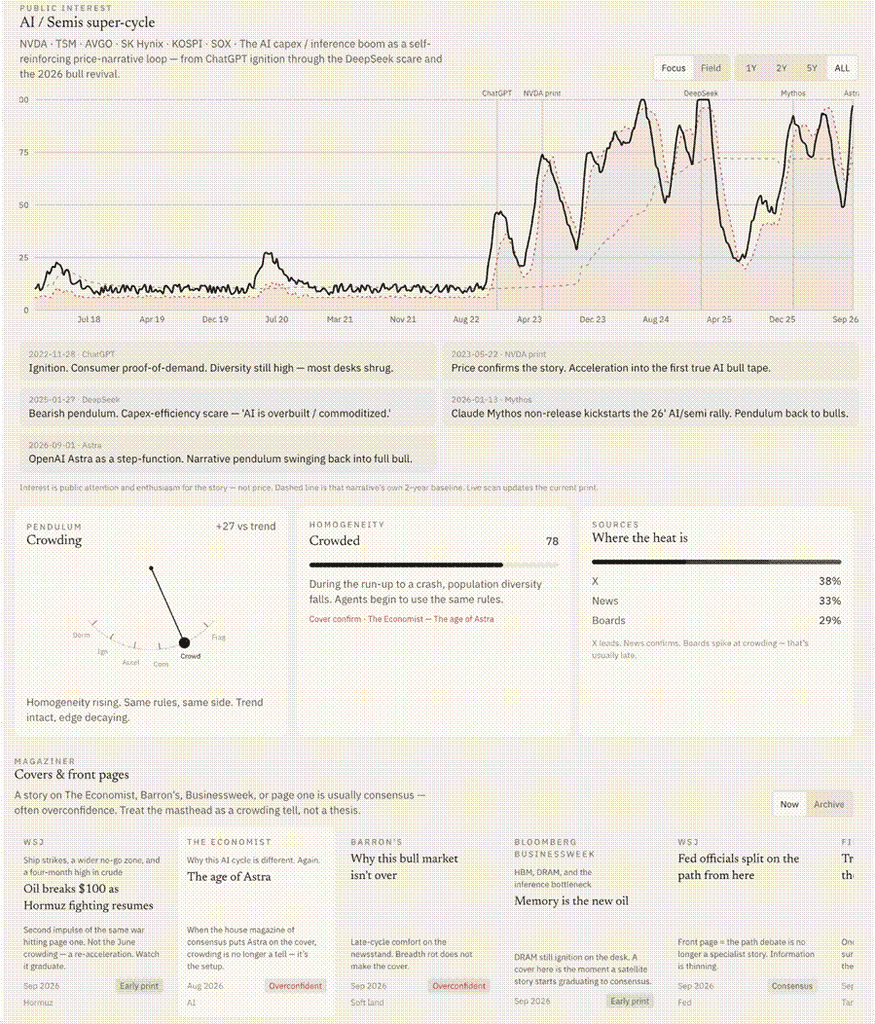
Which brings me to what I’ve been building. I’ve spent the past few weeks trying to quantify and codify my read of Narrative Pendulum dynamics. The partial screenshot below is V.1. I’m backtesting it now to see whether the signal holds up and whether it’s actually additive to my gut feel. So far I’m excited about it. If I adopt it, it goes into the V.2 Heads-Up Display for Collective members.
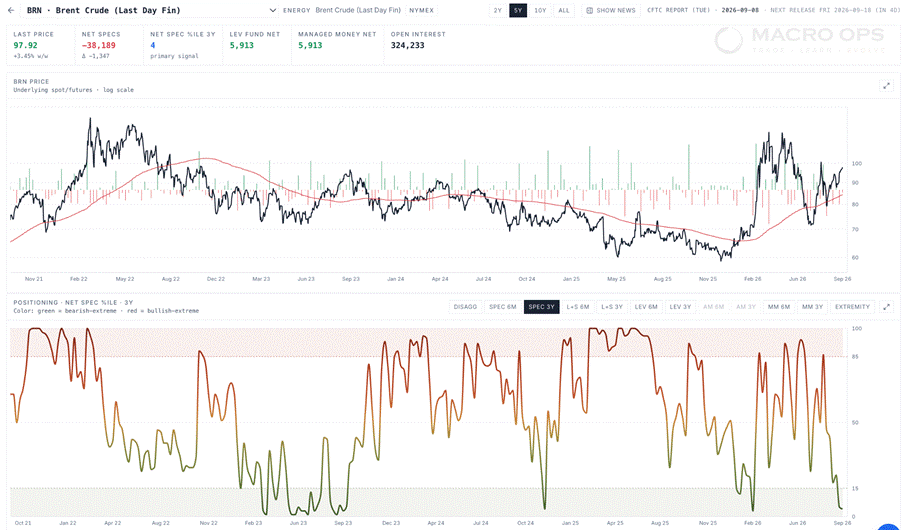
14. Oil’s cone of possibilities is widening again. Hormuz still matters, but the Red Sea is becoming the bigger swing factor as threats around Bab el-Mandeb rise and Saudi export routes come into focus. Speculators are crowded short again. We’re long and we’ll add on opportunity.
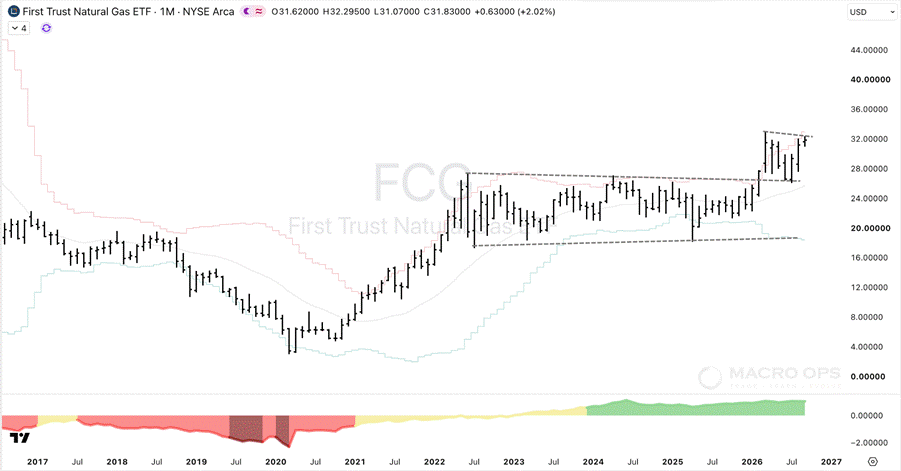
15. The monthly chart of First Trust Natural Gas Producers (FCG) continues to trade exactly as you’d hope (we’re long).
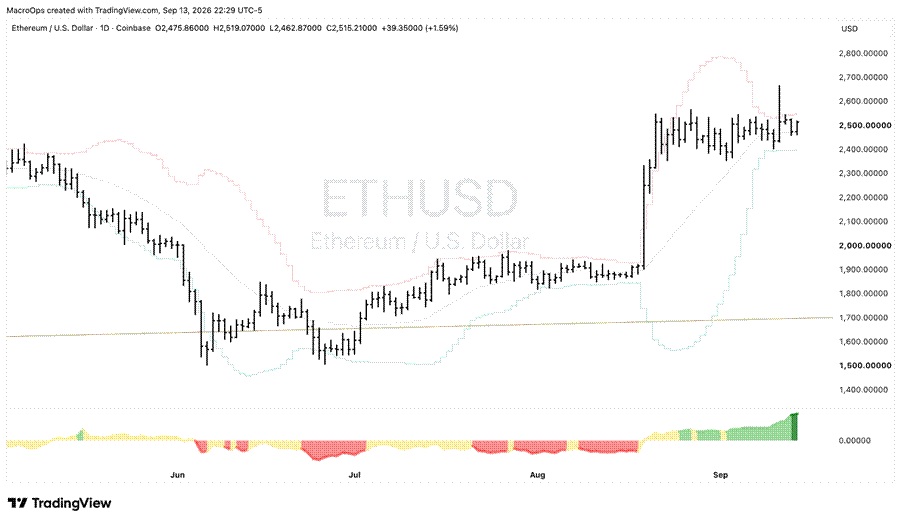
16. Crypto is once again in a tight compression regime on the daily, similar to their tape before the recent breakout. We’re watching this closely for breakout.
Thanks for reading.