Summary: Bonds are setting up for a major move and the data tells us that move will be lower (yields up). We’re seeing accelerating growth in the US, a rebounding labor market, a structural shift higher in inflation, China starting to surprise on growth, etc… The DXY broke out from its range, but this pattern may be too closely followed, we’ll see. The market likely has more gas in it for one more run higher over the next month, but sentiment and positioning are creating increasing fragilities under the surface…
MO Portfolio & Trades
1. The portfolio ended last week down 230bps, bringing year-to-date returns to +40.3%, below our YTD NAV high of +61%.
Current positioning: elevated cash, long Nasdaq, long Russell2k, long select biotech, and cybersecurity names.
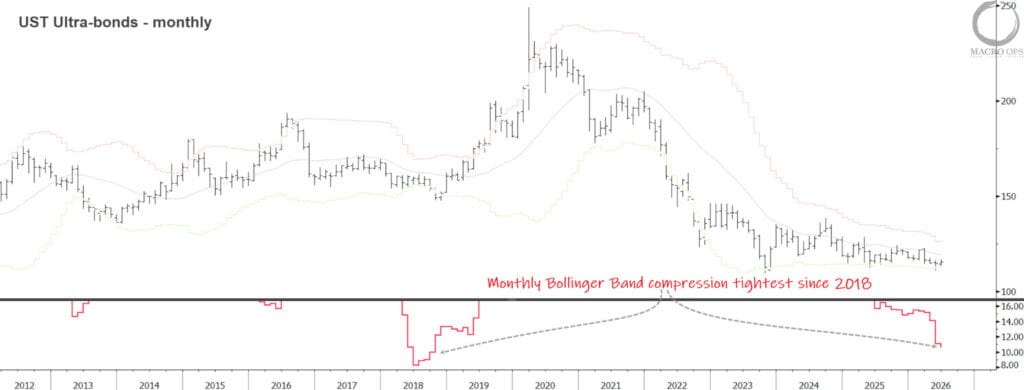
2. Bonds continue their compression on the monthly tape with BB width at its tightest range since 2018. Compression regimes precede big trends but are directionally agnostic, though our bias is for a breakout to the downside (more on this below).
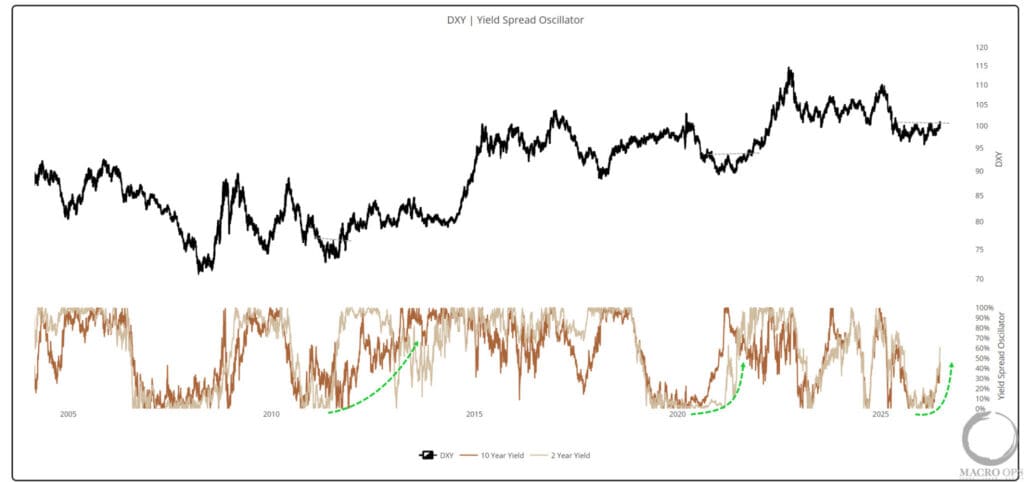
3. The DXY finally broke out from its 12m+ rectangle last week. I think this breakout will hold, but one thing that makes me a bit uncomfortable about the trade is that it’s being widely acknowledged and most prime desk reports I read through over the weekend are bullish. We are long but will wait for greater technical confirmation before pressing.
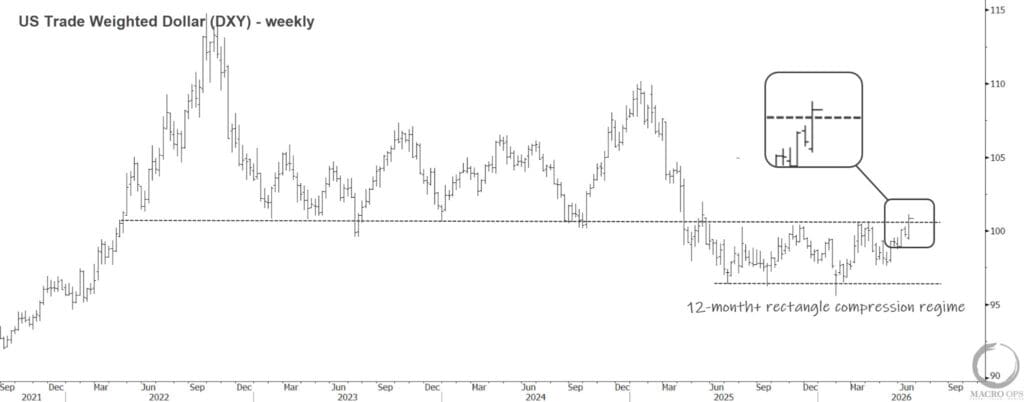
4. Rising yield spread momentum is what’s driving the dollar out from its range, similar to the setup in early 21’.
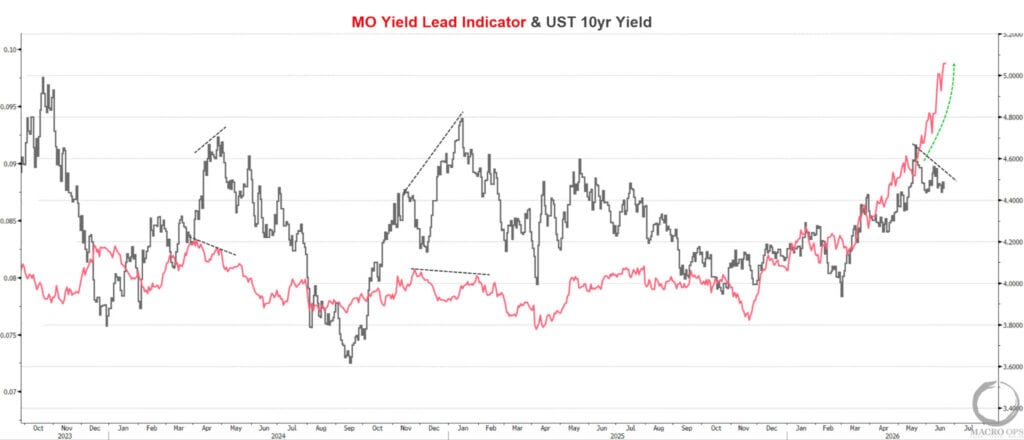
5. What makes me think this breakout will hold is that I expect the positive relative momentum in US yields to continue. Below is our leading yield indicator in red positively diverging from UST 10yr yields.
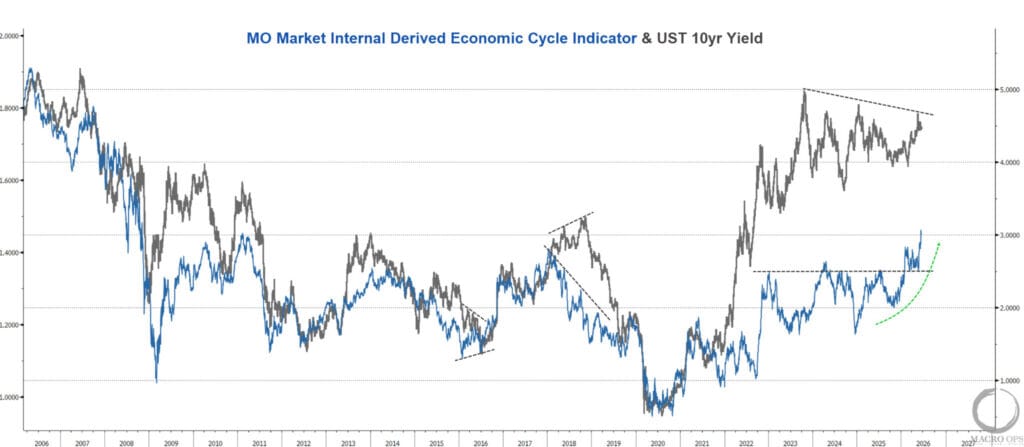
6. Our market internals derived economic cycle regime indicator (ECRI in blue) is also strongly diverging higher after breaking out of its multi-year sideways range, indicating that we’re entering a new economic regime. One that will necessitate higher yields.
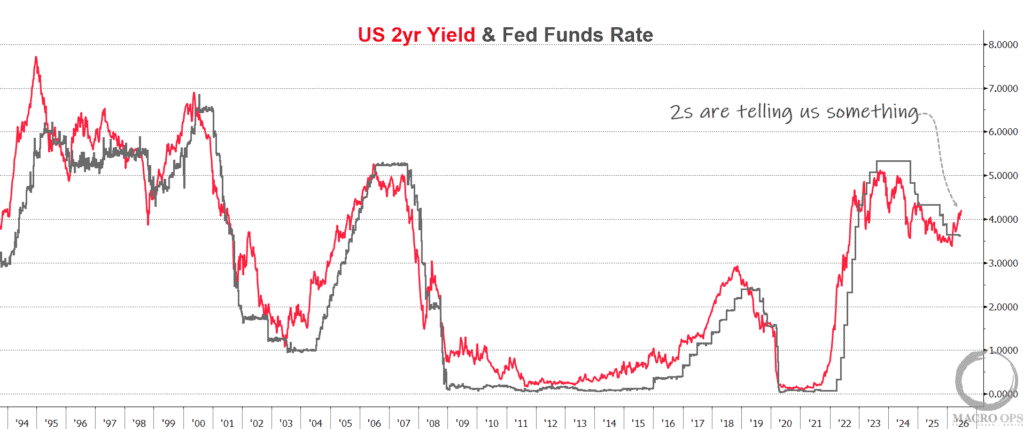
7. The best central banker is the 2yr yield (in red). It’s telling us that the Fed is going to need to hike…
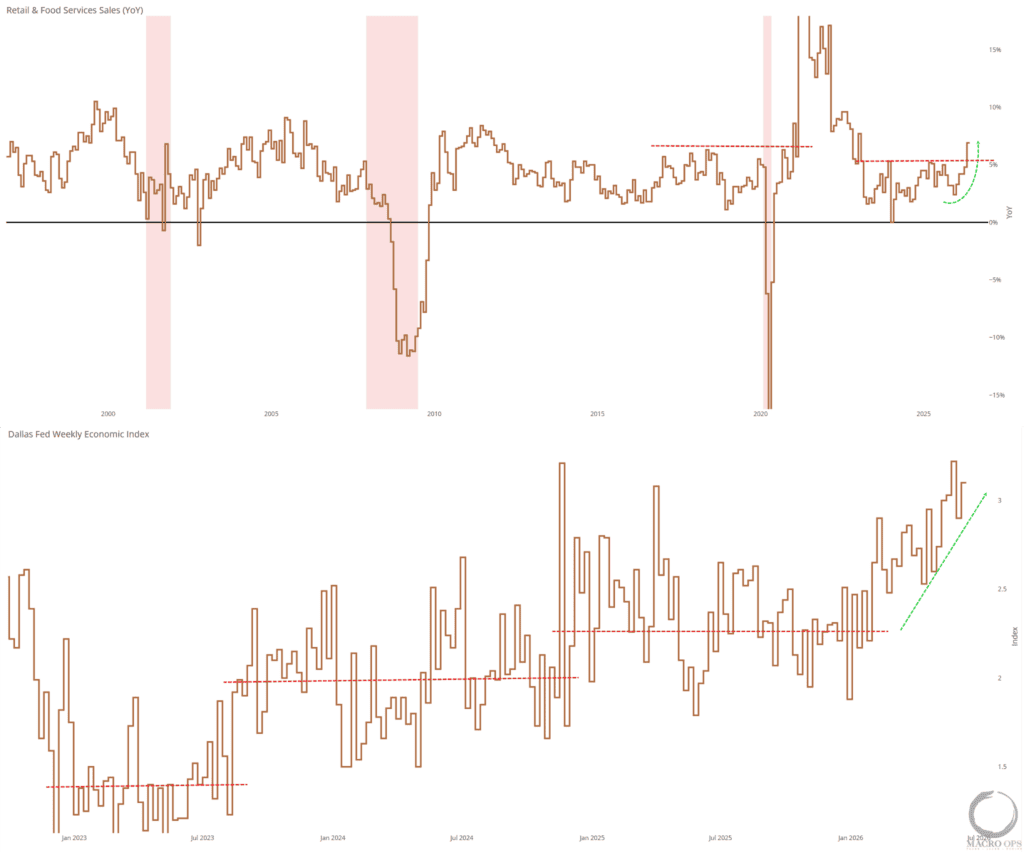
8. Both Real Retail Sales (top chart) and the Dallas Fed’s Weekly Economic Index (bottom chart) have jumped to multi-year highs. Similar to our ECRI, the economic data is increasingly pointing to a new regime marked by accelerating growth and sticky inflation.
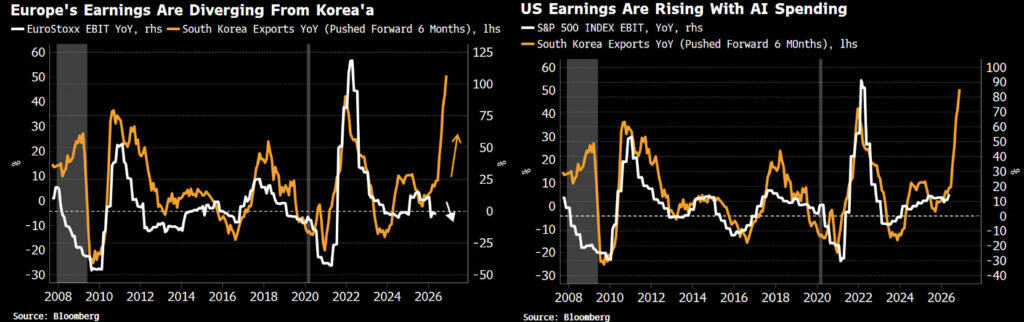
9. This is all largely driven by the massive AI CAPEX cycle in the US, which is why relative growth, rates, and the DXY should continue to move higher over the coming quarters (charts from BBG’s Simon White).
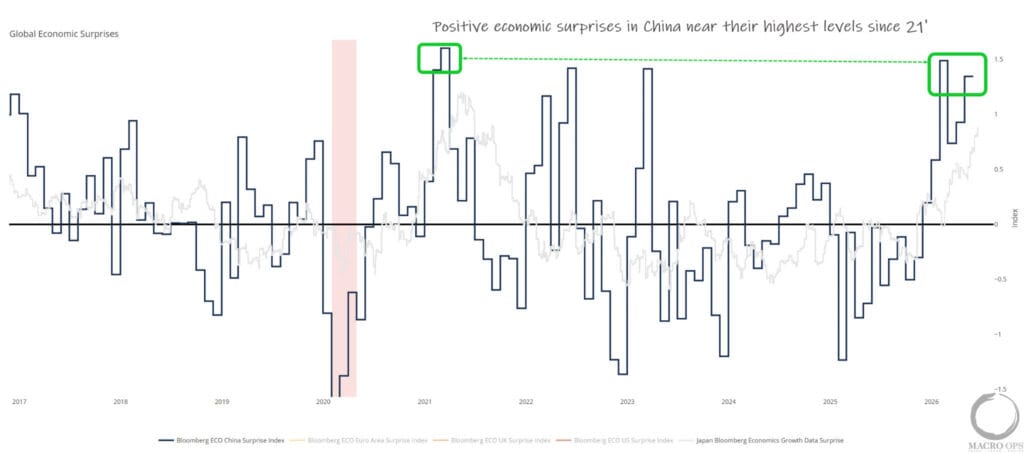
10. The other week I shared two charts showing China’s tightening financial conditions and negative credit impulse. So I was surprised to see in my study over the weekend that China’s Citi Economic Surprise Index (blue line) is near its highest levels since 21’. Has the bearish China narrative pendulum swung too far? If so, this will have big implications on global inflation and rates.
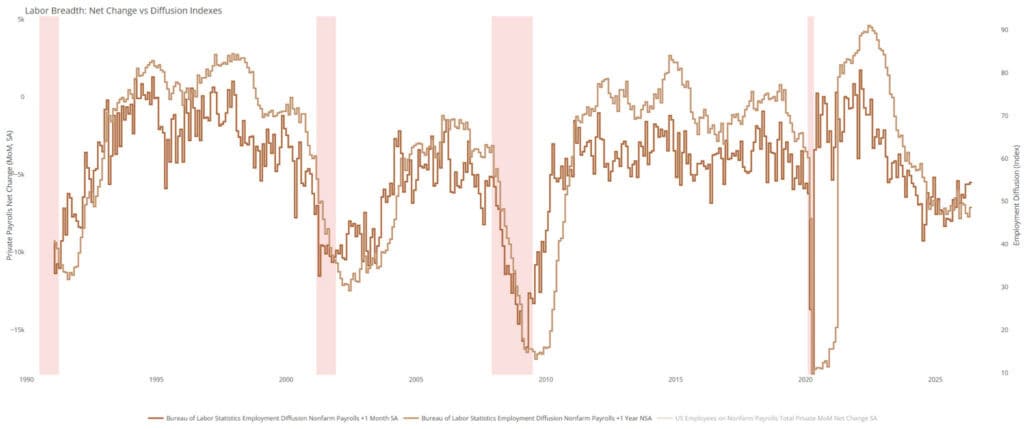
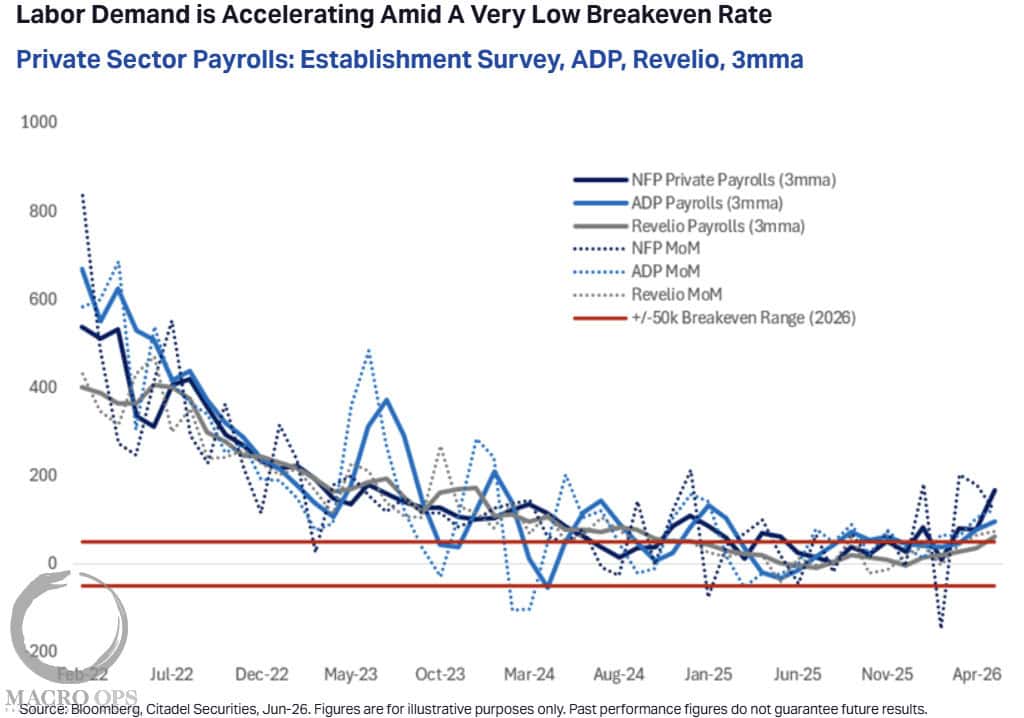
11. In the meantime, it’s starting to look like the labor market is turning a corner… Below on the top chart is the BLS’s Labor Breadth Diffusion on a 1m (amber) and 1y (tan) basis. And the second chart is from Citadel Securities which writes:
“From a markets perspective, we think this outlook is validated by our macro framework, in which we decompose moves in broad macro markets into their macro drivers (Growth and Policy). The framework implies that the performance of risk assets is largely offsetting the sell off in front end rates and policy pricing sits at just +0.48 st deviations, in the 58th percentile of its 5y history, implying there is plenty of room to price a more hawkish policy pathway.”
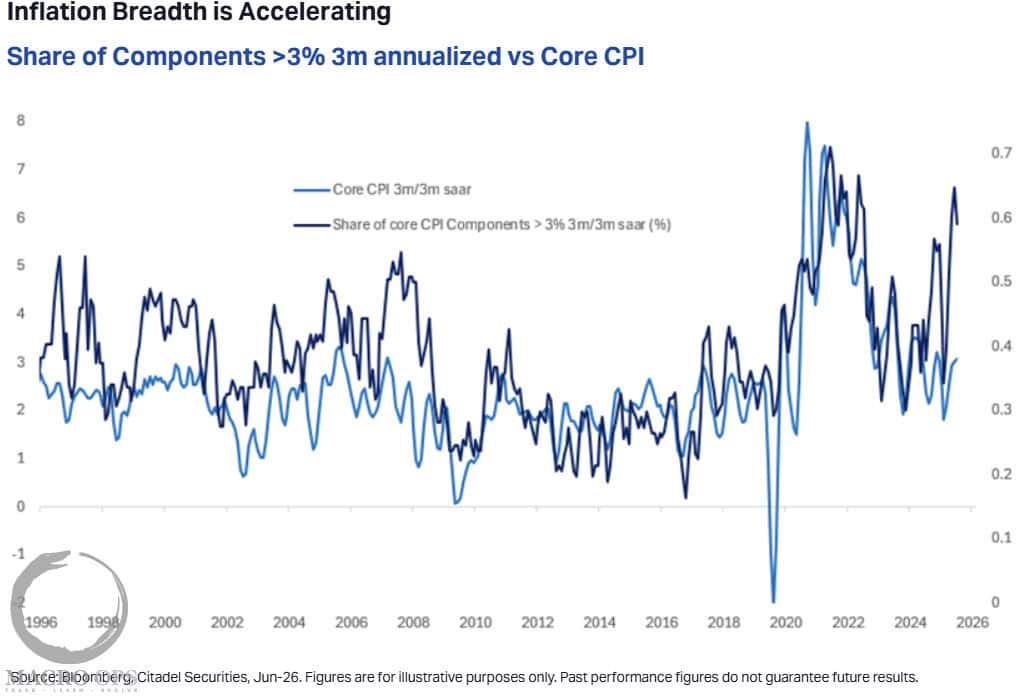
12. Again from Citadel: “We see a growing risk that the US inflation process is shifting toward a hysteretic equilibrium, in which more sustained price pressures may persist even after the initial energy shock fades. We think the near-term boost to headline inflation from higher energy prices, together with renewed supply-chain disruption, is likely to catalyze second-round effects at a particularly vulnerable point in the cycle, as a temporary price shock collides with our expectation of a positive output gap, easy financial conditions, a generational AI capex cycle ($0.75tn in 2026, $1.25tn in 2027), and a reaccelerating labor market. In that context, an unwind in oil prices may not be sufficient to offset the broader chain of events driving the inflation process.”

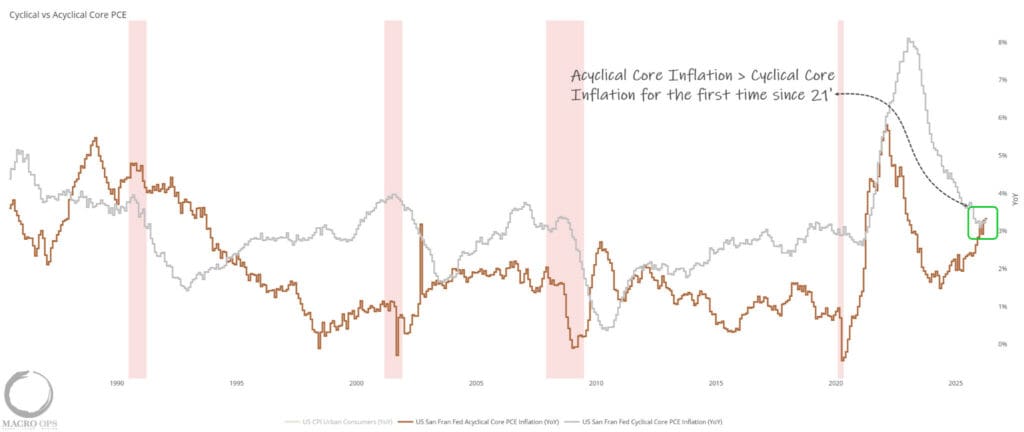
13. If you’re looking for evidence that the floor on inflation is shifting structurally higher, look no further than the chart below showing the Fed’s Acyclical Inflation index (amber) above their Cyclical Inflation (grey) for the first time since 2021.
Real yields have flipped negative again, meaning that the Fed is effectively easing by keeping rates steady. With growth accelerating, the labor market turning a corner, China starting to positively surprise, and the floor on inflation now higher, interest rates are going to have to rise.
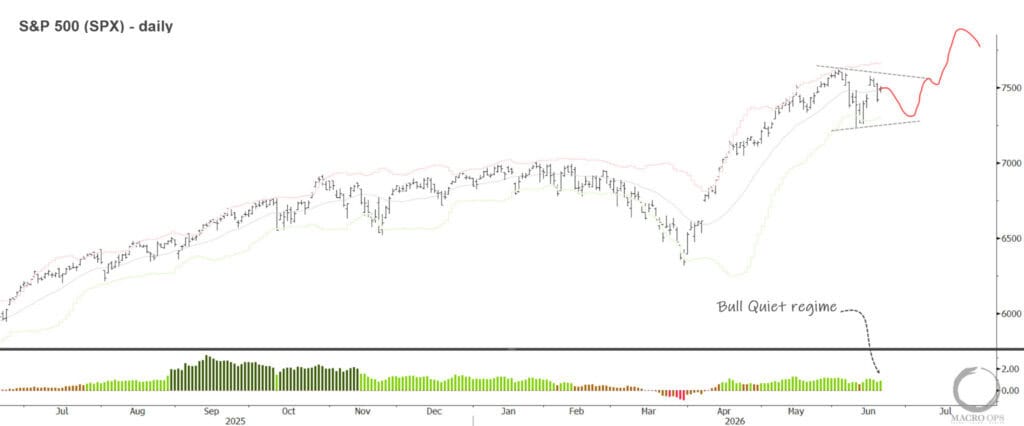
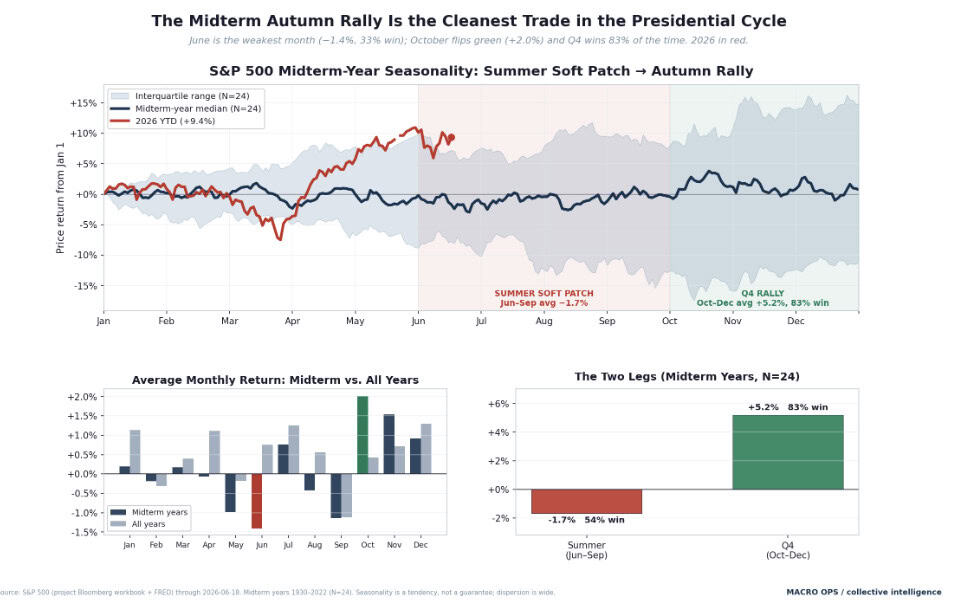
14. This week we enter the seasonal weak period of “June Swoon” that ends at the start of July. I don’t have strong conviction on the short-term path, though my bias is higher and if we get a swoon, I expect it to be short-lived. This market looks to me like it wants to trade up and we likely see it punch through 8k in a Summer rush — though watch rates, as they could end the party early.
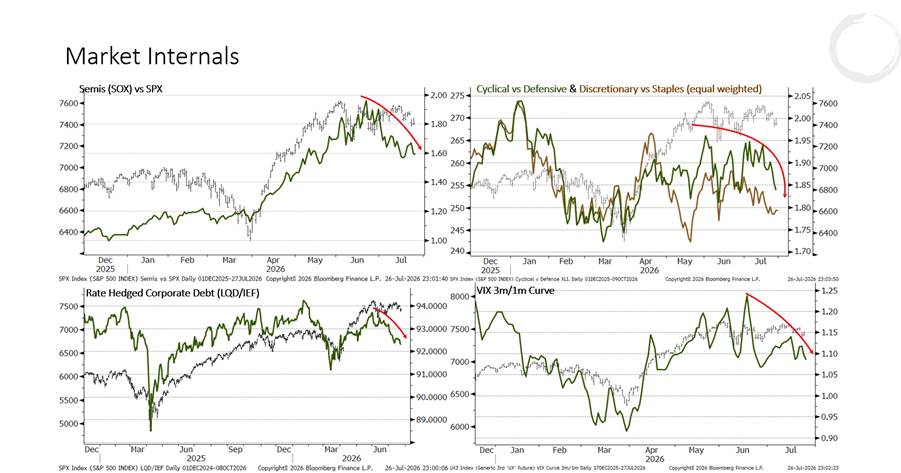
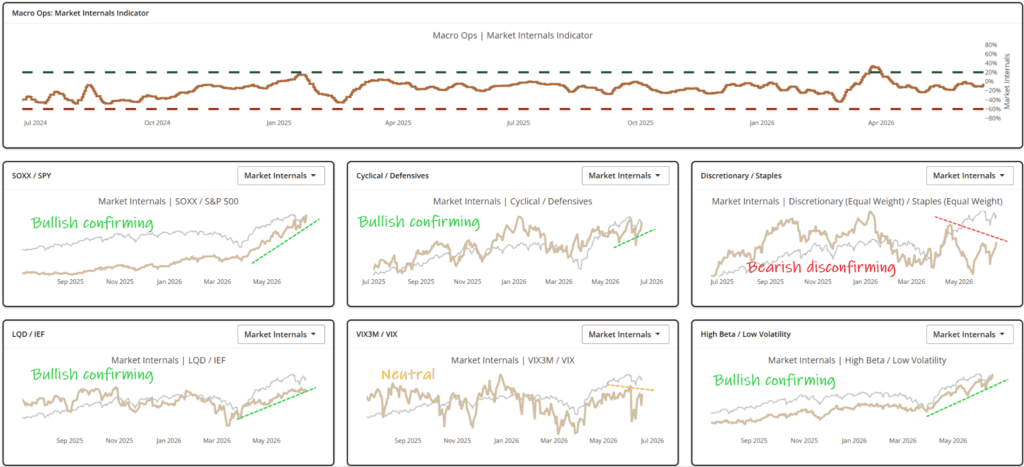
15. Aggregate Breadth remains at +2. Not incredibly strong, nor terribly weak. But enough to confirm the current bull trend (sell signals trigger at readings of +1 and below.
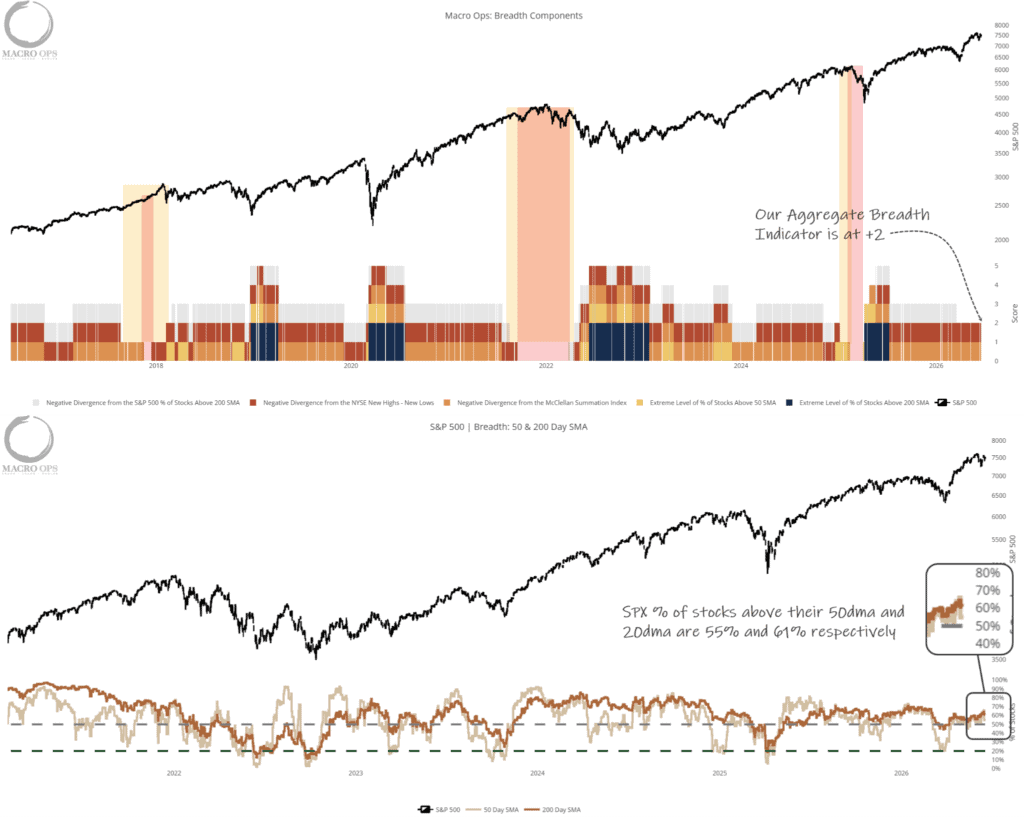
16. Internals continue to support the primary trend higher.
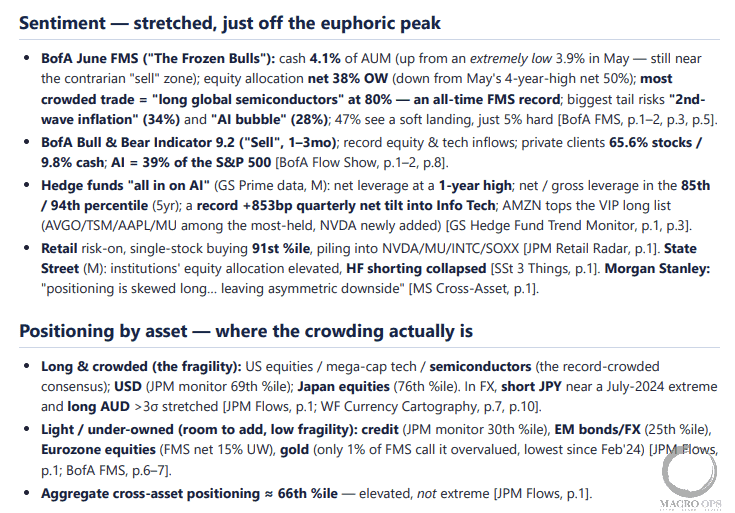
17. I’m in the process of training an AI to create a summary positioning & sentiment report off the dozen or so IB reports I read each week. Below is a snapshot of this week’s summary. The current sentiment backdrop is this: long term it’s stretched and indicative of what we typically see in the runup to a cyclical top, intermediate term its stretched as indicated by the BofA Sell Signal and retail flows, but short-term 0-2 months is where the market still has some room to turn up the heat a bit more.
Our Trend Fragility Indicator is at 63%, which is neutral. Small traders loaded up on puts these past two weeks making it one of the highest proportions of hedging in 25yrs. And while HFs are starting to finally crowd in, they’re doing it mainly by closing out shorts.
All in all, the sentiment and positioning backdrop is pretty bearish and we’re setting up for what will likely be a significant corrective period. But my low conviction base case is that we go parabolic first.
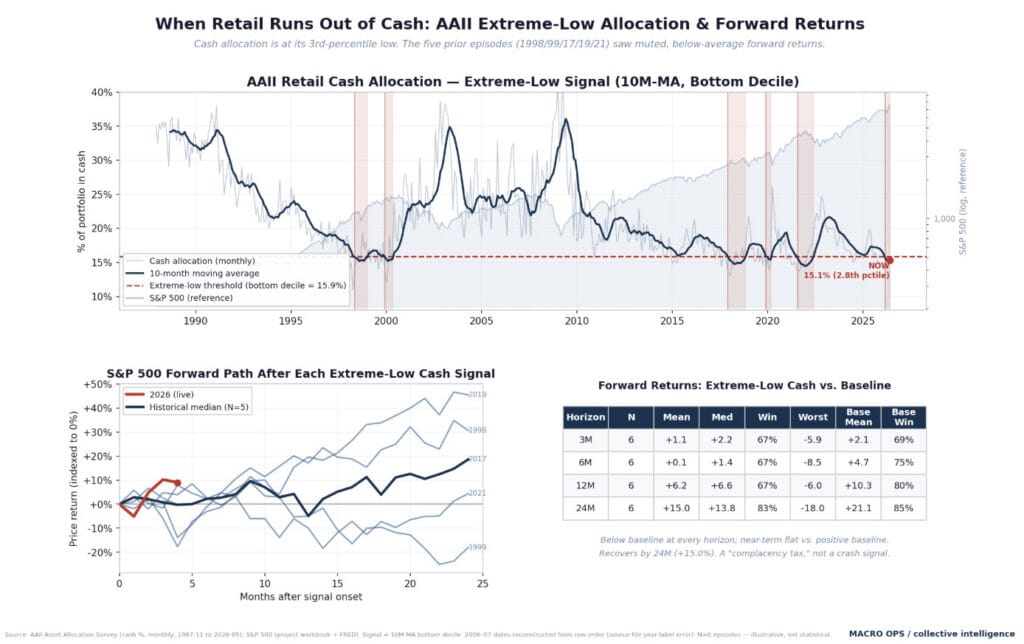
18. On that note, AAII Retail Cash Allocation has fallen to the bottom decline. File this under our longer-term positioning data points. Historically forward market returns 3-6 months out tend to be pretty poor.
19. So I’m thinking we climb a bit further here, maybe take out 8k in the SPX before rolling over into a correction for the rest of Summer inline with the seasonal midterm tendencies, setting things up for an Autumn rally maybe?
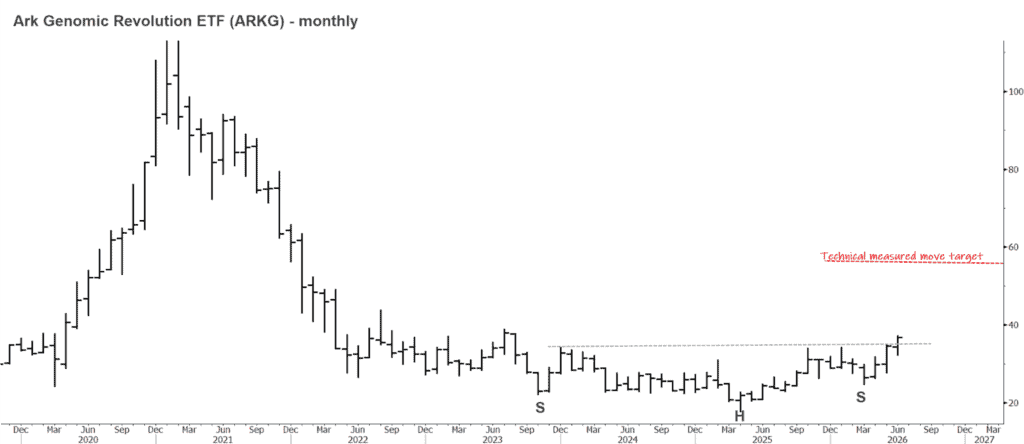
20. Our team is turning increasingly bullish on biotech. It’s at the bottom of its Capital Cycle. Sentiment and positioning are very low while industry wide fundamentals are starting to shift upwards — not to mention we expect the sector to be major beneficiaries of AI tech, specifically in the discovery process.
Thanks for reading.