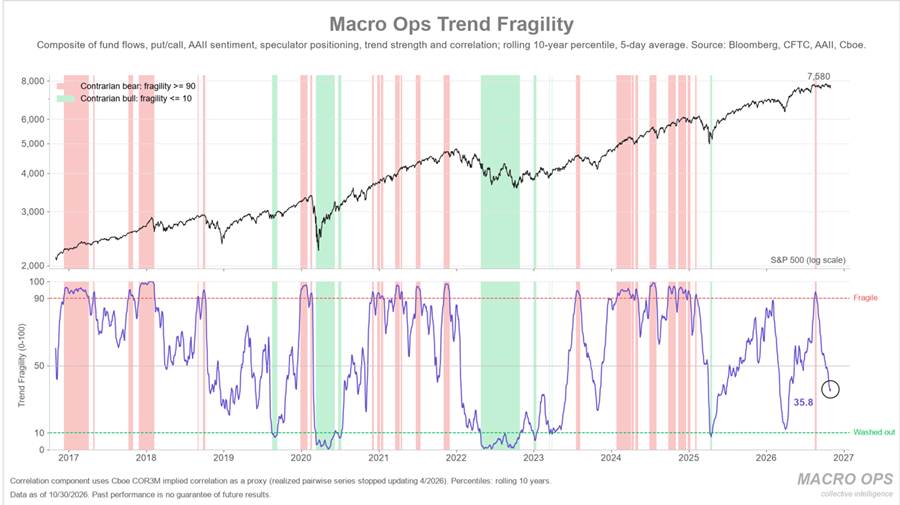
Summary: The tape is fugly no matter how you slice it. Yes, all the research out there is talking about how much funds have netted down. And everyone is pointing out the fact the SPX was higher 12 months later after all 19 midterms since 1950. Plus don’t AI earnings still look super good? While we think we see a sizable bounce in risk assets soon — potentially this week — the data that’s central to our process says this market is to be tactically traded and nothing more. We have a Trifecta Lens Sell Signal still in effect. Breadth divergence is still atrocious. Trend Fragility has yet to reset, meaning we’ve still not seen any real capitulation. And the list goes on… I walk through the bull case for an EMFX pair, and more…
*** Housekeeping note: As some of you know, the MO team recently joined an established asset management firm to manage capital utilizing the MacroOps investment process — if you are a qualified purchaser (please see attached description) and are interested in learning more, please let us know.
We’ve also recently expanded the team — bringing Dean Christians on board — and are in the process of merging our companies.
In November, MacroOps will relaunch with a new brand, website, and interactive quantitative dashboard featuring our models and proprietary historical datasets.
With these changes, we’ll be more than doubling Collective pricing at the relaunch to preserve the size and quality of our community. If you’ve been on the fence, now is a good time to try it and see if it’s a fit.***
MO Portfolio & Trades
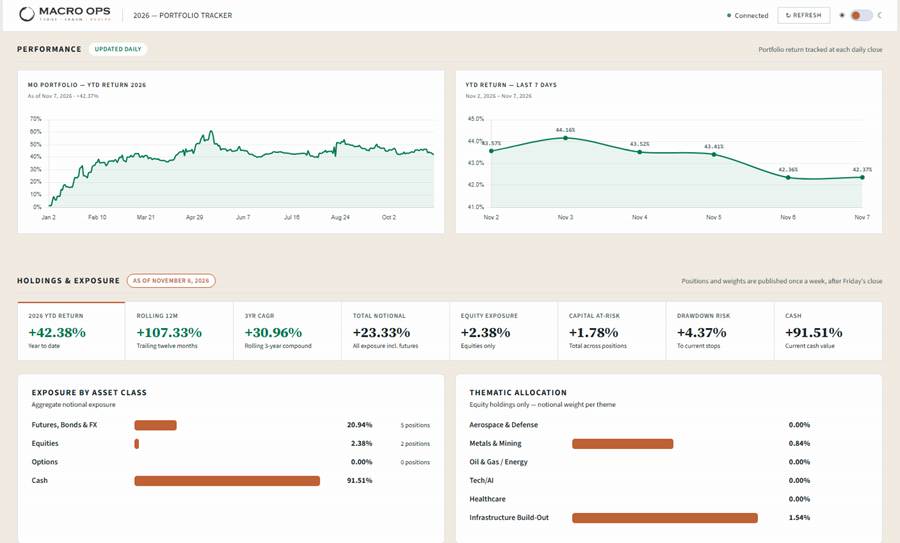
1. The portfolio fell 391bps last week and sits at +42.38% on the year, below our YTD high-water mark of +61%. We remain short Nasdaq, short soybeans, short copper, short sugar, long GBP, long a few select idiosyncratic equities, and continue to hold lots of cash.
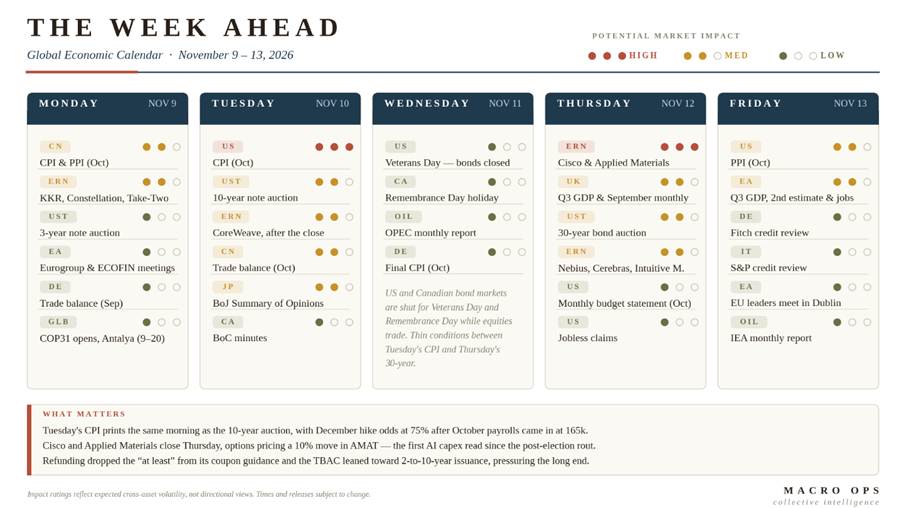
2. The week ahead in data. Tuesday’s October CPI is the week’s decisive release, printing the same morning as the 10-year auction, with December hike odds back at 75% following the 165k October payrolls report. Cisco and Applied Materials close Thursday after the bell in what amounts to the first genuine AI capex read since the post-election selloff, and the options market is pricing a 10% move in AMAT. Treasury’s refunding guidance dropped its “at least” qualifier last week and the TBAC leaned toward concentrating new issuance in the two- to ten-year sector, which has kept pressure on the long end into Thursday’s 30-year auction.
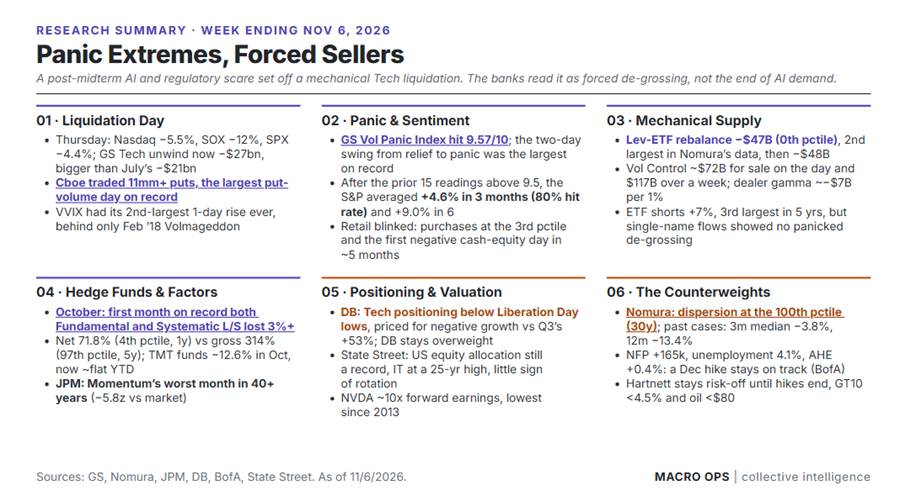
3. Research summary highlights: The post-midterm AI and regulatory scare set off a violent Tech liquidation on Thursday, with the Nasdaq down 5.5% and SOX down 12%. Volatility hit panic extremes: the GS Vol Panic Index reached 9.57 and Cboe had its largest put-volume day on record. The banks broadly read it as forced de-grossing driven by mechanical selling from leveraged ETFs and vol-control funds, not an end to AI demand, with hedge-fund nets washed out and DB’s Tech positioning below Liberation Day lows.
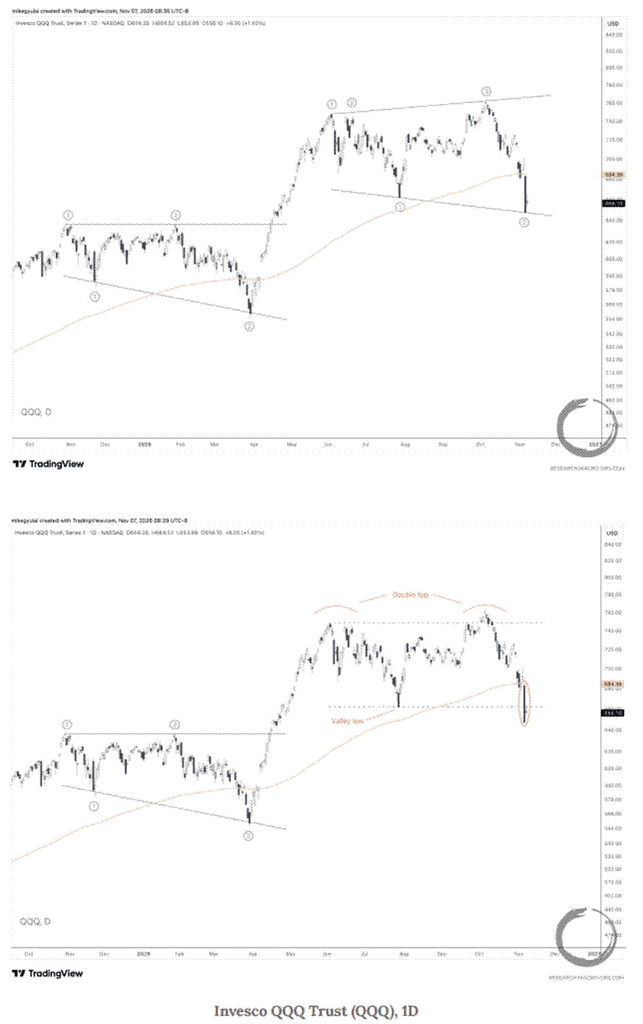
4. The tapes in US indices look increasingly ugly. Our resident Classical Chartist, Mike G, points to two possible interpretations of the current action in Qs. One is a broadening pattern, the other a completed 5-month double top. You can read his latest weekly here.
What does this mean?
Nothing concretely. Chart patterns point to possibilities, not certainties. However, there’s been a clear change in market character. And while the market is short-term oversold and a decent amount of length has been cleared out, which suggests a near-term bounce is likely. The bigger picture continues to be no bueno.
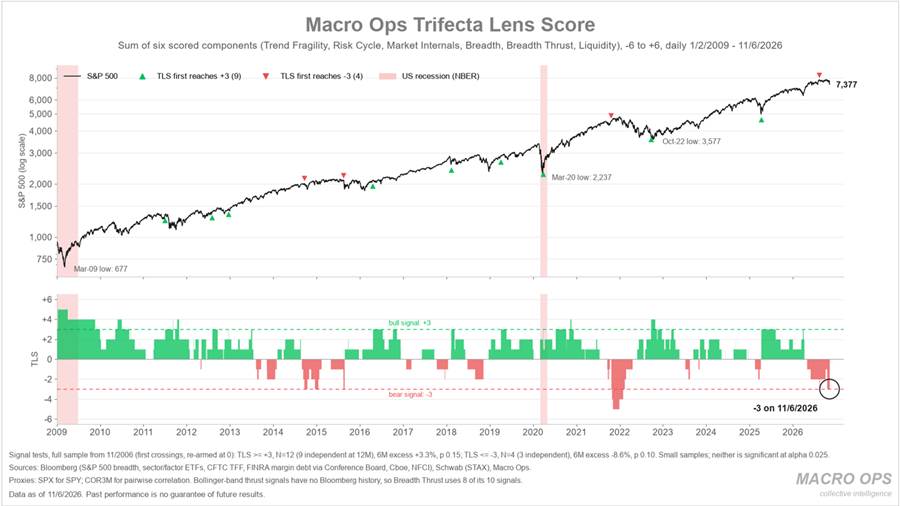
5. Our Trifecta Lens Score (TLS) chart shows why… It’s an aggregate of aggregates of our key technical, breadth, liquidity, internals, and macro data points. It dropped to a -3 at the start of October, giving it’s first significant sell signal since Dec of 21’.
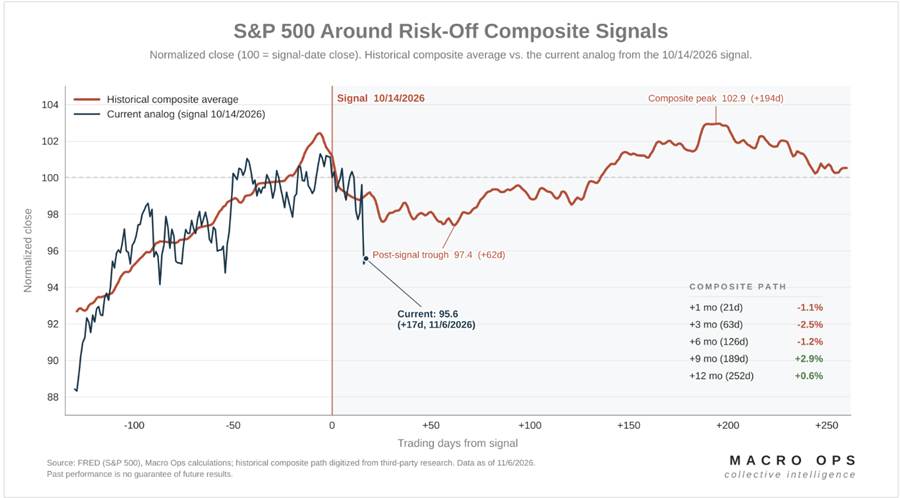
6. My teammate Dean’s TCTM Risk-Off indicator (which is based on purely technical measures) triggered a sell signal around the same time, which we noted here on Oct 19th’s DD titled “TCTM RISK OFF SIGNAL FIRED…”. Dean points out in his excellent weekend report that “Thursday’s selloff drove the current TCTM Risk-Off signal’s return well below the historical average for previous signals, making this an unusually weak start relative to historical precedent… It ranks as the fourth-worst start on record, trailing only February 1980, July 1998, and July 2007. The latter is a particularly compelling analog.”
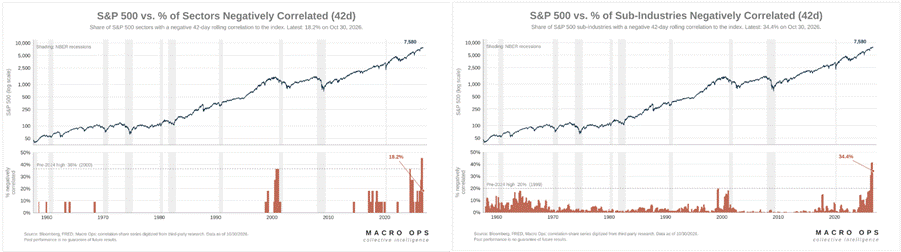
7. For months now we’ve been pointing out the increasingly anomalous nature of this market and how this is indicative of “Late Cycle” dynamics, which, as MO readers know, we firmly believe we’re in. Here’s some more strangeness to bolster our case, again from Dean’s recent report:
“Market anomalies continue to surface, underscoring the increasingly distorted environment created by extreme market concentration, financial engineering, and evolving market structure. Consider the correlation between the S&P 500 and its 11 sectors. Historically, sector performance has closely tracked the broader market. Today, however, five of the 11 sectors have a negative correlation to the S&P 500, an exceptionally rare occurrence. The only similar period was in early 2000. The same correlation breakdown extends across sub-industry groups, where the percentage exhibiting negative correlations to the S&P 500 has also reached a record high ”
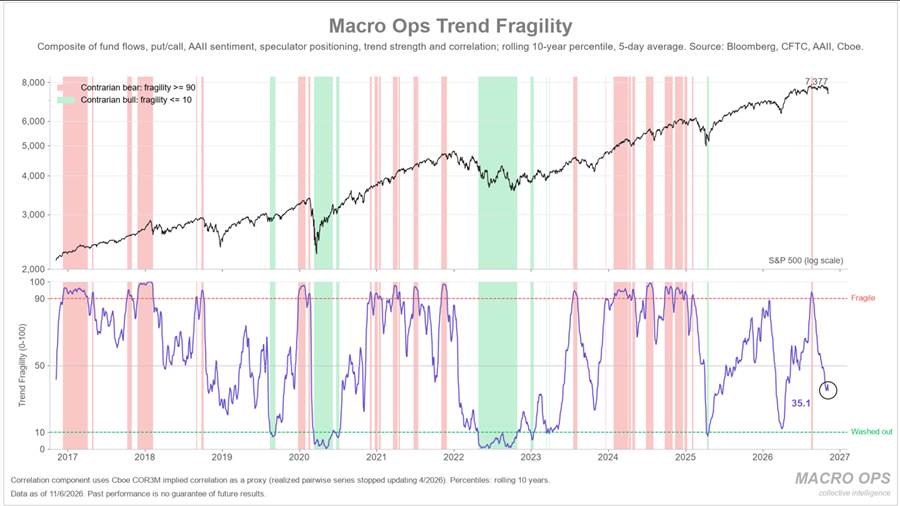
8. Last week we wrote that we still weren’t seeing any signs of broad market capitulation. And, frankly, this is still the case. Despite the carnage amongst hedge funds and the rout in the AI space, our Trend Fragility indicator (an aggregate of sentiment and positioning measures) is only at 35%. Well above the 10% threshold that marks more durable lows, and which I’d want to see after the “Fragile” sell signal that was triggered back in October.
The consensus amongst the banks is that the past few weeks have been purely a positioning liquidation event. Nets have been taken way down. And forward market returns post midterms have been positive every single time since 1950 etc…
Look, I think we probably bounce soon. But this continues to be a very tactical market. Meaning short term swings and light positioning.
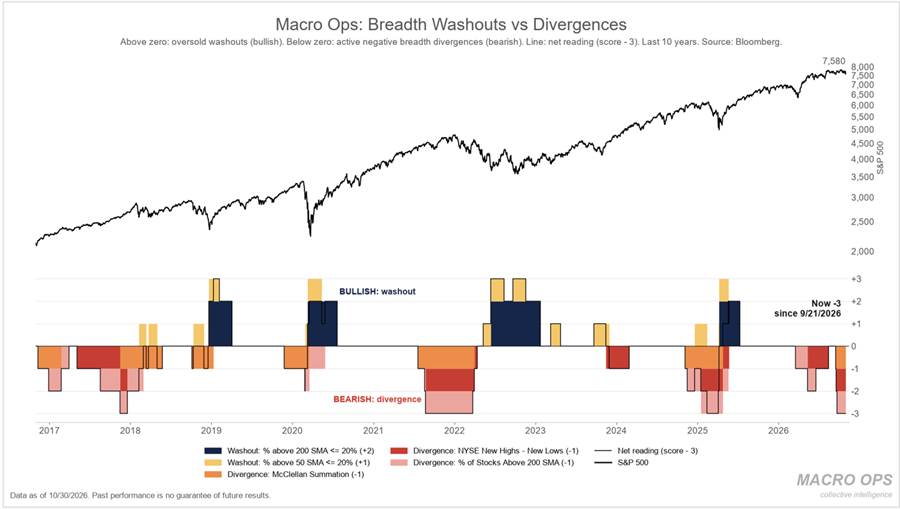
9. I’m just running through a few of our core charts so I can show you guys what we’re looking at, and why we remain hesitant to call a durable low. Our Breadth Washout/Divergence chart is still at -3. Historically, this leads to very poor 3 month+ returns. We need to see this flip positive before we turn more constructive on risk.
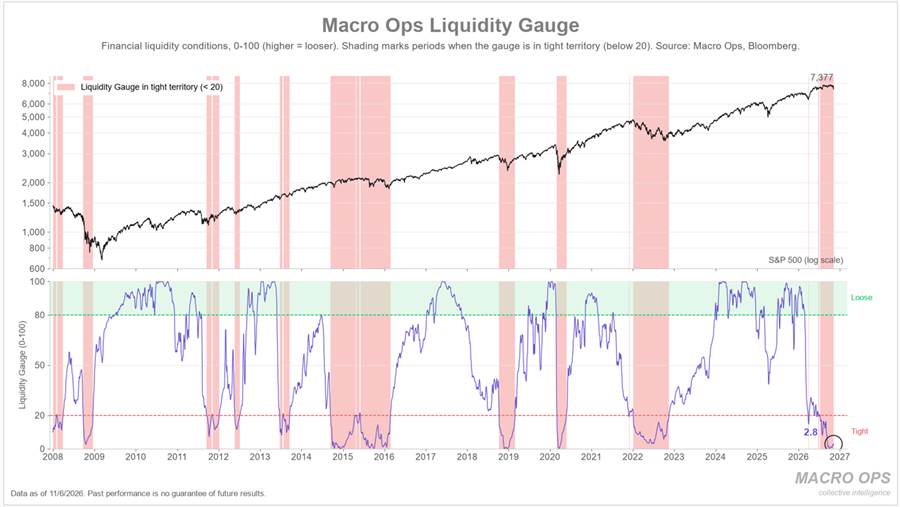
10. Our composite liquidity gauge is just coming off the 0th percentile. Again, similar to the above, this is historically very poor for forward equity returns (red shading marks past instances).
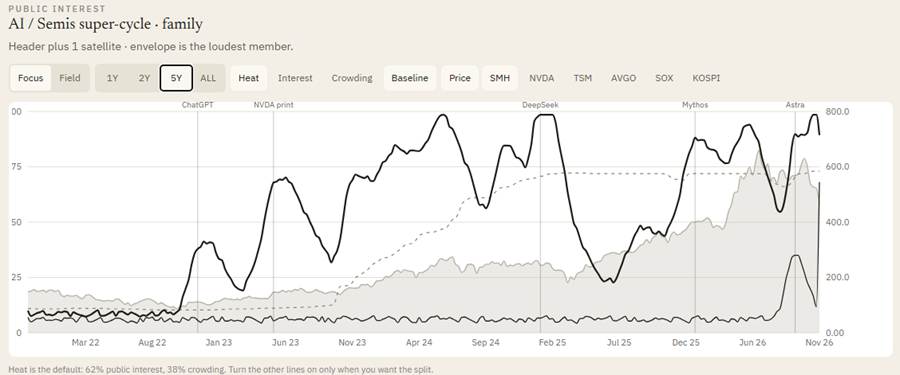
11. My Narrative Pendulum tool which I highlighted a few months back, and is still in Beta, is further proof of no sign of a full reset. AI Narrative Intensity is still above the 90th %tile, after hitting the roof at 100% last month, despite the negative divergence in the AI space.
I’ve been at this game for a while now. This type of narrative stubbornness is what you see at market tops. There’s always this reluctance to degross and accept things may have changed. Pavlov’s dogs have been too conditioned to the preceding regime to not salivate when the bell is run (dip in risk).
Look… I’m no permabear. And I can and will change my tune as early as tomorrow should my process say to do so. Also, tops are processes, not events. So I definitely don’t expect a cyclical bear to begin next week. However, I do think we’ve started the process of putting in a major cyclical top that will play out over the next 3-9 months.
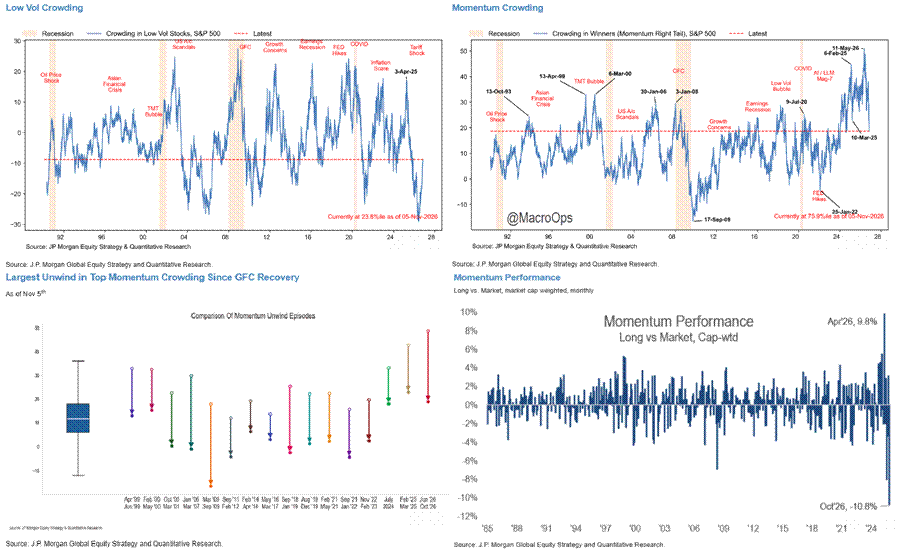
12. These are killer charts from JPM over the weekend. Again, more things you see when you’re in a “Late Cycle” regime.
- October’s long-momentum portfolio underperformed the market by roughly 11%, its worst month in about 40 years and nearly a six-standard-deviation event. The broader long/short momentum drawdown reached 38.4% from June’s peak.
- Largest unwind in top momentum crowding since the GFC recovery / Momentum crowding. Crowding fell from the 100th to the 76th percentile against 40 years of history. Against more recent history, it is now at the 43rd percentile over five years, fifth over three years, and lowest over one year.
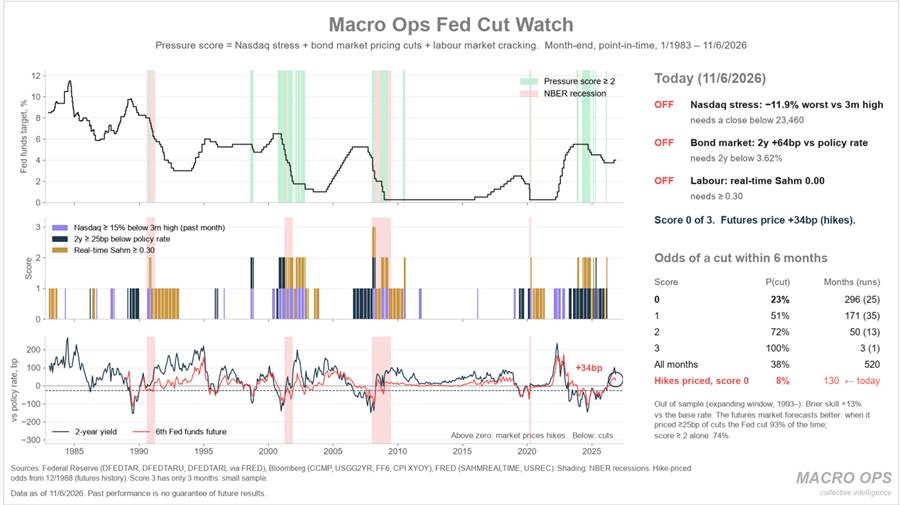
13. This type of market regime requires patiences and discipline above all else. Because these regimes provide one with ample opportunities to repeatedly shoot oneself in the foot. Since we’re holding high cash and keeping things tactical, I’m spending much of my time focusing on what comes next. One of the best trades that come out of a Late Cycle / Market top is to go uber long the front end.
One of my core models for quantifying when the conditions for a Fed Cut setup are in effect, is below. Greenshading marks these conditional regimes. As of now, none of the conditions are live. Though I imagine in another 3-6 months they may be.
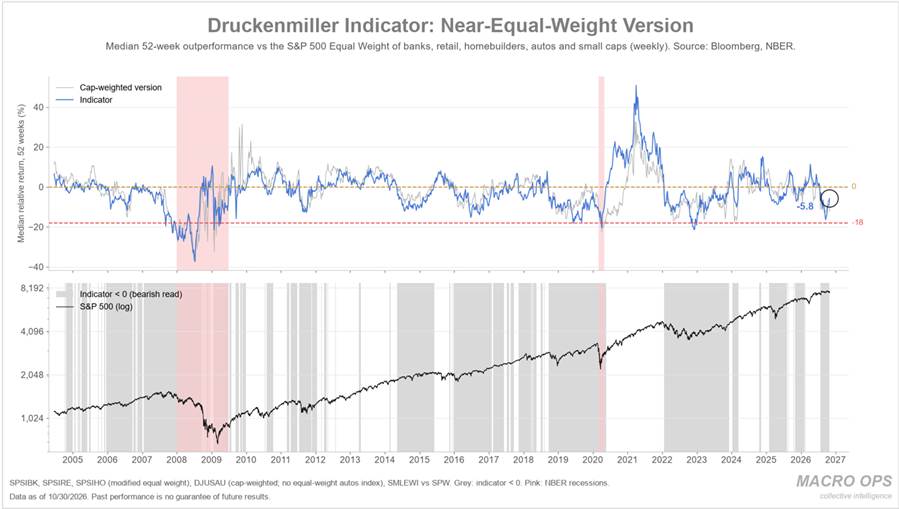
14. Another piece to this setup that we track is our equal weighted cyclical econ lead (aka: The Druckenmiller Inidicator). You can see that it’s currently negative but still below the recessionary threshold and I don’t expect we get there until longer-term measures of financial conditions tighten more broadly (h/t to Simon White for the idea for this one).
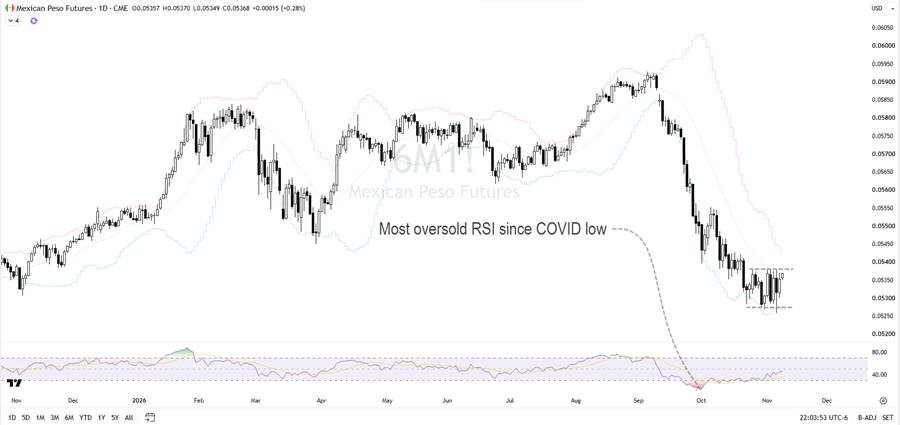
15. Long Peso looks interesting here. I know, this is typically not a currency you want to buy when you’re not particularly bullish risk assets in general. But, as I said above, I think we’re due for a short-term bounce. And… the peso has some other things going for it. As measured by RSI, it recently hit its most oversold level since the COVID crash. The tape has been consolidating in a tight daily range.
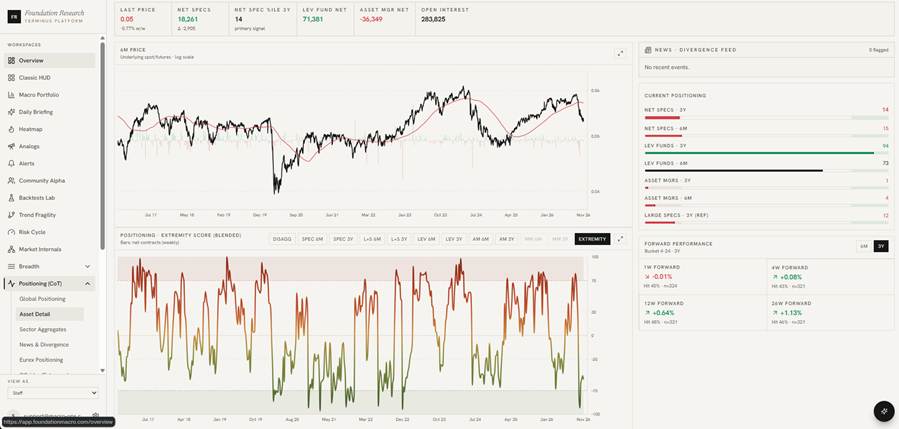
16. Our composite measure of CoT positioning is coming off the 6th percentile.
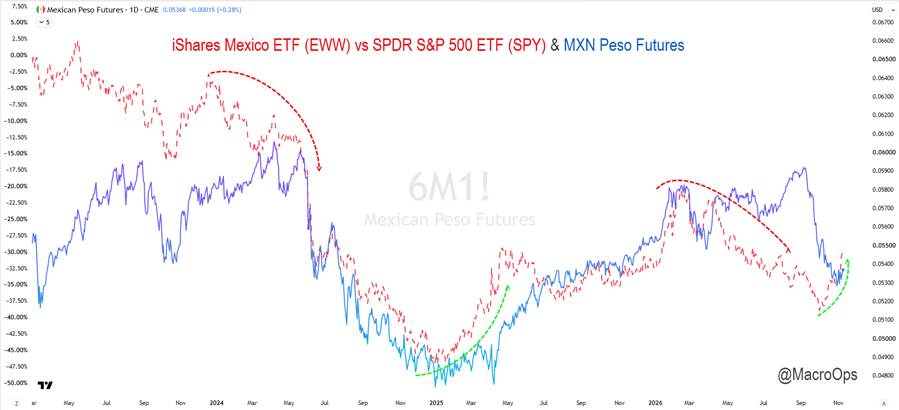
17. And relative equity performance, as measured by EWW vs SPY (dashed red line) is diverging higher. We can see that this has led the last three major turning points in the currency pair.
So I like this setup, despite the lack of conviction on the broader market. Also, I’m quite bearish the dollar looking out the next 1-3+ years. Concentration in USD assets remains at all-time record highs. Once these Core vs Periphery flows begin to reverse, there’s going to be some monster trends in the currency space, as well as EM and real assets. I think we’re getting closer to this.
Thanks for reading.