I know you want to buy RBLX shares. Everyone does. Your five-year-old nephew who got approved for Level 3 options trading with Robinhood wants some RBLX. Parents who pay thousands a year for RBLX in-app purchases want RBLX shares to hedge their child’s expensive gaming habit.
Roblox enables user-generated content from a community of developers and creators who build immersive and engaging experiences found only on Roblox, as well as the vast majority of the items for customizing avatars.
Upon signing up for Roblox, users personalize their avatars by selecting body types, clothes, and gear. Users are then free to immerse themselves in the millions of developer-built experiences.
In short, RBLX enables anyone to create, build, and publish real-time 3D experiences to the massive RBLX gaming community.
We won’t dive deep into the company’s fundamentals or qualitative aspects. If you want that, I highly suggest reading Mario Gabriele’s S-1 analysis.
The purpose of this essay is to examine the company’s cash-generating capabilities under three frameworks:
- Operating Cushion
- Core Operating Growth Profile (COGP)
- Free Cash Flow Growth Profile (FCFG)
In doing so, we can see how powerful (or not) RBLX’s business model is when it comes to producing free cash flow. COGP analysis also helps us understand the differences between what a company reports on an income statement and what it shows on the cash flow statement.
We outlined this framework in our two posts: Cash Flow: It’s All That Matters & Cash Flow: It’s All That Matters (Pt. 2).
Grab a cup of coffee, and let’s get after it.
What is Operating Cushion and Why Does It Matter?
We need to compute Operating Cushion to get to our Core Operating Growth Profile. Let’s break that down first.
Operating Cushion (OC) is the percentage difference between your Gross Margin % and your SG&A %. In English, it’s the contribution of a $1 increase in revenues to operating profits. Hold working capital constant and Operating Cushion = Core Operating Growth Profile.
But we know we can’t hold working capital constant for most businesses.
Let’s break this down into two parts:
- Operating Cushion
- Cash Needs (i.e., working capital requirements)
Operating cushion orbits around two ideas:
- The higher the operating cushion, the more cash a company will generate as it grows top-line revenue
- The lower the operating cushion, the less cash a company generates as it grows top-line revenue
There are two ways we can raise our operating cushion. We can either 1) increase gross margin through raising prices or lowering COGS (cost of goods sold) or 2) reduce SG&A by reducing headcount, increasing operational efficiency, and streamlining backend processes.
Operating Cushion Reveals The Value Of Revenue Growth
OC tells us if top-line growth increases cash or drains cash.
This matters when we value companies based on top-line revenue growth over a 3-5 year period. How much worth can we place on top-line sales growth if the company’s business model consumes cash as it grows? Not much!
That said, it does matter where a company is along its growth cycle. Early-stage growth companies will devour cash as they take market share and expand manufacturing, capacity, and employees. Those companies will show severely damaging operating cushions.
We want to invest in businesses that generate positive and growing operating cushions.
Alright, let’s head to RBLX’s S-1 and construct our Operating Cushion profile.
Analyzing RBLX Operating Cushion
We’re using the company’s reported financials from its S-1 filing.
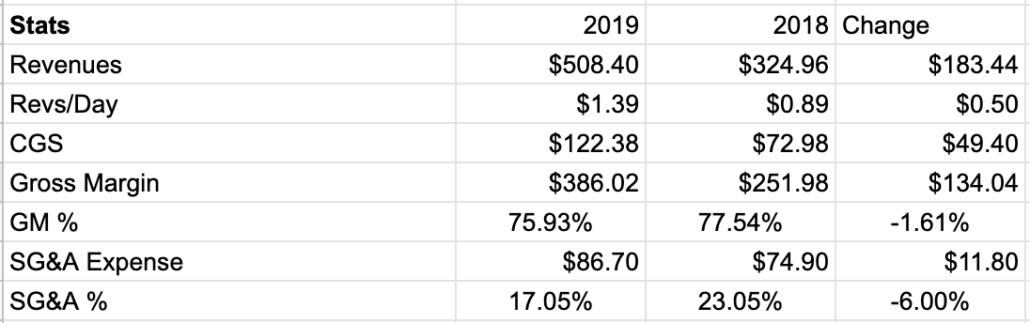
The first step in our OC analysis is to determine RBLX’s Gross Margin percentage. We do this by taking Revenue less Cost of Revenue for each year.
That gets us 77.54% in 2018, 76% in 2019, and 74% in 2020. You can see the formula below.

Rather simple. Next, we calculate RBLX’s SG&A expense as a percentage of revenue. Luckily for us, the company bifurcates its SG&A expense, so all we do is add the numbers. That gives us 23% in 2018, 17.05% in 2019, and 16.86% in 2020 (see below)
To get Operating Cushion, we subtract our Gross Margin % from our SG&A %. That gets us 54.46% in 2018, 58.87% in 2019, and 57.18% in 2020. Here’s a full breakdown of the process
There are a few things we can observe from calculating RBLX’s Operating Cushion. First, the company lost a mere 3% in Gross Margin after growing revenue 184%.
Second, RBLX has serious operating leverage on its SG&A expenses. SG&A as a percentage of revenue declined over the last three years. In other words, the company’s generating more revenue at a faster pace than they’re increasing SG&A.
RBLX sports consistent mid-50s Operating Margin percentages. For every $1 the company generates in revenue, the company adds $0.58 in operating income.
Understanding How Growth Impacts Cash Flows
We can study RBLX’s YoY changes in Operating Cushion to better understand how growth, gross margin, and SG&A impact its cash flows.
Let’s start with 2018 to 2019. We computed our Operating Cushion figures to reflect the YoY changes (see below):
Two levers impact a company’s cash production:
- Growth: Increase top-line revenue at higher rates than its expenses
- Changes in Margin Percentage: Improve operations to generate more cash with fewer inputs (capital, labor, etc.)
The significant part about Operating Cushion analysis is we can isolate each variable to determine what lever a company uses to drive positive (or negative) cash impact. Let’s start with Gross Margin.
To isolate Growth, we take the company’s initial year Gross Margin and multiply it by the YoY change in revenue. In RBLX’s case, that gives us +$142.24M. In English, RBLX’s revenue growth resulted in an inflow of $142.24M in cash.
Next, we isolate the Change in Margin cash impact. To do that, we take the most recent year’s revenue and multiply it by the change in Gross Margin %. For RBLX, that means $508.40M * (-1.61%), which gives us -$8.20M. In English, the gross margin percentage change resulted in an $8.20M cash outflow from the company.
Combining the two gives us the cash impact of growth on gross margin (see below):
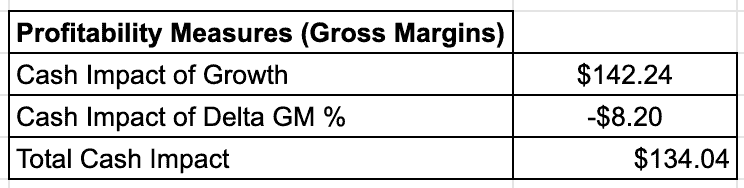
A $183.44M increase in revenues resulted in a positive $134M cash impact on gross margin growth.
Now we do the same thing for SG&A to complete our Operating Cushion profile.
First, we multiply our initial year SG&A % (23.05%) by the YoY revenue change ($183.44). That gets us -$42.28M in cash impact of growth. In English, RBLX had to spend an additional $42.28M in SG&A to account for the $183M in revenue growth. But that’s only one part of the equation.
RBLX improved Its efficiencies by reducing its SG&A percentage by 6% (or 600bps). In doing so, the company saved ~$30M in cash impact. Combined, an $183M increase in revenue resulted in a total SG&A cash outflow of $11.80M. That’s not bad!

We now have a complete picture of RBLX’s Operating Cushion and the cash impact of both top-line growth and operational efficiencies in GM and SG&A from 2018 – 2019:
- Cash Impact of Growth: ($142.24M – $42.28M) = $99.96M
- Cash Impact of Margin Changes: (-$8.20M + $30.48M) = $22.28M
- Total Cash Impact of Growth & Margin Changes on Operating Cushion: ($99.96M + $22.28M) = $122.24M
Let’s see 2019 – 2020 figures. Don’t worry; we won’t go through it step-by-step. I encourage you to do that at home. For reference, RBLX grew revenue by $415.49M from 2019 to 2020. Here are the results:

- Cash Impact of Growth: ($315.47M – $70.86M) = $244.62M
- Cash Impact of Margin Changes: (-$17.50M + $1.83M) = -$15.68M
- Total Cash Impact of Growth & Margin Changes on Operating Cushion: ($244.62M – $15.68M) = $228.94M
Step back from your monitor. Take a breath, sip some coffee and pat yourself on the back. You just completed an Operating Cushion analysis on RBLX!
We’re now halfway to computing RBLX’s Core Operating Growth Profile. To get there, we need a few more components. Down another chug of joe, and let’s get back after it.
Accounting For ROBLOX’s Working Capital Requirements
We have our Operating Cushion formula (GM % – SG&A %). To get Core Operating Growth Profile, we add the cash impact of a company’s working capital requirements.
Working capital comprises three (or five) balance sheet categories: Accounts Receivables (A/R), Accounts Payable (A/P), Inventories, Deferred Revenue*, and Prepaid Expenses*. I starred the last two because not every business will have deferred revenue or pre-paid expenses.
We need to take our working capital categories and translate them into percentages of revenue. Viewing each as a percentage of revenue allows us to easily calculate with our Operating Cushion (also expressed in percentage terms).
One final note before we dive into the numbers: we express A/R, Inventory, and Pre-paid Expenses as negative percentages. We do this because each category (usually) drains cash.
In turn, we make Accounts Payable and Deferred Revenue positive percentages. An increase in A/P means fewer bills to pay today (but more tomorrow). We add deferred revenues to working capital to reflect the inherent gain we’ll receive in cash once we collect payment.
Let’s head to the balance sheet to find RBLX’s working capital requirements.
RBLX Working Capital Requirements
Here’s a snapshot of RBLX’s balance sheet from the S-1 filing:

The company doesn’t report any inventory. RBLX vendors financed 1.30% of every revenue dollar, so all we need are A/R, A/P, Prepaid expenses, and Deferred Revenue. Here’s RBLX’s working capital as a percentage of revenue for 2018 – 2020:

Here’s what each percentage means (using 2020 numbers):
- A/R:73% of every revenue dollar went uncollected during the year.
- A/P: RBLX vendors financed 1.30% of every revenue dollar
- Deferred Revenue:46% of every revenue dollar RBLX collected upfront from its customers without recognizing it as revenue.
Since Working Capital % is a positive number, RBLX generates cash from WC as it grows revenues. Thanks in large part to deferred revenue.
We can also measure the cash impact of A/R and A/P as it relates to inflows and outflows from 2018 to 2019 (see below):
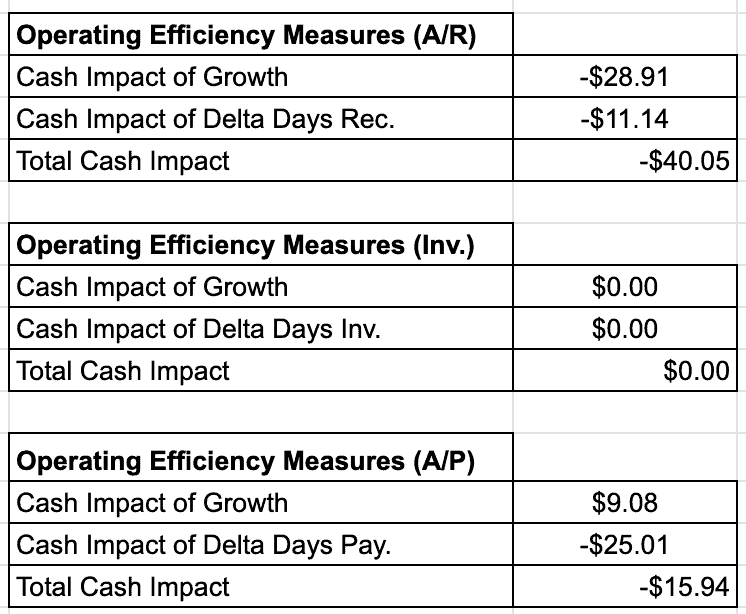
Now the English translation:
- $40.05M of RBLX’s $183M revenue growth went uncollected by year-end.
- The company financed $15.94M of its revenue for its vendors after reducing Days Payable from 20.29 to 2.33.
Let’s run it for 2019 – 2020 and see what we get (see below):

There are a couple of differences between our two periods. First, notice that A/R drained $110M more cash than the previous period. 52% of the cash outflow comes from an increase in Days Receivables. In other words, RBLX had more money tied up in receivables this past year than 2018 -2019.
Second, the company had its vendors finance ~$10M in revenue for the period (positive A/P). Most of the financing came from an increase in Days Payable (I.e., RBLX took longer to pay vendors for their services).
Finally, we get the total YoY cash impact of growth and change from 2018 – 2019 (see below):

Between changes in growth and operating efficiencies, $183M in increased revenue resulted in +$66.25M cash inflows. In other words, the top-line expansion added value to the company.
Now let’s check the 2019 – 2020 figures (see below):

The changes in growth, margins, and operating efficiencies resulted in $83.03M of cash inflows from its $415M in top-line growth. Yet another example of how RBLX creates value from revenue growth.
Putting It Together: Core Operating Growth Profile (COGP) & Free Cash Flow Growth Profile (FCFGP)
We’re in the home stretch! If you’ve made it this far, congratulations. You’ve learned how to analyze RBLX’s cash flows in ways you won’t see/hear on CNBC or many Wall Street “Investing” Newsletters.
The last piece of the puzzle combines Operating Cushion and WC Requirements to get Core Operating Growth Profile. From there, we subtract taxes and CAPEX to get a company’s FCF Growth Profile. These two final figures allow us to see how much cash a company generates (or destroys) for every incremental $1 increase in revenue. Isn’t that exciting?
COGP/FCFGP are forward-looking figures. The metrics report the amount of core operating cash flow/FCF that we can expect for any measured amount of growth in revenue under the assumption that a firm’s operating cushion and operating working capital remain unchanged.
Here are RBLX’s 2018 – 2020 Core Operating Growth Profile figures:

RBLX’s Core Operating Growth Profile is (to use a technical term) nutty. The company sported an 80% COGP in 2020.
Since COGP is forward-looking, we can assume that for every $1 in incremental revenue RBLX generates during 2021, ~80% of that should flow through to core operating cash flow. That’s an astounding figure.
From here, we get FCFGP by subtracting CAPEX and taxes as a percentage of revenue. We got our CAPEX data from RBLX’s FCF breakdown in its S-1 filing (see below):

Next, we add our Provision (or Benefit) from Income Taxes and report both CAPEX and Income Tax Benefits. What’s left is our FCF Growth Profile percentage (see below):

The company’s FCFGP increased 16% since 2018 thanks to an 8% increase in COGP and an 8% decrease in CAPEX spend.
Again, FCFGP is a forward-looking number. We can assume (if their business model stays the same) that for every $1 in incremental revenue RBLX generates during 2021, ~67% of that will flow through to free cash flow (owner’s earnings).
COGP/FCFGP Peer Comparisons
Let’s see where RBLX falls compared to some of its industry peers. Like before, we won’t go through each step but instead show you the final figures and interpretations.
We’ll use three comparables: Unity Software (U), Take-Two Interactive (TTWO), and Electronic Arts (EA). We’ll also use 2020 financial data for our analysis. Please let me know if there are better comparables than the ones mentioned, and I will add them to a revised edition of the essay.
Here are the results:

The only company that comes close to RBLX on a COGP basis is Electronic Arts (EA), at 65.31%. At their current states, both U and TTWO drain cash as revenues grow.
Notice how much RBLX spends in CAPEX as a percentage of revenue compared to its peers. Granted, TTWO and EA are more mature businesses. So we’re not expecting massive CAPEX expense. But U is a younger, faster-growing company, yet it spent ~5% on CAPEX in 2020. Looking at it this way, you can see how much cash flow RBLX will generate once it reduces expansion/growth CAPEX.
Sidenote, EA’s 27% cash inflow from income taxes is a one-off occurrence. Back that out, and their FCFGP looks more like RBLX.
The Power of COGP/FCFGP Analysis
Our RBLX Cash Flow Analysis revealed a tremendous business that generates substantial cash as it grows through a combination of top-line growth, operating efficiencies, and positive working capital.
The benefit of analyzing RBLX through a COGP/FCFGP framework is that we get to the root of what matters: how the company generates cash and if growth adds or destroys value. You can’t see that if you only examine the income statement.
COGP/FCFGP allows us to see where a business drives its cash flows and if those cash flows are sustainable in the long-term.
I hope you enjoyed this post. At some point, I want to make these COGP/FCFGP analyses a content staple, especially with newer IPOs. If there are any companies you want me to write about (in this format), please let me know!


