Last month I wrote about Cash Flow vs. Income Statement analysis. We learned that cash is king and it pays to analyze a company on its cash flows, not it’s income statement. But I left the last essay on somewhat of a cliff hanger.
I ended the essay with two key frameworks for thinking about the cash impact of revenue growth:
-
- Operating Cushion
- Core Operating Growth Profile
Those two frameworks deserve their own essay, not simply latched on like a last-minute soup garnish. Enter: Cash Flow: It’s All That Matters (Pt. 2).
We’ll dive deep into these two ideas and walk-through real-life examples. Once finished, you’ll learn how to truly analyze a company’s growth from a cash-flow perspective. You’ll have hard data telling you whether $1 of revenue growth actually improves the economics of the business.
Like I said in the last essay: it’s like the red-pill for fundamental analysis.
After doing a few real-life examples using this method, you won’t analyze a company without it.
We’re using Cash Flow Analysis: Modified UCA Cash Flow Format to breakdown operating cushion and core operating growth profile.
Operating Cushion: What It Is & Why It Matters
Operating Cushion is the percentage difference between your Gross Margin % and your SG&A %. In English, it’s the contribution of a $1 increase in revenues to operating profits. Hold working capital constant and Operating Cushion = Core Operating Growth Profile.
But we know we can’t hold working capital constant for most businesses.
Let’s break this down into two parts:
-
- Operating Cushion
- Cash Needs (i.e., working capital requirements)
Operating cushion orbits around two ideas:
-
- The higher the operating cushion, the more cash a company will generate as it grows top-line revenue
- The lower the operating cushion, the less cash a company will generate as it grows top-line revenue
There’s two ways we can raise our operating cushion. We can either 1) increase gross margin through raising prices or lowering COGS (cost of goods sold) or 2) reduce SG&A by reducing headcount, increasing operational efficiency and streamlining backend processes.
Why (& When) Operating Cushion Matters
Operating cushion matters because without it we wouldn’t know if company growth adds or subtracts value. In other words, operating cushion tells us if top-line growth increases cash or drains cash.
This matters when we go to value companies based on top-line revenue growth over a 3-5 year period. How much worth can we place on top-line growth if the company’s business model consumes cash as it grows? Not much!
That said, it’s important to understand where a specific company is in its growth lifecycle. Early-stage growth companies will devour cash as they take market share and expand manufacturing, capacity and employees. Those companies will show severely negative operating cushions.
On the other end, we expect declining/mature companies to reduce operating cushion as their competitive advantage fads. Replaced by disruptors and innovators.
What matters is the trend and if the trend is following a logical path. High-growth companies should (over time) increase operating cushion from negative to positive. If not, they’ll fail and go bankrupt (unless you’re TSLA).
At the end of the day, we want to invest in companies that generate cash as they grow and avoid companies that consume cash as they grow.
Now onto some examples of operating cushion in action.
Operating Cushion Example #1: Apple, Inc. (AAPL)
Let’s use Apple, Inc. (AAPL) as our first example of operating cushion analysis. We’re using TIKR.com for our financial data. We’ll also break each example into steps so you can follow at home.
Step 1: Find Gross Margin % and SG&A %
TIKR simplifies this process and displays GM% and SG&A % right next to each other:
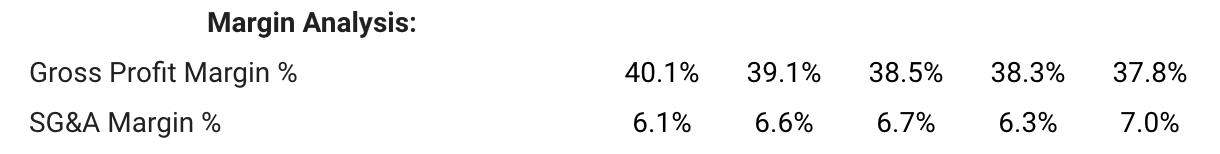
Step 2: Subtract GM % from SG&A %
Next we subtract GM % from SG&A % to arrive at Operating Cushion (easier if you do this in Excel):
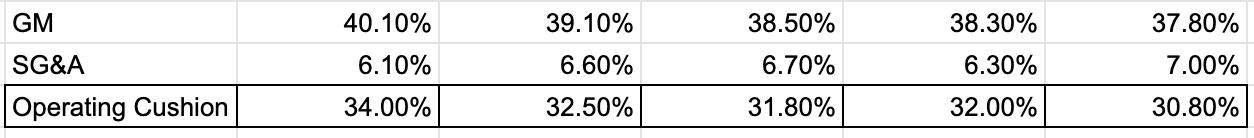
Step 3: Analyze Operating Cushion Data
AAPL’s generating less operating profits from a $1 increase in revenues today than they were five years ago. This makes sense as the company grows and reaches a more mature lifecycle stage.
But AAPL’s declining operating cushion is due to both rising SG&A and lower gross margin. The double whammy.
Let’s see what another, better operating cushion profile looks like.
Operating Cushion Example #2: Interactive Brokers (IBKR)
IBKR is fresh on my mind as we initiated a position in the company early last week. Collective members were alerted to our entry on 07/07. The stock’s run up nicely since then.
Let’s go through our three steps again.
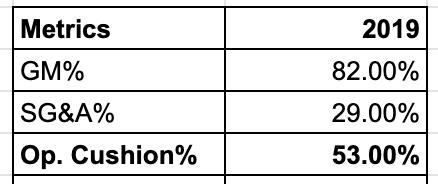
Step 1: Find Gross Margin % and SG&A %
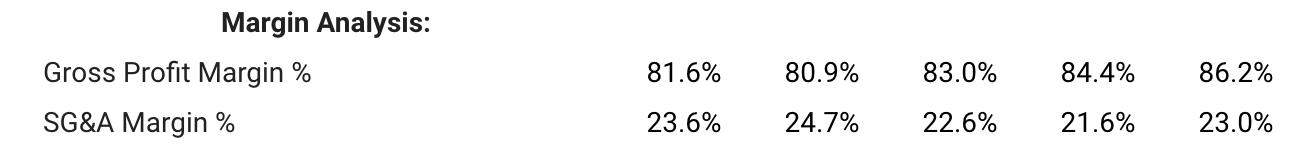
IBKR’s high margins are consistent over the last five years. SG&A remains stagnant around 23%.
Step 2: Subtract GM % from SG&A %
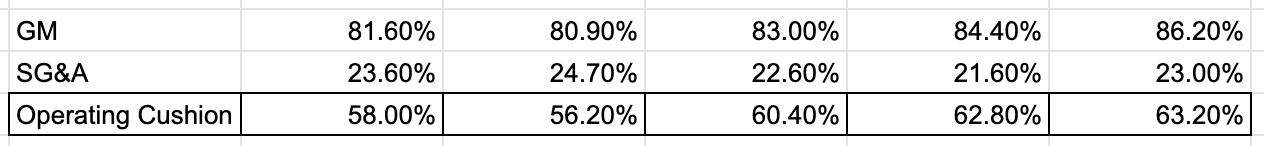
Step 3: Analyze Operating Cushion Data
Unlike AAPL, IBKR’s grown operating cushion over the last five years. A dollar in incremental revenue growth translates to $0.63 in operating profit in 2019. Compare that to $0.58 in 2015.
How was the company able to accomplish its growth? Rising gross margins. Notice IBKR’s SG&A % barely fluctuated over the last five years (decreasing 60bps). Meanwhile, the company’s gross margin grew 500bps!
Operating cushion informs us about the cash-generating ability of a business before any working capital requirements. If we don’t analyze working capital requirements, we’ll overstate the amount of true cash flow a business can generate.
Let’s dive in.
Working Capital: How Much Cash Do We Need To Grow?
We can’t forget about working capital requirements. Remember, it takes cash to grow top-line revenues. Some businesses require more cash than others.
Working capital requirements affect cash in two ways:
-
- The higher the working capital requirements, the less cash a company will generate as it grows
- The lower the working capital requirements, the more cash a company will generate as it grows
If you don’t take anything else from this essay, take this: we want to invest in companies that don’t need a lot of working capital requirements to grow. Write it down. Stick it in your office. Never forget.
What Goes Into Working Capital?
Working capital is made up of a few components:
-
- Accounts Receivables
- Accounts Payables
- Inventory
Each of the above components represent either a decrease or an increase to a company’s cash flows.
For instance, failure to collect cash from its sales (increasing receivables) would represent a negative effect on cash flow. Why? Because we’re receiving less actual cash from the sales we booked on the income statement.
Accounts payable works in the opposite direction. A higher accounts payable balance means we pay less cash for bills, etc. This means we get to keep our cash today in exchange for paying more in the future.
Finally there’s inventory. Rising inventory levels means a company spent more cash in the current year to make finished products/goods that weren’t sold to customers. Conversely, falling inventory levels means a company’s selling through their finished goods/products faster than they can make them.
That said, not all rising inventory levels are a bad thing. For example, a young company on the verge of signing multiple contracts with big clients may produce a significant amount of product upfront in order to fulfill a larger order.
Also, traditional manufacturing and machine-heavy companies tend to carry more inventory than knowledge-based businesses. It shouldn’t surprise you to see little (if any) inventory in some of the most popular tech-based knowledge companies.
Other (Minor) Working Capital Requirements
There are a couple minor working capital components that you might run into like:
-
- Prepaid expenses
- Deferred revenue
Prepaid expenses are items like insurance. You have the option to pay your car insurance in one lump-sum payment. This would be a prepaid expense. Increases in prepaid expenses consume cash. Decreases in prepaid expenses conserve cash.
Deferred revenue is a fancy way of saying accounts receivables. You find deferred revenues in most SaaS companies. Deferred revenue occurs anytime a company books a sale for a service or product but hasn’t delivered that service or product.
Let’s use software as an example. You book a client for a five-year subscription contract for $1,000/year. As soon as you sign that contract you have $5,000 in deferred revenue on the books. At the end of year one, you recognize $1,000 of that $5,000 in deferred revenue as actual revenue. In turn, your deferred revenue drops from $5K to $4K.
We add deferred revenues to working capital to reflect the inherent gain we’ll receive in cash once we collect payment.
Combining Working Capital & Operating Cushion
Now that we know what goes into working capital, we need to translate it into cash inflows and outflows. We need to see which part of working capital consumes cash or collects cash. We need to understand the drivers of working capital requirements in a business.
Say hello to the Core Operating Growth Profile. This tool allows you to see exactly what’s driving cash consumption and growth.
Again, once you use it, you’ll never do another valuation without it.
Core Operating Growth Profile: A 360° View of A Company’s Cash Flow
We know how to find an operating cushion. We know the components of working capital and their effects on cash inflows and outflows. Now it’s time to combine both segments to create our Core Operating Growth Profile.
Here’s the basic equation (ignore the figures in the picture):
The short-hand version of Core Operating Growth Profile is simply:
Operating Cushion % – Working Capital %
Let’s learn how to get Working Capital %.
Turning Working Capital Into % of Revenues
Before inputting our figures, we need to turn accounts receivables, inventory and accounts payable into percentages of revenues. Turning our working capital requirements into percentages of revenue allows us to do a few things:
-
- Accounts receivable % represents the % of every revenue dollar left uncollected from revenue
- Accounts payable % represents the % of every revenue dollar financed by vendors (i.e., paying on credit)
- Inventory % represents the % of every revenue dollar that must be reserved for inventory
Percentages offer a clearer picture on how much we extract (or consume) in working capital from each dollar of revenue gained.
We subtract AR % and Inventory % because those are (normally) cash extractors. We add AP % because we’re deferring payment to our vendors, thereby keeping cash.
Okay. Now we know how to calculate Working Capital %. Let’s put these two equations together and find our Core Operating Growth Profile.
We’ll use AAPL and FB for step-by-step instructions.
Core Operating Growth Profile Example #1: Apple, Inc. (AAPL)
I know. We already know how to do the first step. But repetition is key if we want to master this habit. We’re trying to teach our brain a new way of analyzing a company.
Step 1: Calculate Operating Cushion (2019)
| Gross Profit Margin % | 37.80% |
| SG&A Margin % | 7.00% |
| Operating Cushion | 30.80% |
Step 2: Convert Working Capital To % of Revenue (2019)
AAPL had $22.9B in AR and $22.8B in “Other Receivables” on the balance sheet. They generated $260B in revenues during the year. That gives us an AR % of -17.6% (note: negative due to cash drain).
The company had $4.16B in inventory on the balance sheet. That gives us -1.60% in Inventory %.
Finally, AP came in at $46.23B in 2019. Divide by our revenue (keep positive!) and we get +17.78%.
Step 3: Add Working Capital Requirements To Get Working Capital %
Here’s what the result looks like:
| Operating Cushion % | 30.80% |
| Less: A/R% | -17.62% |
| Less: Inventory% | -1.60% |
| Plus: A/P% | 17.78% |
| Less: Prepaids% | 0.00% |
| Plus: Deferred Revenue% | 0 |
| Working Capital % | -1.43% |
This means AAPL spends $0.0143 in working capital for every $1 increase in revenue. That’s not bad!
Step 4: Add Working Capital % To Operating Cushion
| Gross Profit Margin % | 37.80% |
| SG&A Margin % | 7.00% |
| Operating Cushion % | 30.80% |
| Less: A/R% | -17.62% |
| Less: Inventory% | -1.60% |
| Plus: A/P% | 17.78% |
| Less: Prepaids% | 0.00% |
| Plus: Deferred Revenue% | 0 |
| Working Capital % | -1.43% |
| Core Op. Growth Profile % | 29.37% |
The final result: 29.37%. This means AAPL generates $0.29 in core operating cash flow (free cash flow) for every $1 increase in revenue. That’s fantastic. If AAPL can maintain that Core Operating Growth Profile, the company should do everything it can to increase revenues. Each dollar translates into nearly $0.30 in free cash flow.
Let’s see what the Core Operating Growth Profile looks like for IBKR.
Core Operating Growth Profile Example #2: Facebook, Inc. (FB)
FB’s known as a cash-generating machine. But what does that look like under the hood? Where are the real drivers of core operating cash flow?
Let’s find out.
Step 1: Calculate Operating Cushion (2019)
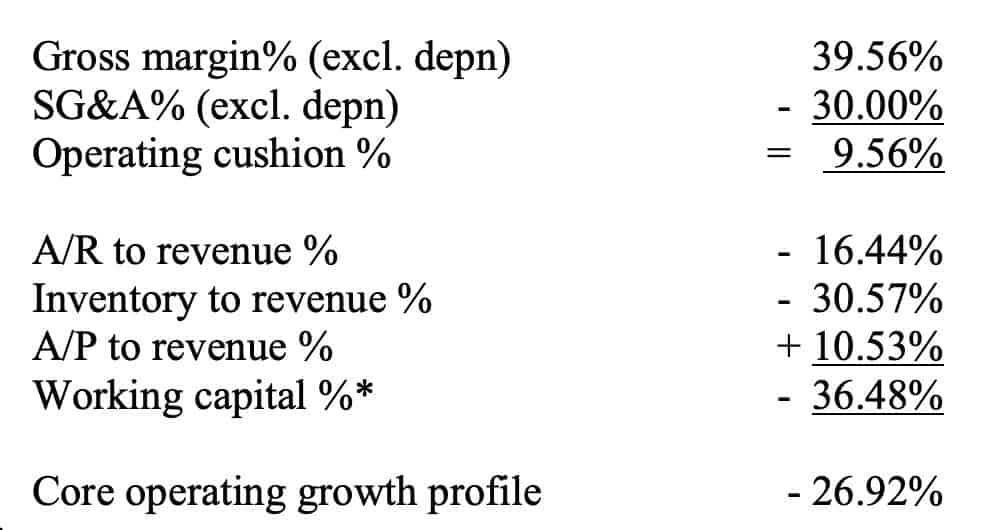
Step 2: Convert Working Capital To % of Revenue (2019)
FB had $9.52B in Accounts Receivables against $70.7B in revenue. That gets us -13.47%. The company doesn’t carry inventory on their balance sheet, so we keep that at 0%. Next is accounts payable. FB had $1.36B in AP against $70.7B in revenue, giving us 1.92%.
Finally we calculate Prepaid Expenses. FB spent $1.84B in prepaid expenses against $70.7B in revenues. That gives us 2.60%.
Step 3: Add Working Capital Requirements To Get Working Capital %
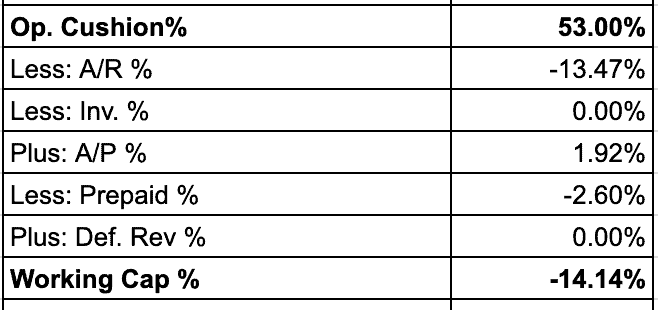
This means FB has roughly 14% of its revenue tied up in working capital requirements. That’s not bad.
Step 4: Add Working Capital % To Operating Cushion
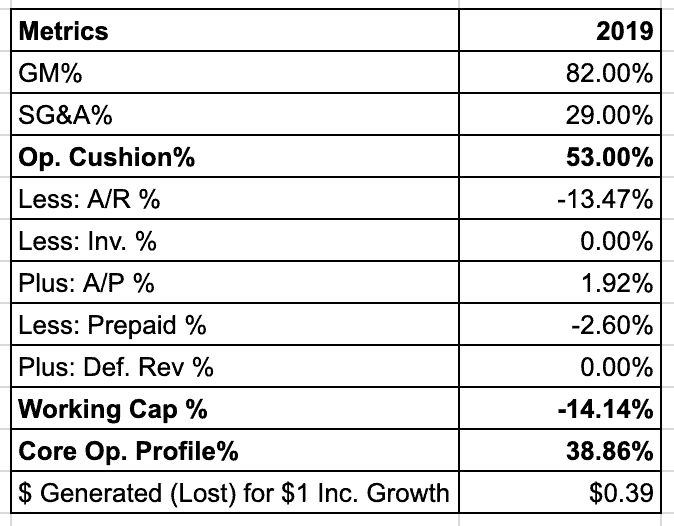
Now we can see the true cash-generating power of FB’s business model. They generate $0.39 for every $1 of incremental revenue growth. That’s fantastic.
Closing Thoughts
Operating Cushion and Core Operating Growth Profile are two of the most powerful tools in your investment toolkit.
Analyzing businesses through these two frameworks allows you to answer each of these questions:
-
- How easily does a company generate operating cash flow? (Operating Cushion)
- Does the company need to spend a lot of cash to grow revenues? (Working Capital %)
- How much free cash flow does a company generate for each additional dollar of revenue growth? (Core Operating Growth Profile)
Get back to the basics of fundamental investment analysis: Follow the cash.
_______________________________________________