Years of experience eventually teach you that your main battle, always, is with yourself — your propensity for errors, for rationalizing marginal hands into good hands, lack of concentration, misreading other players, emotional eruptions, impatience, and so on. Your opponents are merely dim outlines that come and go. Few of them ever reach the exalted heights of damage that you can inflict on yourself.
~ Zen and the Art of Poker
Good morning!
In this week’s Dirty Dozen [CHART PACK] we look at the numbers going into a new earnings season, talk about breadth thrusts and crummy sentiment, and finish with an engine maker that’s 80%+ off its highs but with a good deal of liquidity to survive. Let’s dive in…
***click charts to enlarge***
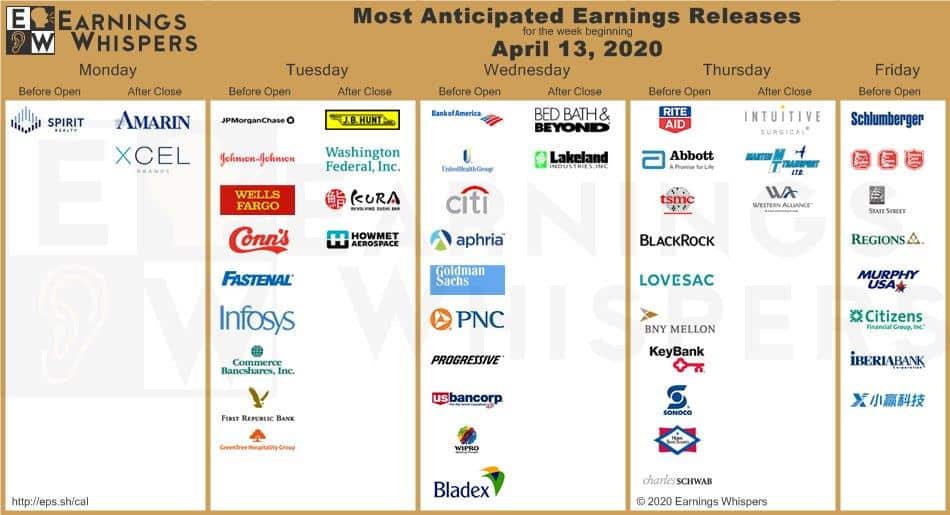
- Q1 earnings season kicks off over the next two weeks. Here’s the most anticipated earnings releases from Earnings Whispers. A number of the big banks are reporting this week. I don’t so much care about the numbers as much as I care about how the market reacts to those numbers.
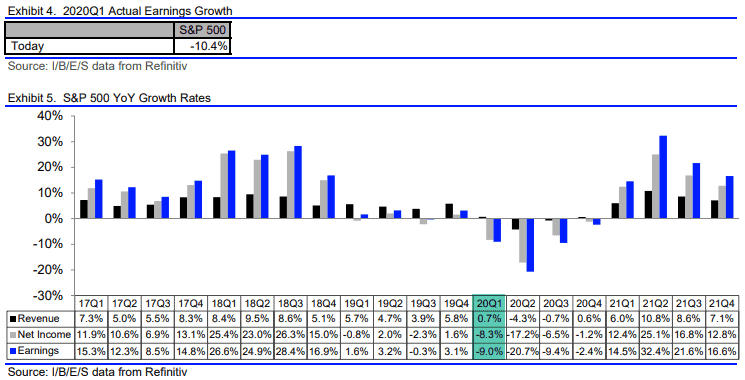
- Consensus estimates expect S&P 500 revenue growth of 0.7% and EPS growth of -9%. Excluding the energy sector, the growth rate improves to -7.5%. For the last year or so the play has been to fade the overly pessimistic earnings estimates. I have no clue if that’s the play this time around.
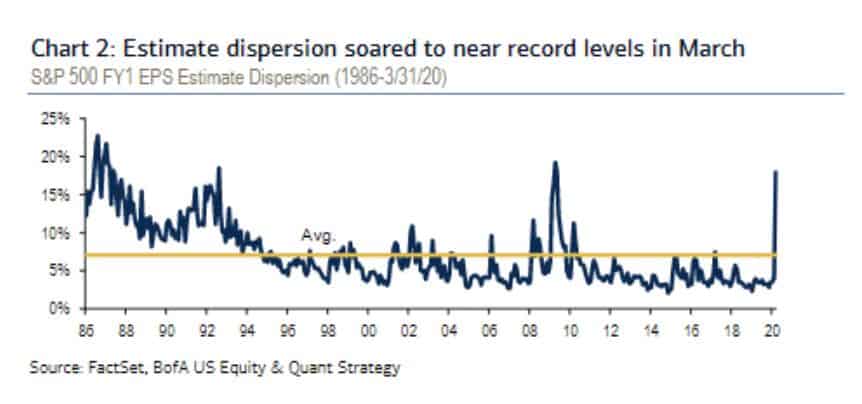
- BofA recently pointed out that estimate dispersion is near record levels. Here’s a clip from Bloomberg on what that means, “A measure known as estimate dispersion — how much the highest and lowest per-share prediction varies on the average stock— has soared to near-record levels… making judging company prospects a huge challenge… It’s a throwback to Wall Street’s wilder days, a chance for money managers to rise above each other and the passive investing onslaught that has been their bane for more than a decade.”
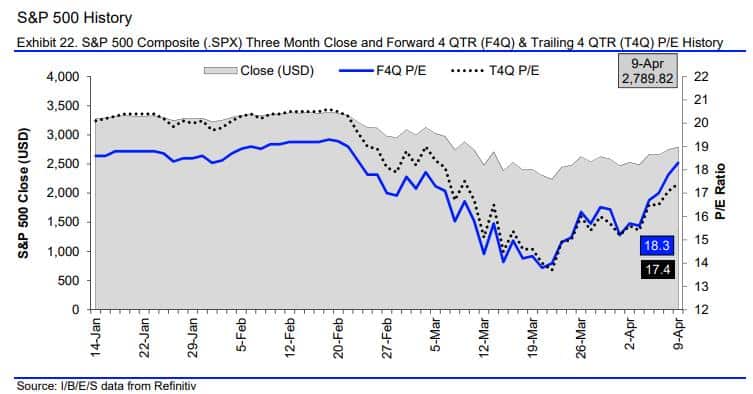
- I’d like to point out that after the latest 20%+ bounce in the market and with next year estimates coming down, the market is back to trading at 18.3x next year’s earnings. Not far from its cycle high of 19x. Maybe a tad rich?
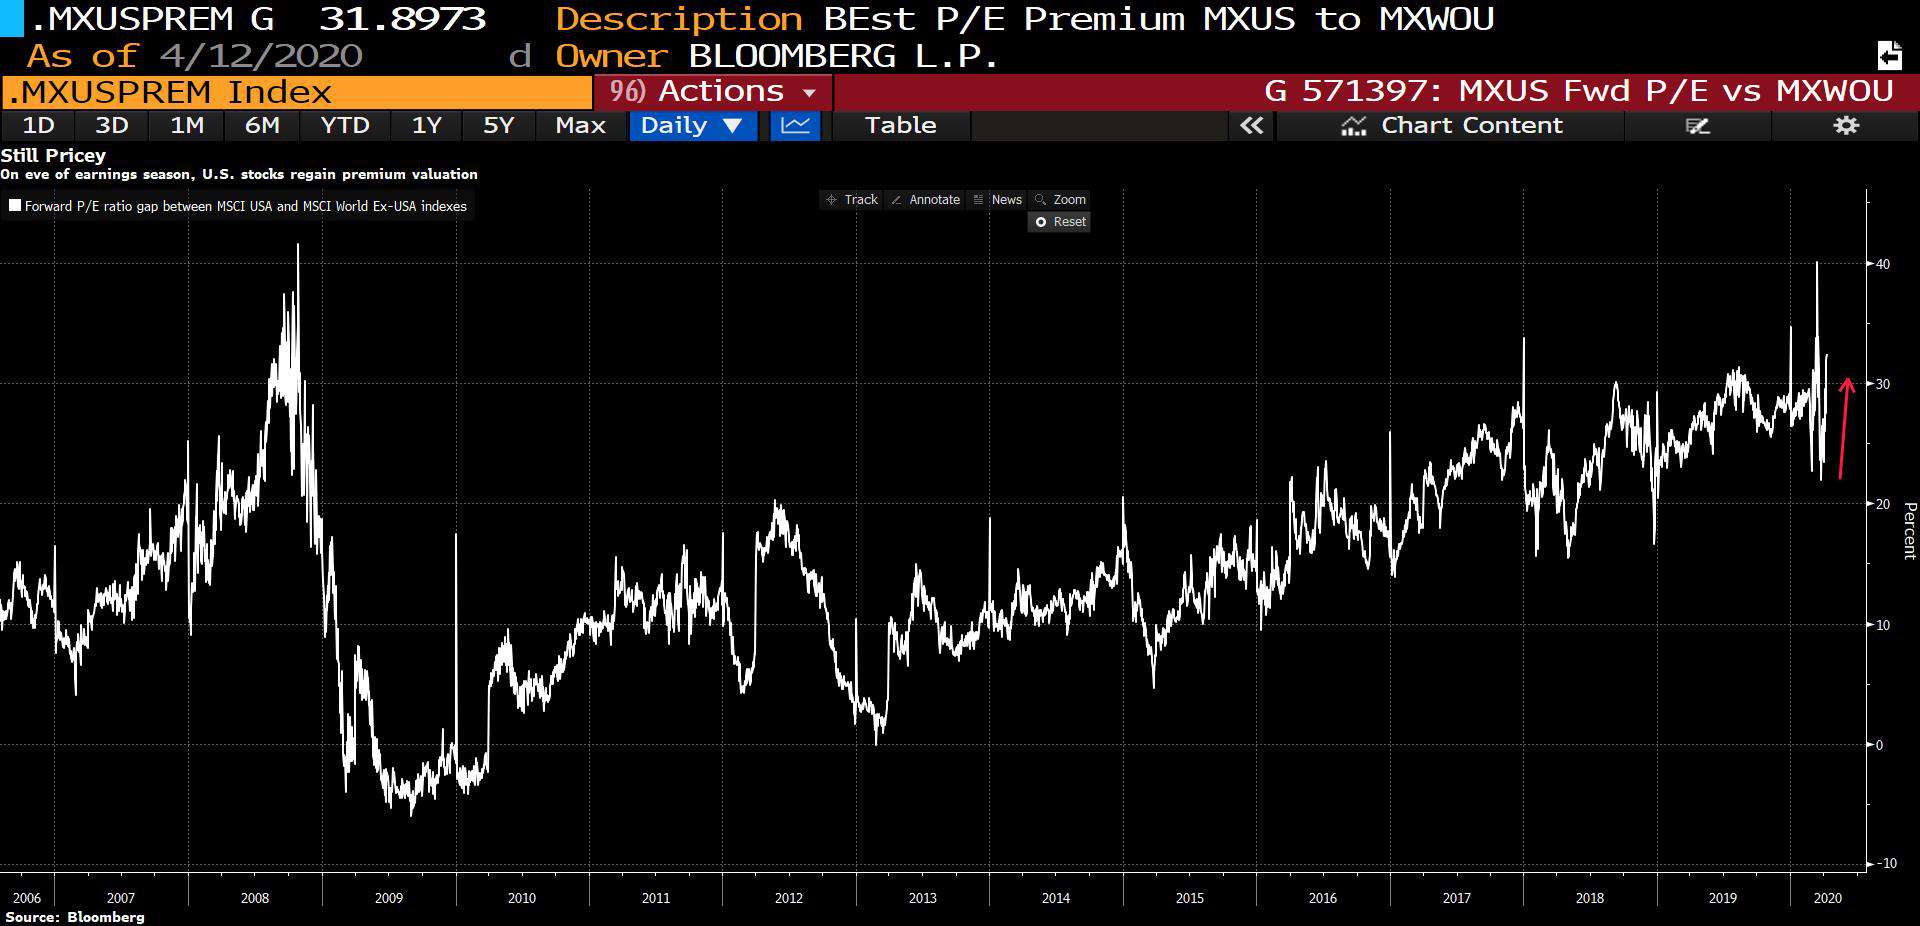
- Not only is the SPX back to trading at rich valuations but it’s also trading at a premium relative to its global peers. The SPX / World ex. US forward PE ratio is also back near cycle highs. It’s anybody’s guess how much longer this preference for US assets will last but once the premium cycle turns, the dollar will follow with it.
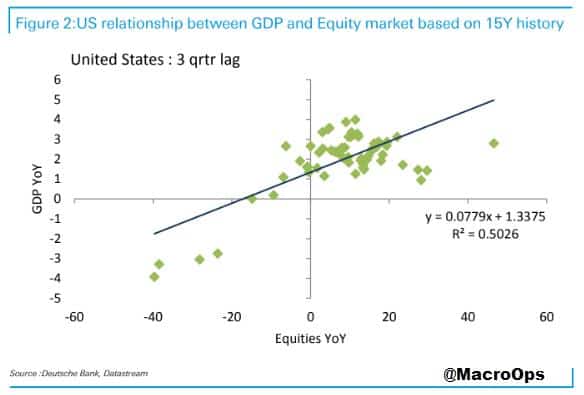
- I often write that the market isn’t the economy. What matters is how much money is being created and available (demand) relative to supply (total market cap). But… over the long run, for the supply of credit (which makes up the majority of money) to expand you have to have a growing economy (people buying and selling stuff).
This chart from DB shows the relationship between markets and GDP growth. According to the German Bank, based on simple linear regressions, “current US equity prices are consistent with US GDP growth of +0.7% YoY in Q3… more in keeping with a short-lived shallow recession and a quick shaped recovery, than a deep sustained weakness of historic proportion.”
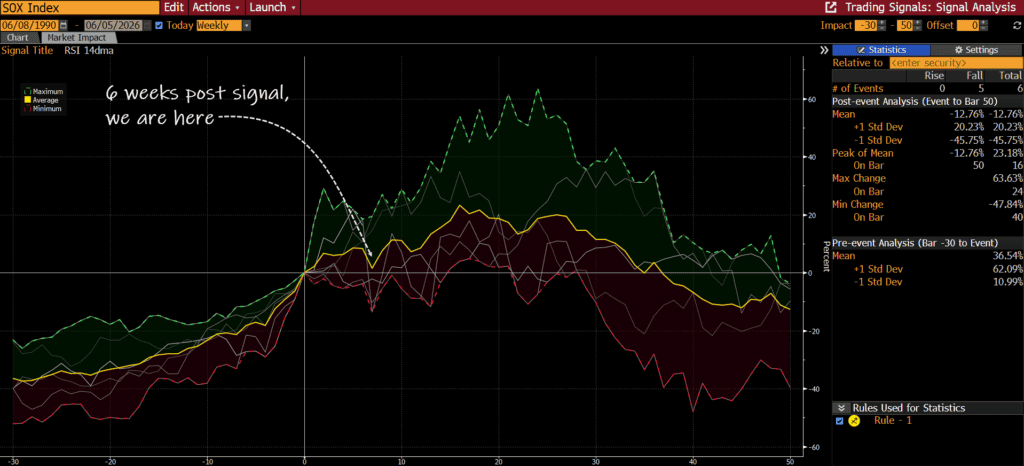
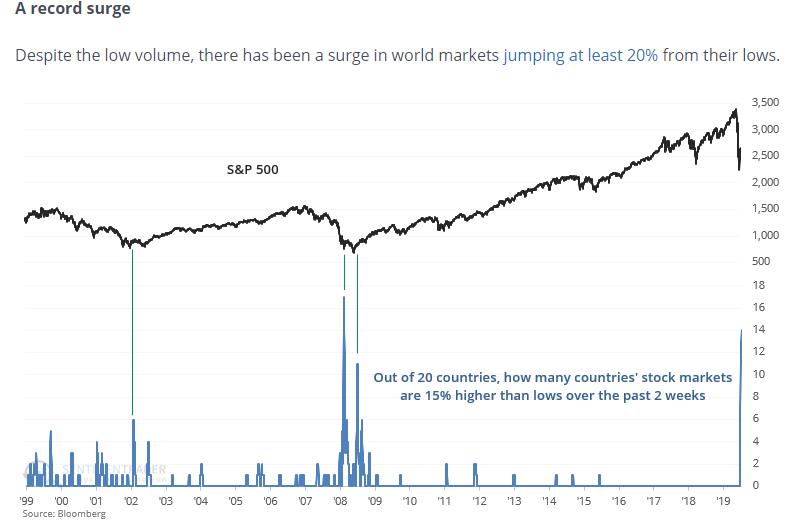
- It’s all quite confusing… That’s why I say to trade the market in front of you, shorten your timeframe, and don’t push your risk. With that said, the market bounce that I said was coming two weeks ago, continues to get positive confirmation from breadth thrusts. SentimenTrader pointed out in a recent note (link here) that there’s been a surge in world markets jumping at least 20% from their lows.
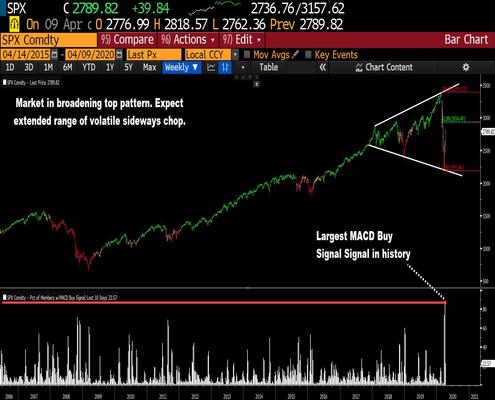
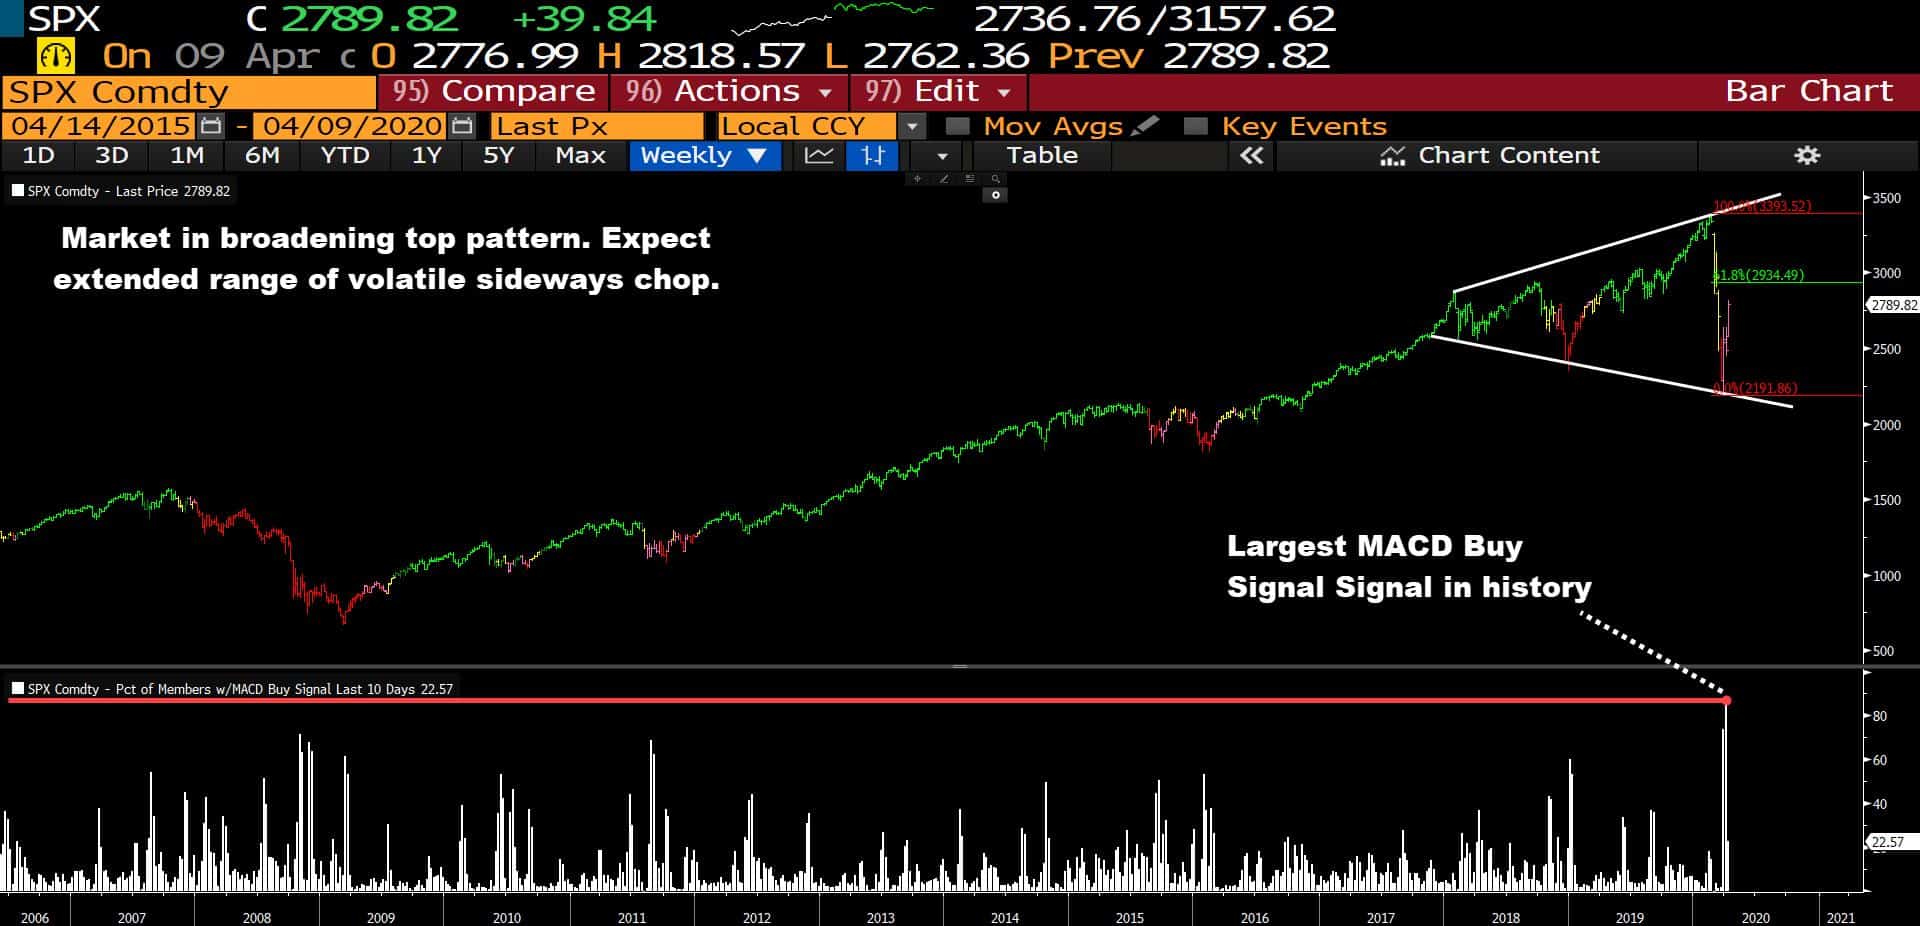
- We saw the largest spike in MACD Buy Signals in the history of the index last week (chart below is a weekly). My case is still for a continued chopping volatile range in the index, for the next couple of months.
- Also from that SentimenTrader report, Combined Hedger Positions are near cycle highs, meaning specs are crowded short. This should serve as further fuel for the bounce higher.

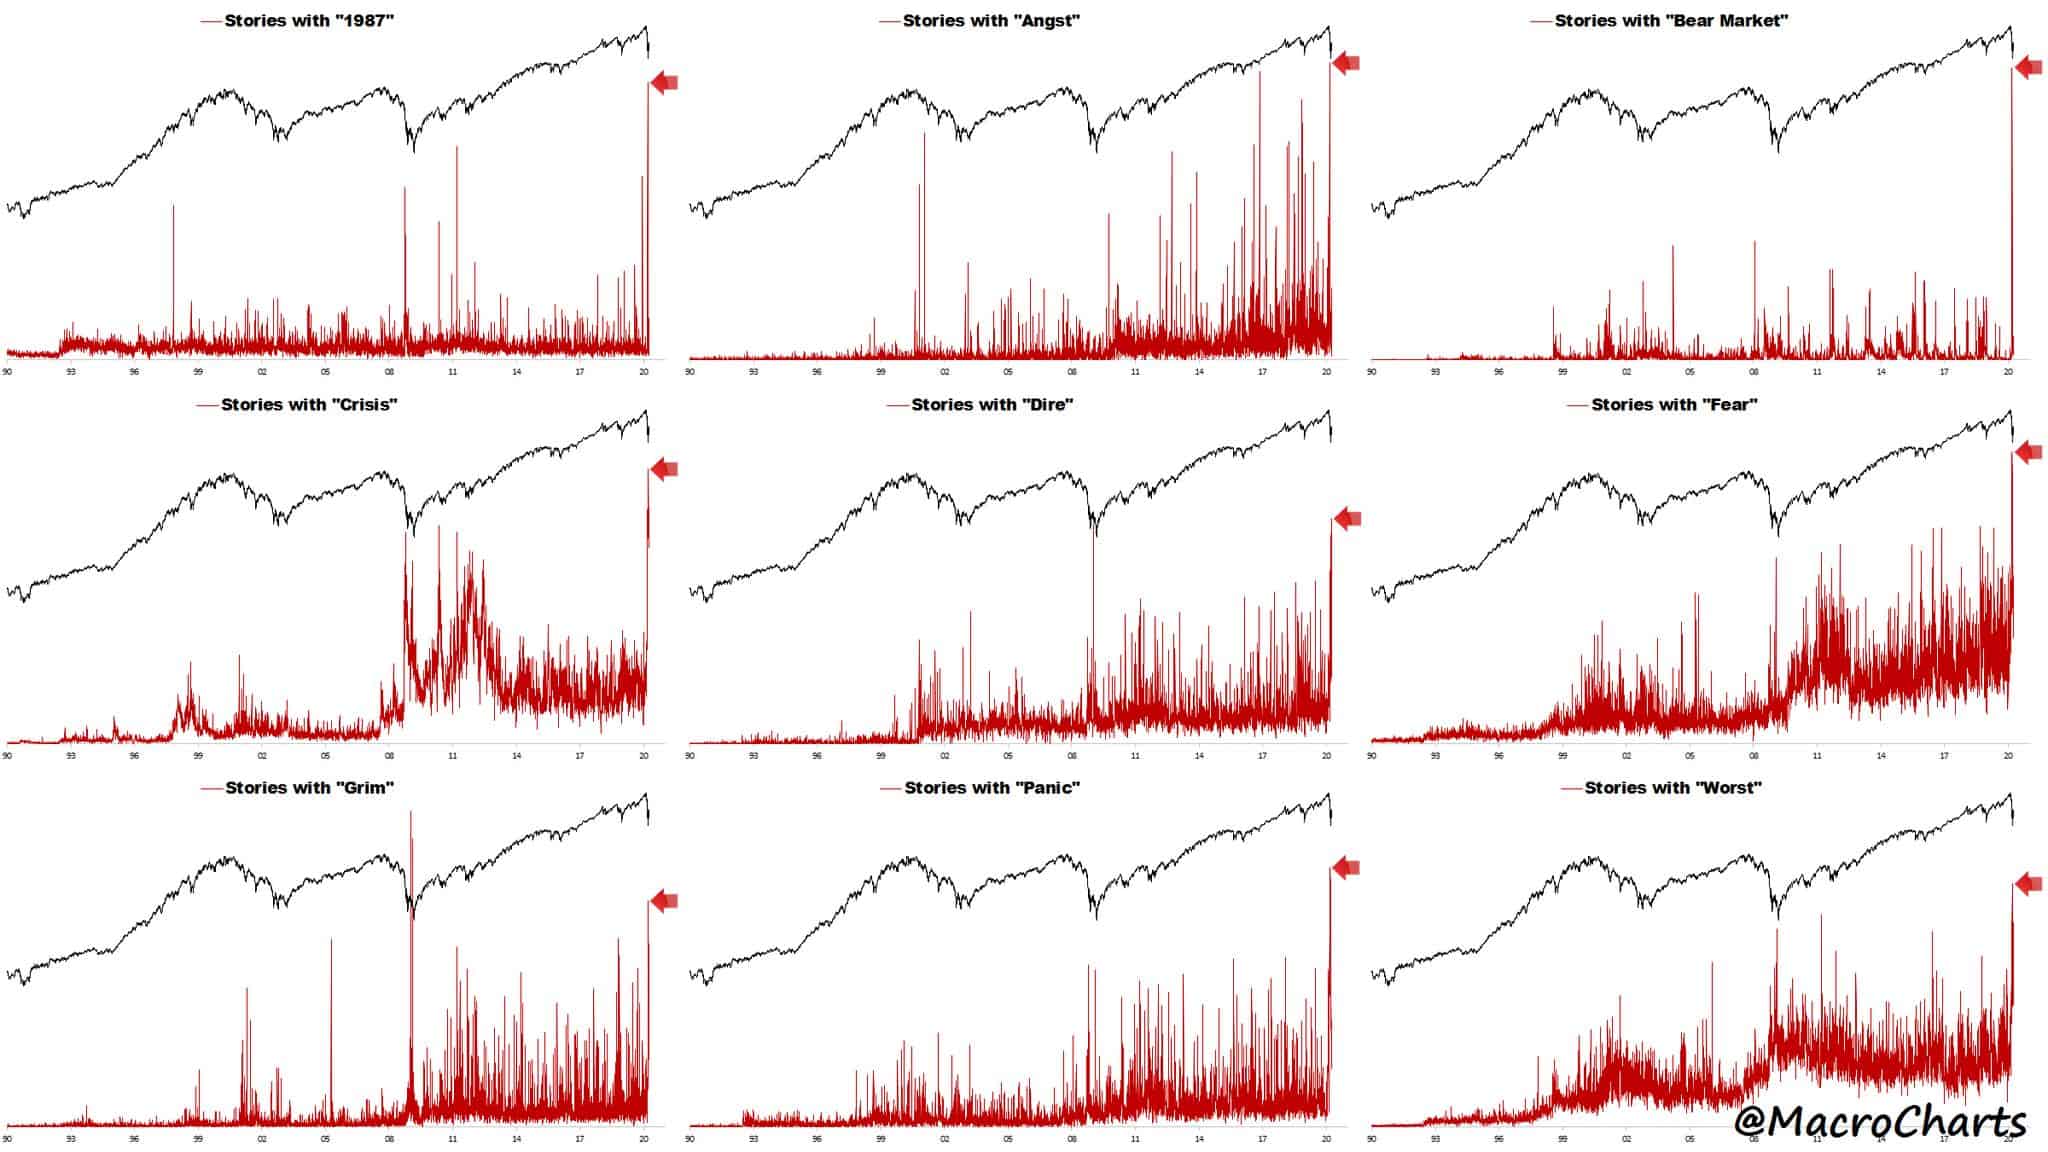
- Last week I pointed out the problem with the short-term bear thesis (summary: too popular). @MacroCharts shared this great graph showing the spike in bearish news pieces over the last two weeks. Widespread sentiment like that nearly always marks a bottom, at least a temporary one.
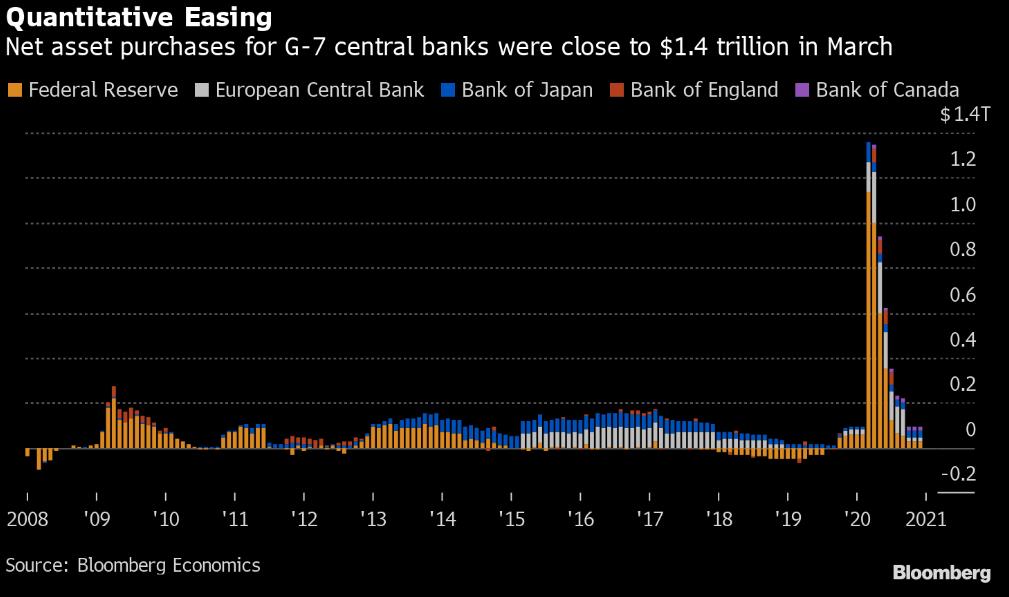
- We’re in a new world with new rules and no-one quite knows what those rules are yet. The Fed is now buying junk bonds — are equities next? — and pumping a record amount of liquidity into the system. Net purchases for G-7 central banks were close to $1.4 trillion in March. That’s 5x the previous peak in April of 09’.
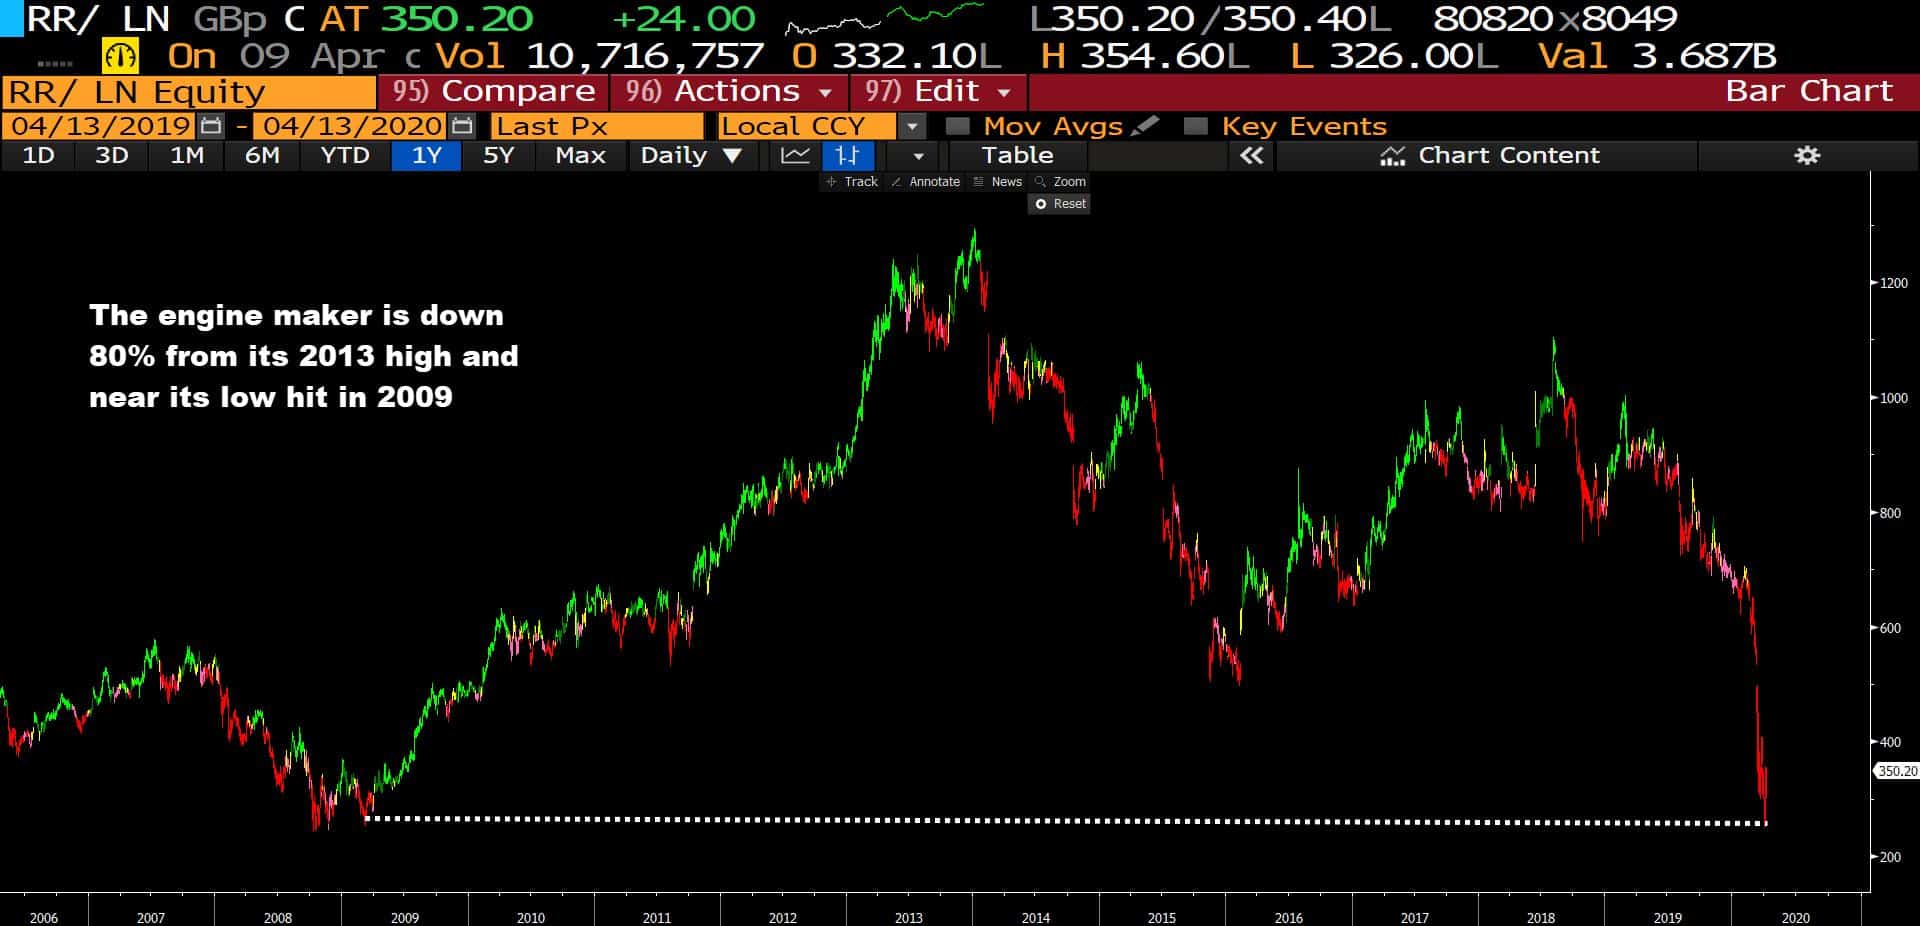
- My watch list for stocks to buy has become incredibly long. One of the stocks at the top of this list is the engine maker Rolls Royce (RR.LN). The stock is down 80% from its 2013 peak and plumbing the lows marked at the bottom of the GFC, when the company’s revenues were less than half what they are now.
The reasons for the bearishness are obvious: Rolls Royce gets paid by airlines based on how many hours they fly. The company operates a kind of “razor blade” model. It sells its engines at cost and then makes high margined dollars servicing those engines over the course of their lifetime.
The company recently suspended its dividend for the first time since 1987 in order to shore up its finances. The market is worried about its liquidity but those fears are overblown. The company has roughly 6.7 billion pounds in liquid assets to help see it through the crisis. It’s also about to start a major FCF generating cycle as increased CAPEX costs roll-off from its Trent fan-blade problems. So once this virus slows down and people return to the skies, RR should be well-positioned for a strong run.
Stay safe out there and keep your head on a swivel!