***The following is an excerpt from a report sent out to Collective members Tuesday morning***
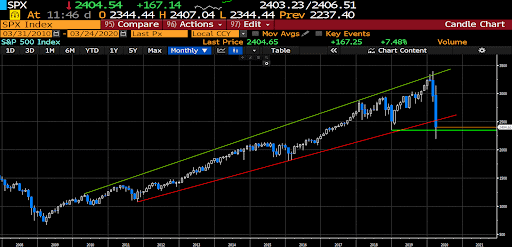
We have 5 trading days left in the month of March. As I pointed out in the Brief over the weekend, the bulls are trying to close the month above the 2018 lows (roughly 2,350 on the SPX) and reclaim the bull market trendline (2,350) if possible. If they succeed it would lead to a sizable tail on the monthly candle and raise the odds that we see a couple of weeks-to-months of sideways to up action in the US indices.
click on charts to enlarge
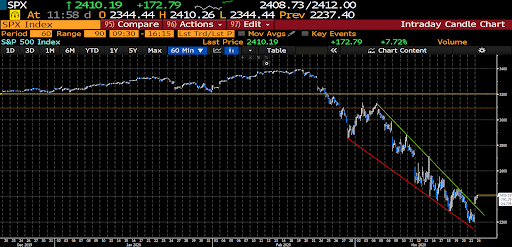
A 60 min chart shows the SPX has been in a month-long sell climax forming a sharp descending triangle. These setups often lead to sharp and powerful retracements higher.
Extremes have been reached across the board in technical, sentiment, and positioning data.
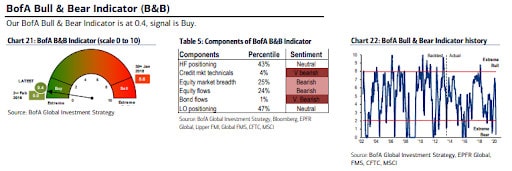
BofA’s Bull & Bear Indicator recently triggered a strong buy signal.
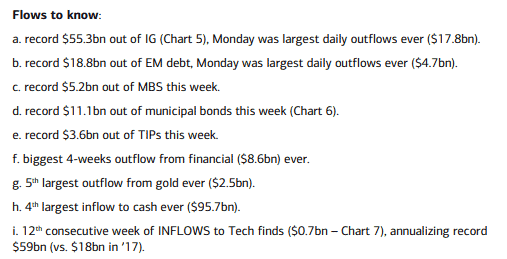
Their Flow data show a number of extremes were hit last week, indicating a potential short-term selling exhaustion event.
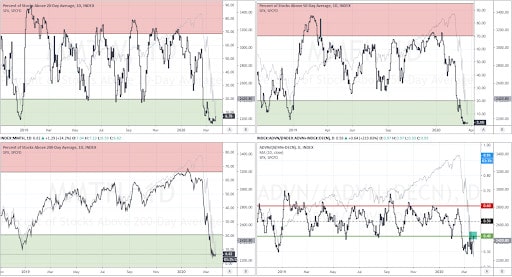
Indicators of market breadth are hooking up from near-record oversold levels. Our Zweig Breadth Thrust Indicator (bottom right) is triggering its first buy signal in over 45+ days.
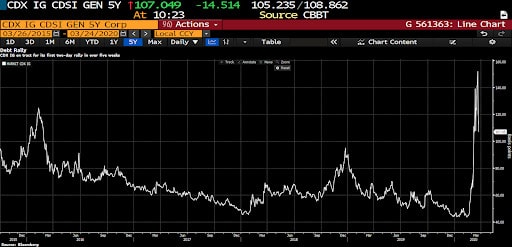
Credit markets are confirming the bullish action with Markit’s CDX IG index on track for its first multi-day rally in 5+ weeks (chart via Bloomberg).
There are two potential catalysts to drive an extended bear market rally here (1) is the likelihood the US senate soon passes a major fiscal stimulus bill and (2) Italy is finally seeing a consecutive decline in new daily cases.

A few quick thoughts before I get into how to play this.
- Odds strongly suggests that we’re in the early innings of a cyclical bear market which will be accompanied by a recession starting within the next quarter.
- Bear markets last an average of 18-months and a second major low (double bottom/complex double bottom) is usually put in 12-months after the first major low.
- The most explosive short-term bull rallies occur in bear markets, as crowded shorts are forced to cover as eager bulls buy thinking the bottom is in.
- Newton’s First Law reigns supreme as momentum begets momentum and sideways chop begets sideways chop. This is fractal and true across all timeframes.
- Bear markets tend to spend more time trading sideways to up than they do going down as the selloffs occur much faster than the up/ranging action.
These are all just odds and probabilities. Today’s buy setup could very well fail, as they have tended to do over the last two weeks.
This market has EXTREME tape bomb and overnight gap risk. Due to the uniqueness of the exogenous shock (virus and government-mandated shutdowns), there are no good historical parallels. Everybody is flying blind. Due to the above, along with the rise in daily volatility, it’s important to size positions small and maintain plenty of dry powder.
Watch the close today. If we’re able to close near the highs, that’ll raise the odds we see further follow-through. We’ll probably need to see at least a few consecutive up days for the bulls to aggressively step back in and drive the rally significantly higher.
Conversely, if the market sells off towards the end of the day — which is exactly what it’s done the last few “Turnaround Tuesdays”. Then we go right back into wait and watch mode.
Here are the trades we’re looking to make if the market holds strong into the close…
***Click here to check out our Collective and see what we’re buying and selling right now***


