
You have to recognize that every “out-front” maneuver is going to be lonely. But if you feel entirely comfortable, then you’re not far enough ahead to do any good. That warm sense of everything going well is usually the body temperature at the center of the herd. Only if you’re far enough ahead to be at risk do you have a chance for large rewards. ~ John Masters, Australian oilman, via the book Hedgehogging
That warm sense of everything going well is usually the body temperature at the center of the herd… That’s a great line. Reminds me of the Ralph Wagner bit about inside and outside zebras.
In yesterday’s piece, we talked about where I think we are in this bear market rally and how the near-term path forward is back to being skewed to the downside.
There are a number of things that make me uncomfortable with the short-term bearish take though and I thought I’d share them. Let me walk you through some charts and show you what I mean.
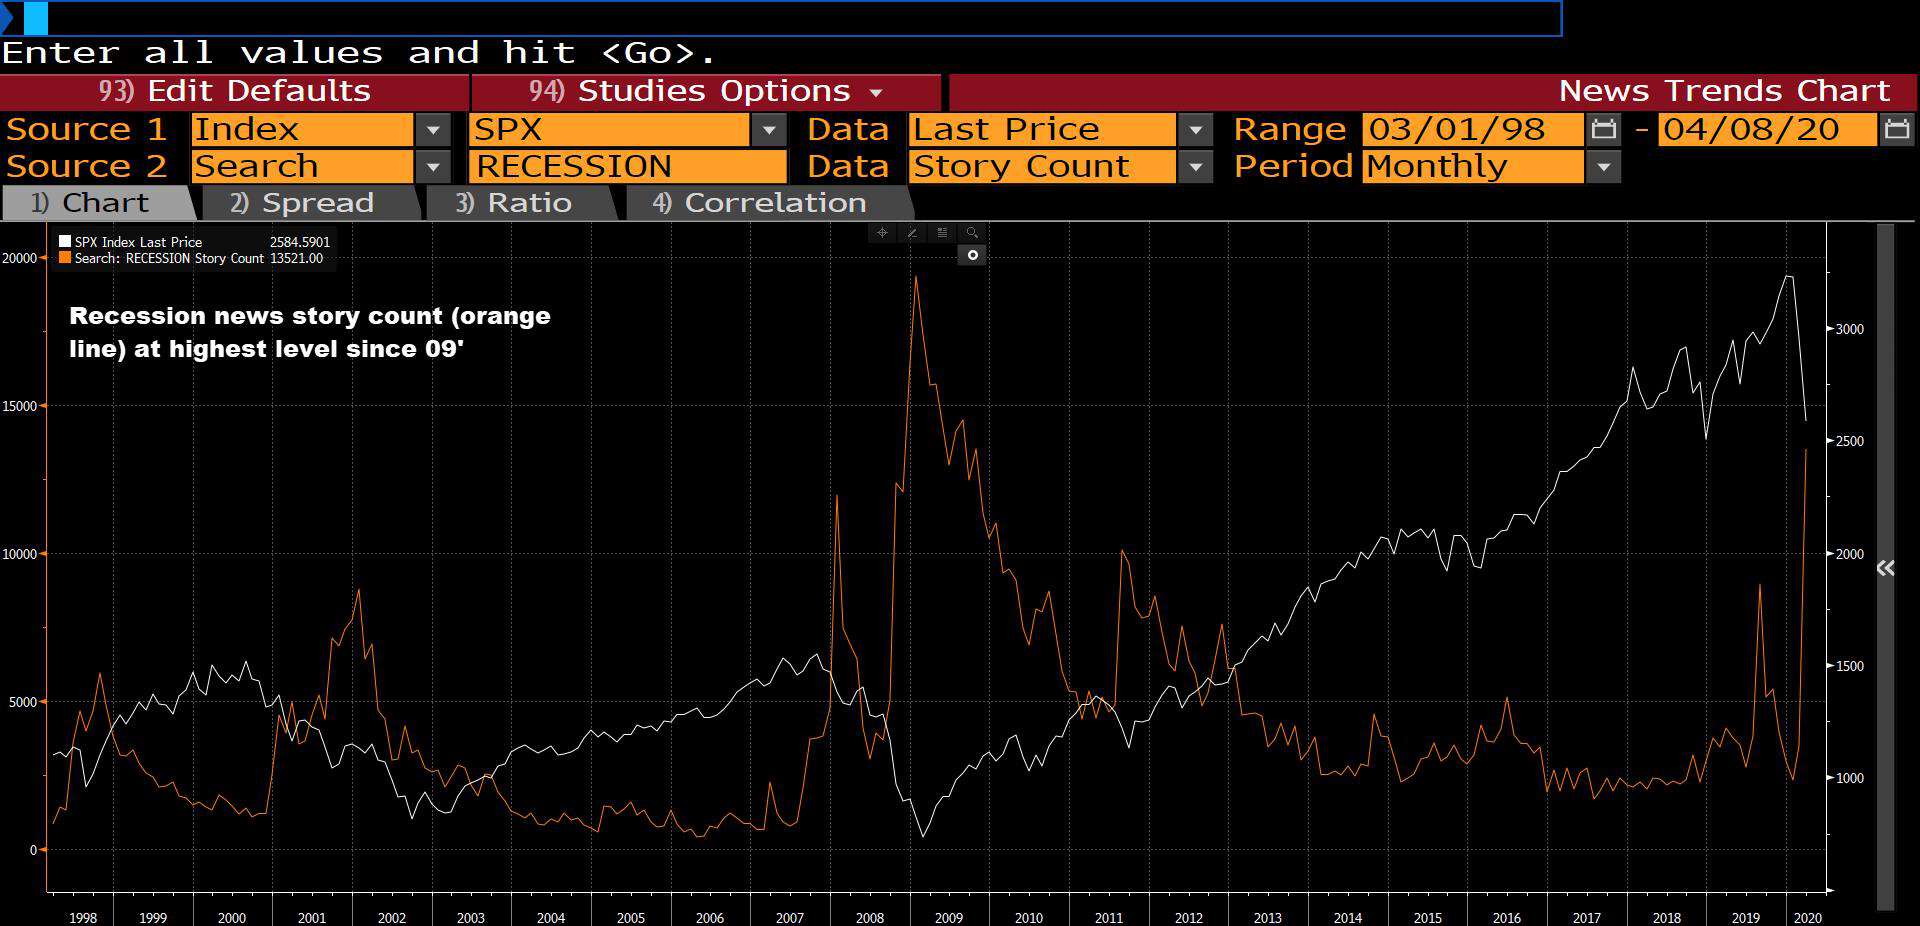
Recession is the consensus take amongst the journos. News stories containing “Recession” have spiked to their highest levels since 09’, right around the time the market bottomed.
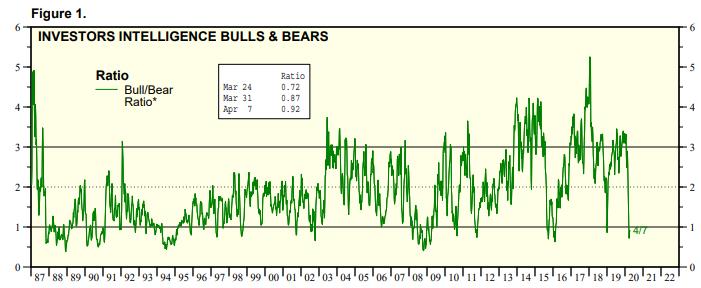
Investors Intelligence Bull & Bears Sentiment gauge hardly moved last week. It’s still signaling extreme bearishness (chart via Yardeni).
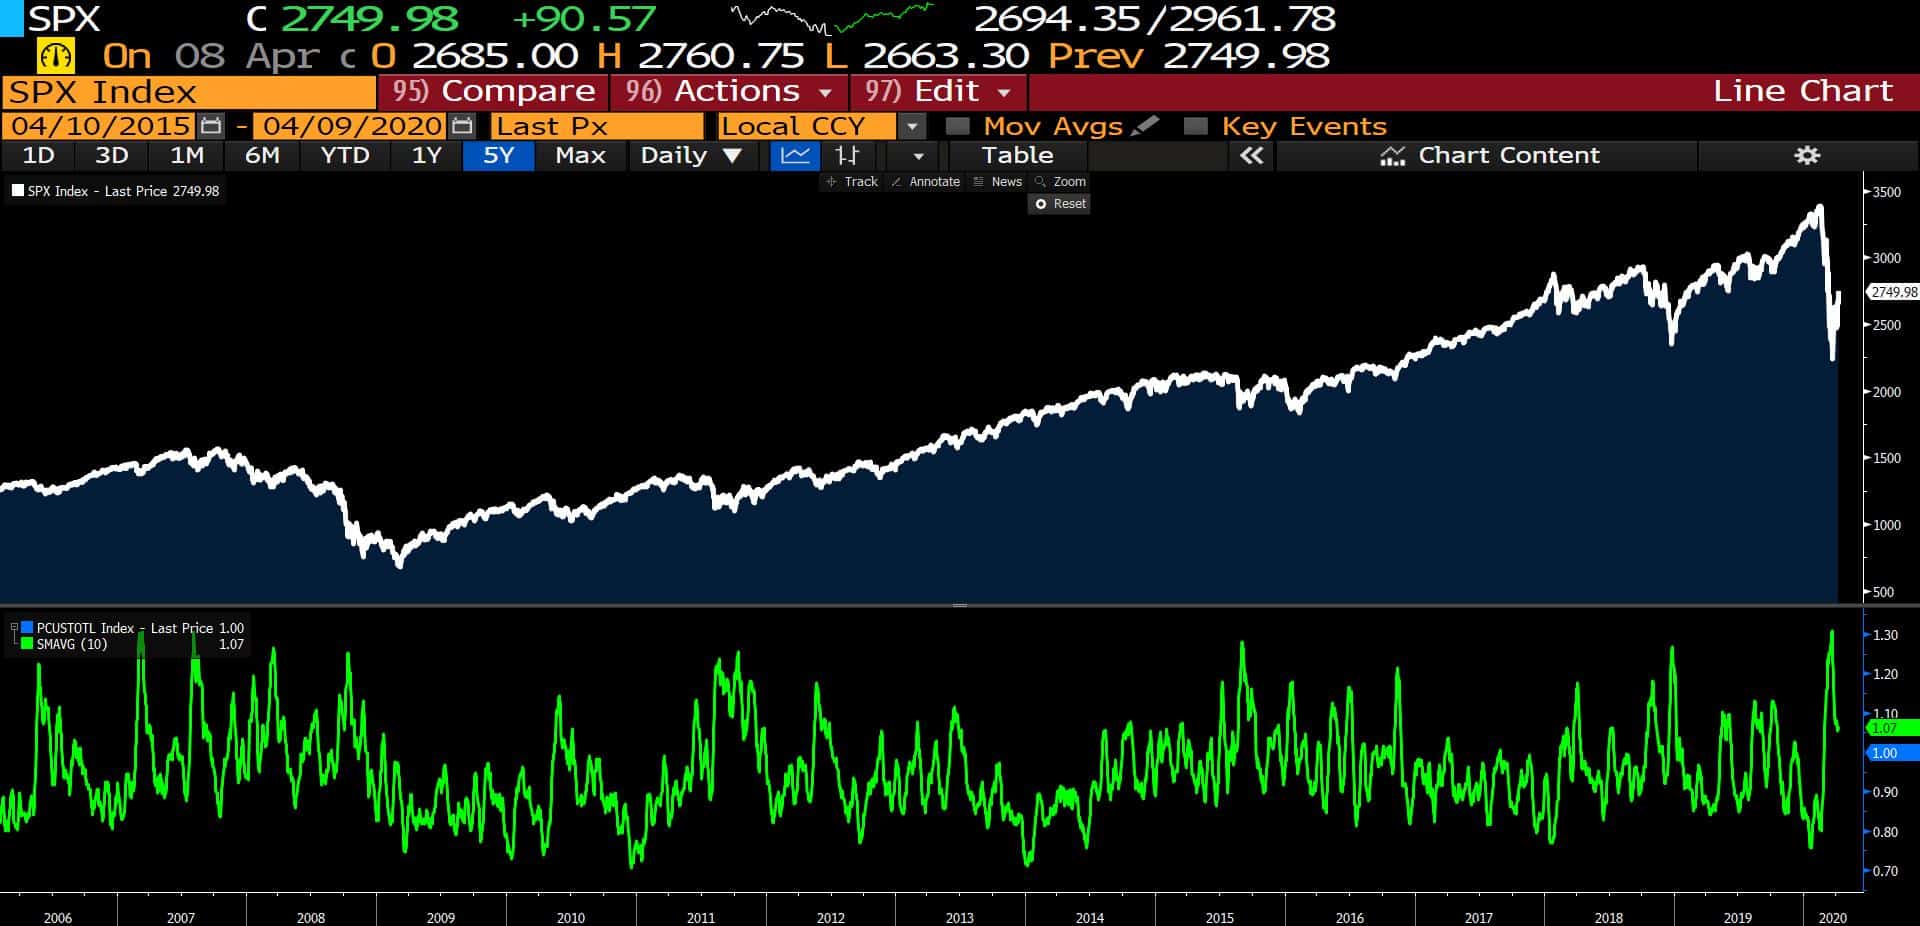
The 10-day moving average of the put/call composite shows that investors are still buying lots of protection. Markets don’t typically sell off hard when everyone is hedged.
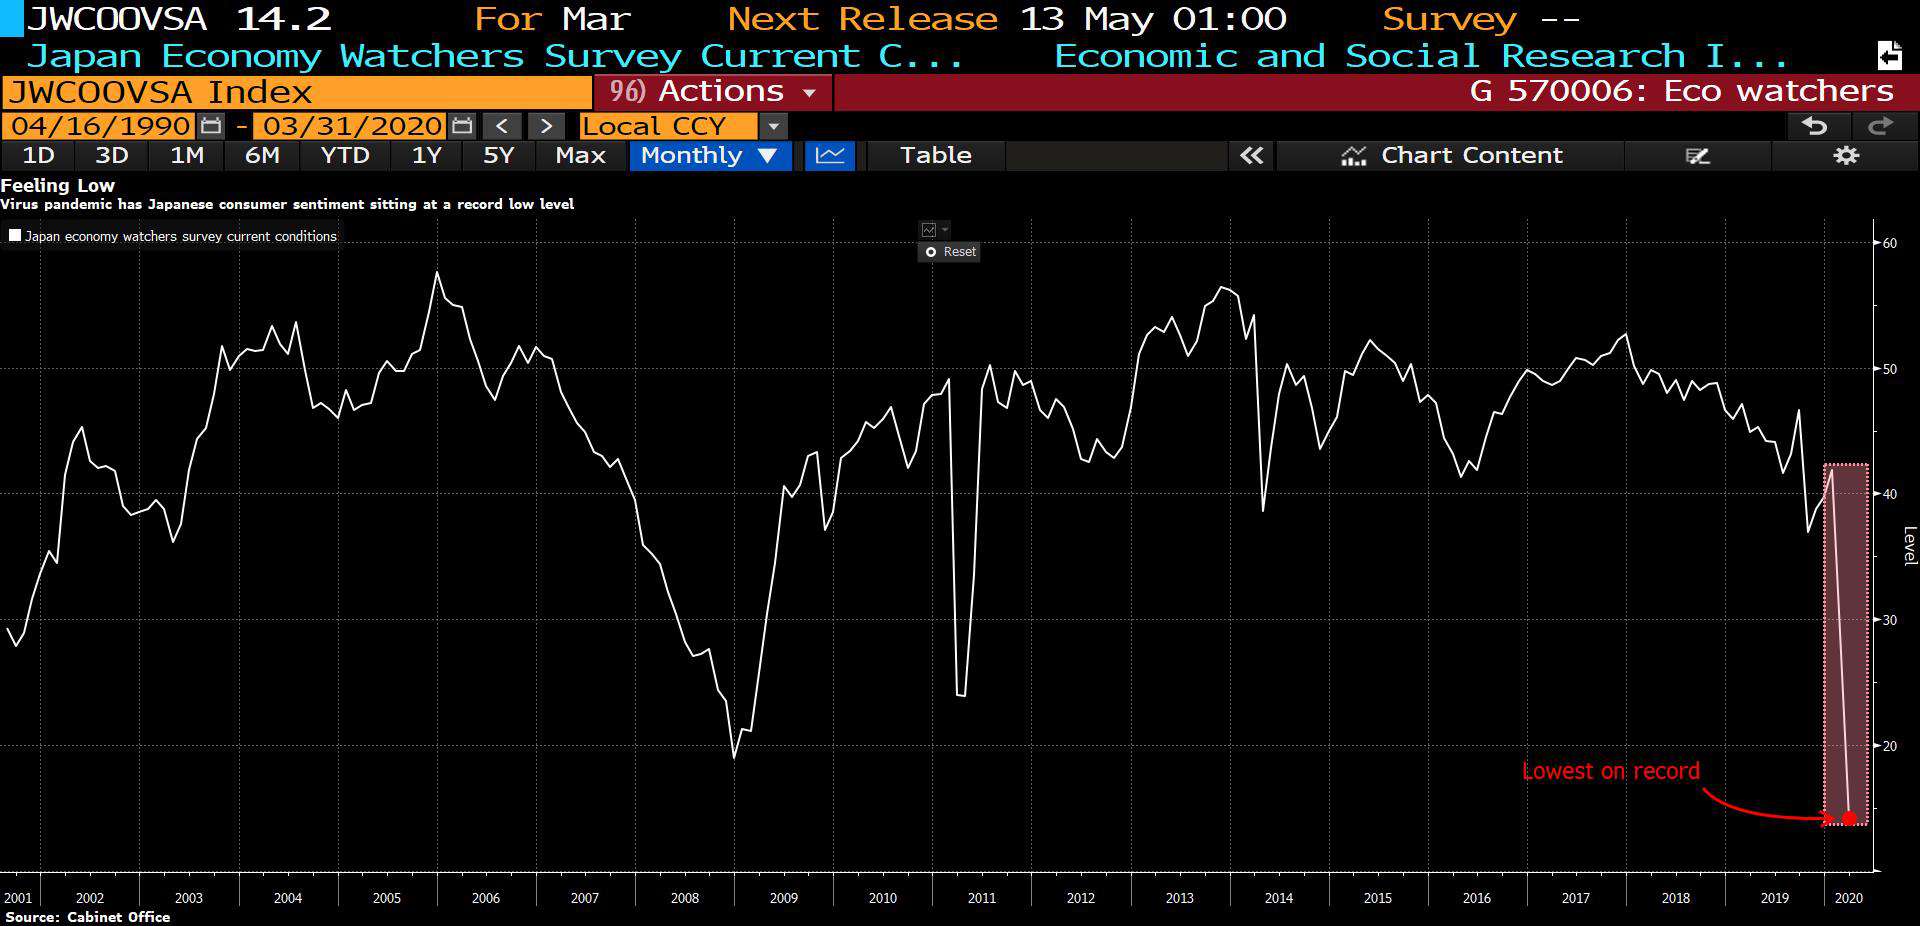
Japanese consumer sentiment hit its lowest level on record this week (chart via Bloomberg).
I look at markets through the framework of a swinging pendulum. Price moves drive sentiment and positioning changes that drive further price moves in a constant positive feedback loop. This goes on until everybody is standing on one side of the boat. Everything that can be priced in, has been. At which point it only takes a marginal piece of contrasting information to swing the pendulum in the other direction.
This is a fractal process. On all timeframes, there are pendulum swings and feedback loops at work.
In early February, investors were tripping over each other to see who could be the most bullish. A little over a month later and we have recession talk dominating the news.
I write all this to say the obvious, that this is a difficult environment. While my fundamental outlook seems to be more bearish than most, it does seem that more sentiment and positioning need to be wrung out in order for the market to make another major advance lower. That means stocks up in the short-term.
Who knows, maybe we just chop sideways from here for the remainder of the year. That wouldn’t surprise me at all. In this environment, anything is possible and we must maintain an open mind.
Pay attention to the herd and watch out for that warm sense…
Oh, and one more thing before I sign off.
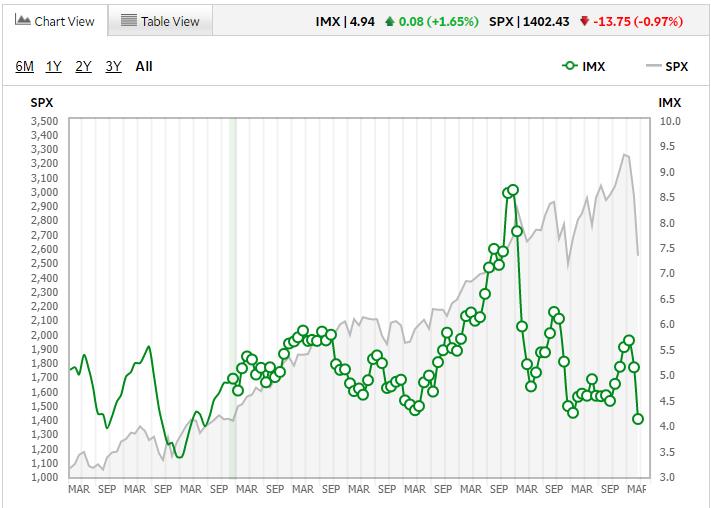
One of the sentiment/positioning data points that I like to check in on each month is TD Ameritrade’s Investor Movement Index or IMX for short.
According to TDA, “The Investor Movement Index, or the IMX, is a proprietary, behavior-based index created by TD Ameritrade designed to indicate the sentiment of individual investors’ portfolios. It measures what investors are actually doing, and how they are actually positioned in the markets.
“The IMX does this by using data including holdings/positions, trading activity, and other data from a sample of our 11 million funded client accounts.
“We create a monthly sample from all of our retail (individual, self-directed) investor clients who have traded recently. Then we use a proprietary methodology based on the holdings and positions in each portfolio to create an individual score. The process is similar to beta weighting (a method of analysis which considers the percentage of each position in a portfolio to create a view of profit and risk), but instead relies on our proprietary models. The median of the individual scores is the overall, or official, IMX.”
I like it because it’s hard data. Tells you what retail investors are actually doing, not just what they say they’re doing.
Anyways, their March numbers are out. The IMX score “decreased by 19.38%, moving to 4.16, down 1.00 from the previous period and reaching the lowest point in over seven years” according to the release.
On the surface, this is a bullish development. I’m not aware of many instances in which retail investors perfectly timed the market. But the indicator can be a little deceiving because the IMX indicator adjusts for relative volatility of the positions each account holds.
And it turns out that retailers were actually net buyers in the month of March. They just bought lower volatility stocks with the most popular ones being: DIS, BA, DAL, AAL, MSFT, AAPL, XOM, and CCL… Yes, retail is jumping in and buying when there’s blood on the streets. And Carnival cruise ships of all stocks… I mean, come on…


