This will all end badly, we’ve not the slightest doubt, and the only question is when. Probably not tomorrow, as we say. But that’s as far out as we’ll go. ~ Alan Abelson, “Up and Down Wall Street,” Barron’s, May 24, 1993 (Dow Jones Industrial Average at 3492) via Niederhoffer’s “Practical Speculation”, chapter “The Cult of the Bear”
Good morning!
In this week’s Dirty Dozen [CHART PACK] we look at sentiment and positioning across player types, we then dive into the technicals and discuss why overbought usually becomes more overbought. We talk about the fat risk premia on offer + liquidity that is driving the moves in risk assets. And finally, we end with a look at the cheapest assets on offer plus a Florida real estate play breaking out of a MASSIVE base…
Let’s dive in.
***click charts to enlarge***
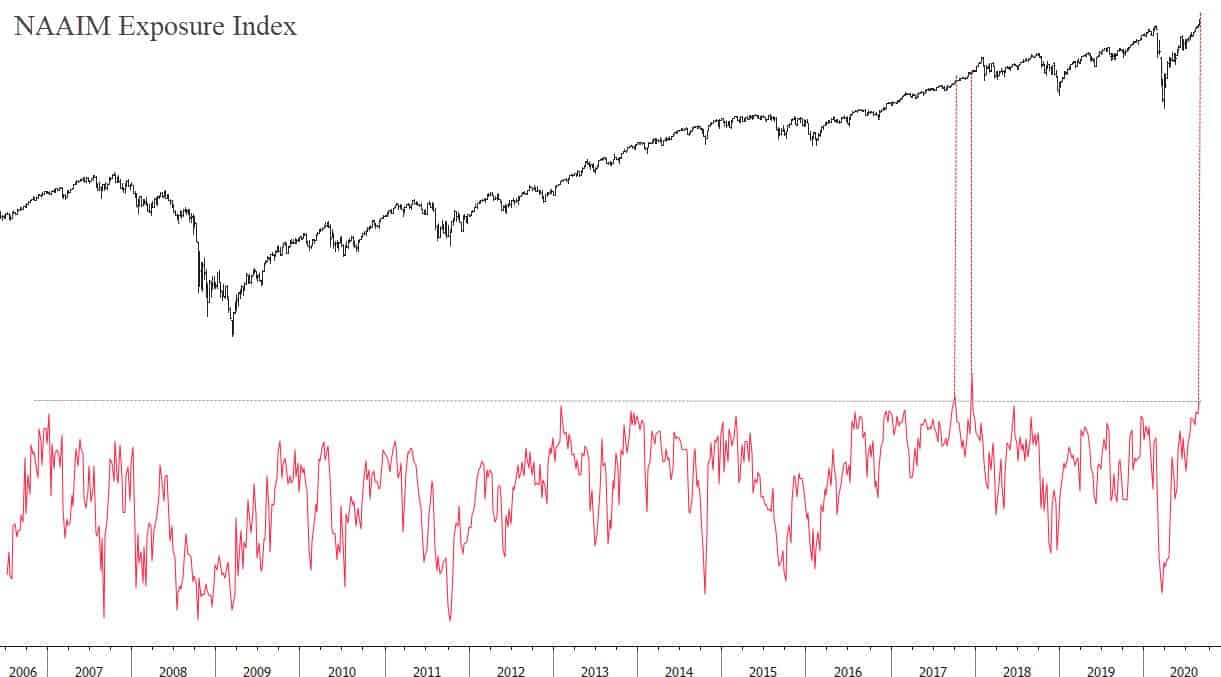
- Last week I shared the Investors Intelligence Bull-Bear chart showing the spread was at its widest point since the Jan 18’ blowoff top. This week we’re going to run through some more sentiment and positioning charts to see how they breakdown across investor types. Here’s the NAAIM Average Exposure Index which measures the reported equity exposure amongst professional money managers. It typically reflects more tactical positioning. It recently hit its highest level since December of 17’ and its third highest point in the survey’s history.
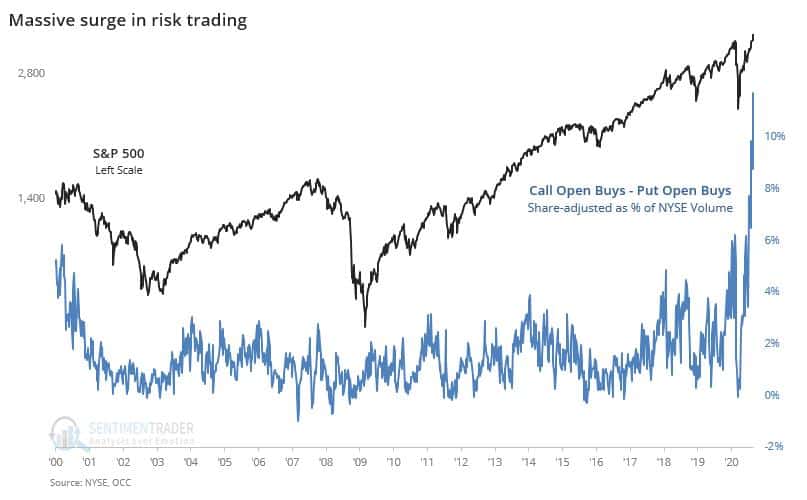
- The “Fed has the market’s back” has become a consensus take. This narrative combined with stimulus money and WFH has led to a large rise in speculative activity amongst retail traders. Here’s a chart from SentimenTrader showing Call Open Buys – Put Open Buys (adjusted as % of NYSE Volume) is at an all-time record high.
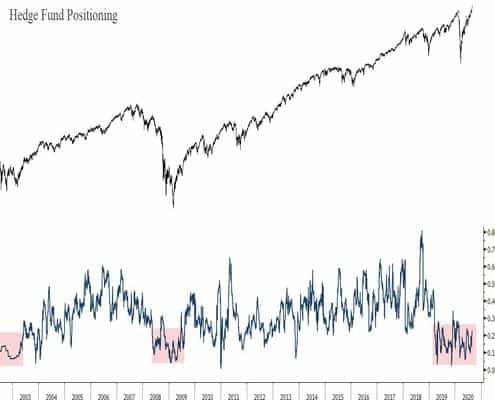
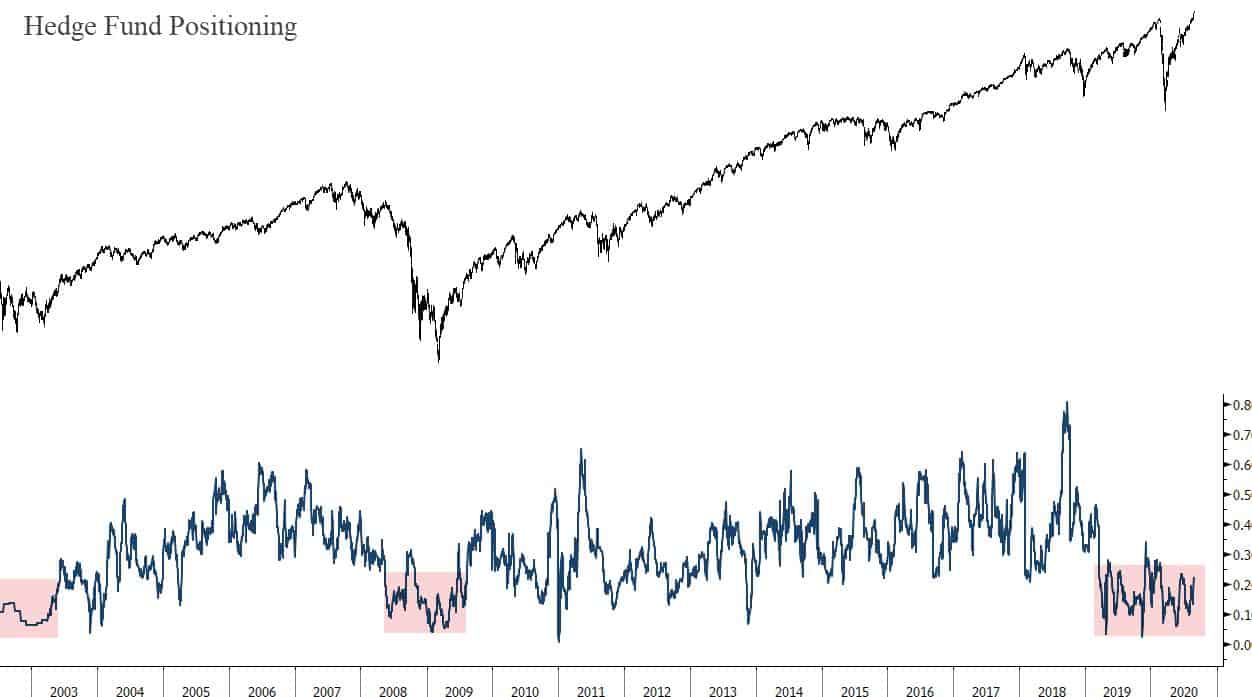
- But there’s one group that stands apart from this speculative orgy and that’s large asset allocators/hedge funds. The chart below shows the general equity exposure amongst this slower-moving class of money managers. It’s still in post-recession/bear market low territory. And even more notable, is how long they’ve been under-invested for. If you think they’re the “smart money” then you could take this as a bearish sign. Or this could be thought of as still yet an untapped source of potential equity demand should they soon shift their risk preferences — I lean towards the latter.
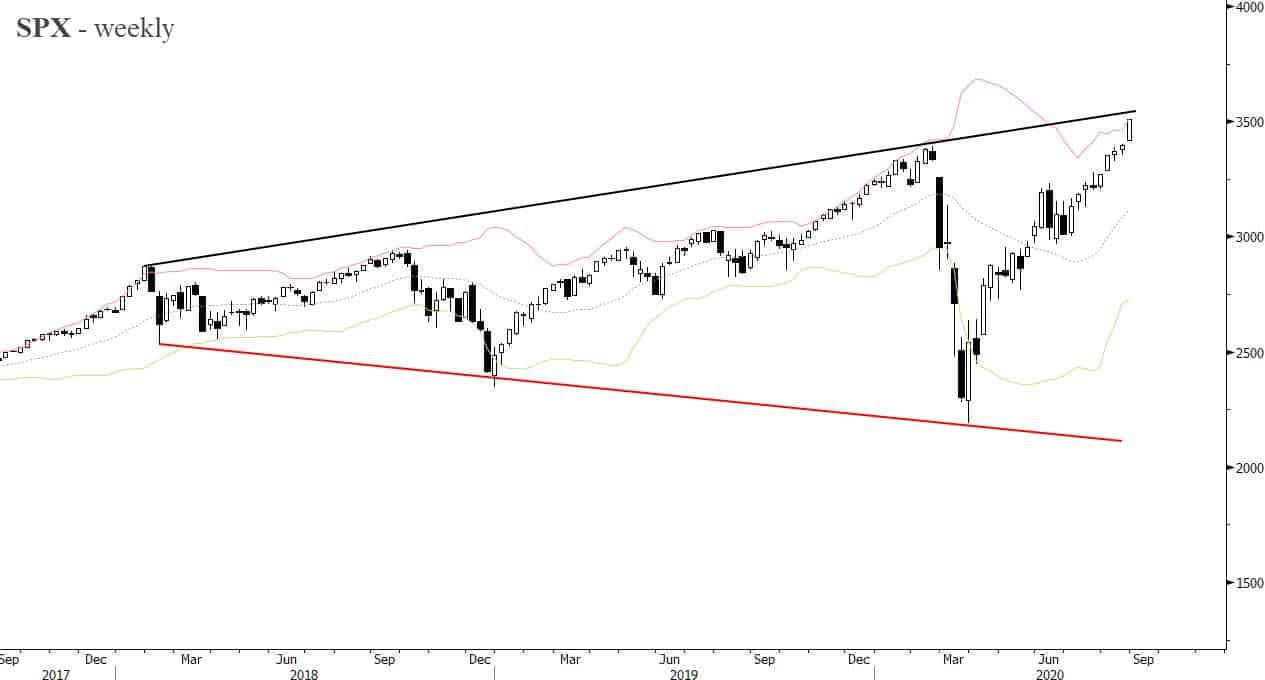
- The SPX is above its weekly Bollinger Band and about to knock into the topside of its 2 ½ year broadening triangle pattern. It’s in a buy climax and buy climaxes last longer than many expect them to. Though we’re moving into the weakest month of the year (September) and trend fragility is high — due to sentiment/positioning and divergences in credit — momentum still favors further upside over for now.
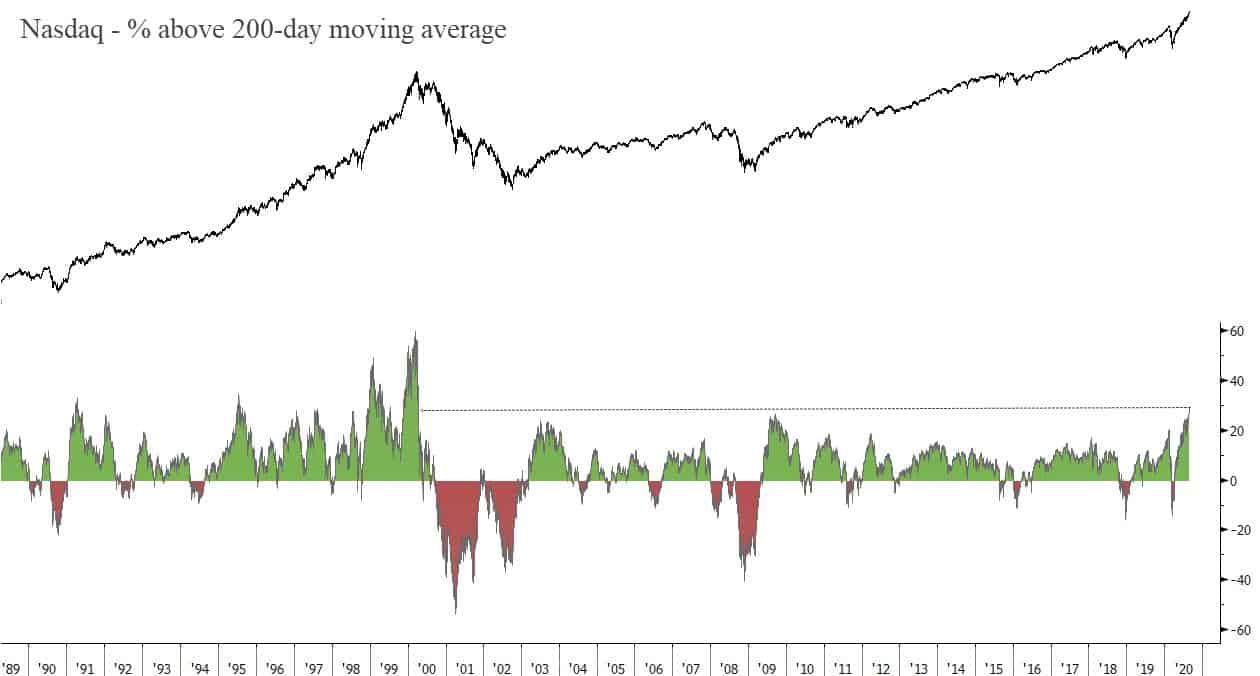
- I saw variants of this chart being passed around showing the spread between the Nasdaq and its 200-day moving average. The funny thing though was that all of those charts only went back to 2003, making the spread look more extreme than it is. So here’s the full chart… This is not to say that tech stocks aren’t extremely overbought. They are. The point is is that overbought is not evidence enough to be bearish, since an overbought market almost always becomes more so. Keep in mind Bob Farrell’s rule number 4 (from his 10 rules) which states that: “Exponential rapidly rising or falling markets usually go further than you think, but they do not correct by going sideways.”
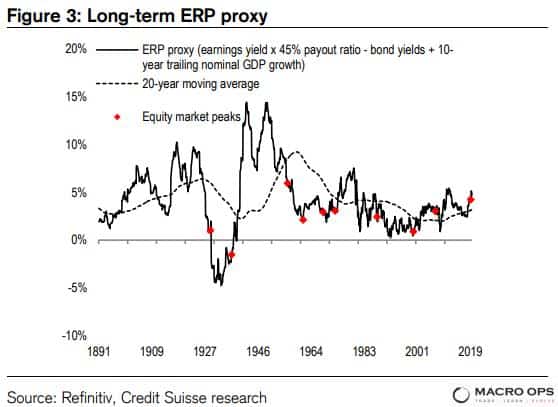
- In financial markets, everything is relative… The perceived value of equities is dependent on the expected return on bonds. Nothing is valued in a vacuum and it’s the spread between assets that drives positioning flows and the abundance of liquidity in the system that determines the amplitude of the relative moves. And that is why it pays to look at risk premiums over P/E ratios. Here’s Credit Suisse making the case for ERP:
“Why investors must look at the ERP not P/E: The ERP gives a much more realistic assessment of valuation than P/E if real bond yields are below the terminal real growth rate…The Fed believes that r* (the equilibrium real short rate) is 1.3% below the terminal growth rate. Currently, the TIPS yield is nearly 2% below the terminal growth rate and we think can move to be c3% below. Importantly, it seems highly likely to us that the TIPS yield will stay depressed for the next decade (as that seems the most politically and economically acceptable route to allow government debt to GDP to stabilize and unemployment to fall to low levels). The aggregate policy setting (fiscal, monetary, and corporate lending conditions) are twice as loose as they were at the peak of the GFC, allowing inflation to return while bond yields are capped.”
I don’t share their same conviction regarding inflation trends over the next decade. That whiffs of hubris to me considering how wide the cone of probabilities is today in regards to potential fiscal and monetary policy experiments. But… the ERP is still plenty wide on equities and well above the point that marks most major market tops.
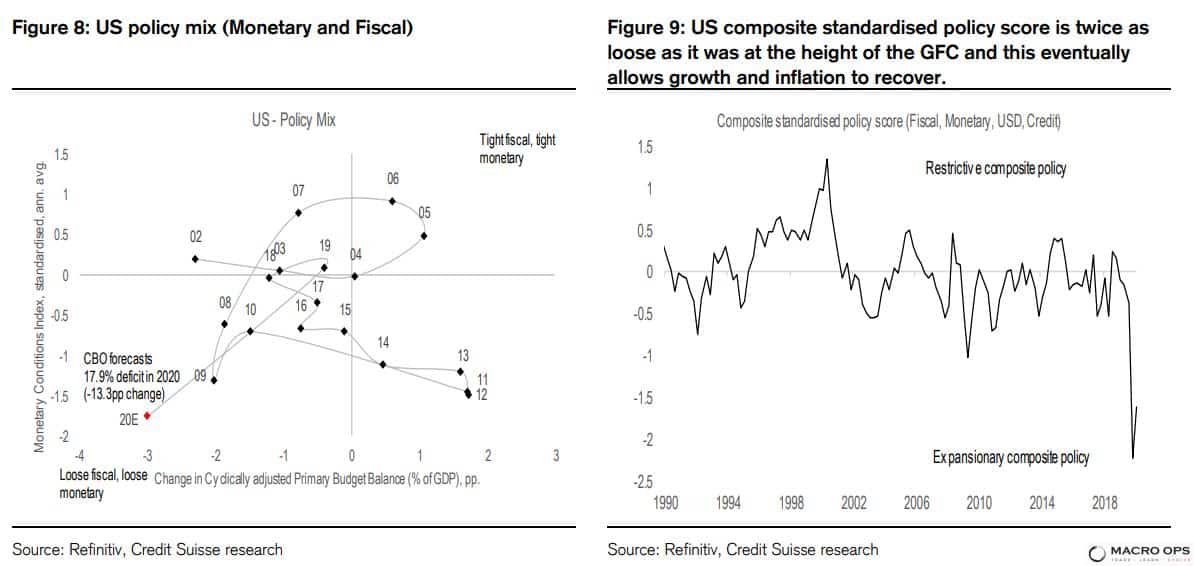
- And here’s another chart form CS showing that the composite (fiscal + monetary) policy score is twice as loose today as it was during the GFC. Liquidity is strong…
- Last week I put out the first piece in a series I’m doing on the dollar (here’s the link). The second installment will hit your inboxes in a day or two. Anyways, in the write-up, I talked about how I am looking for a short-term reversal soon because the dollar is overextended, bearish sentiment and positioning are crowded, and rising US bond yields are supportive of the move.
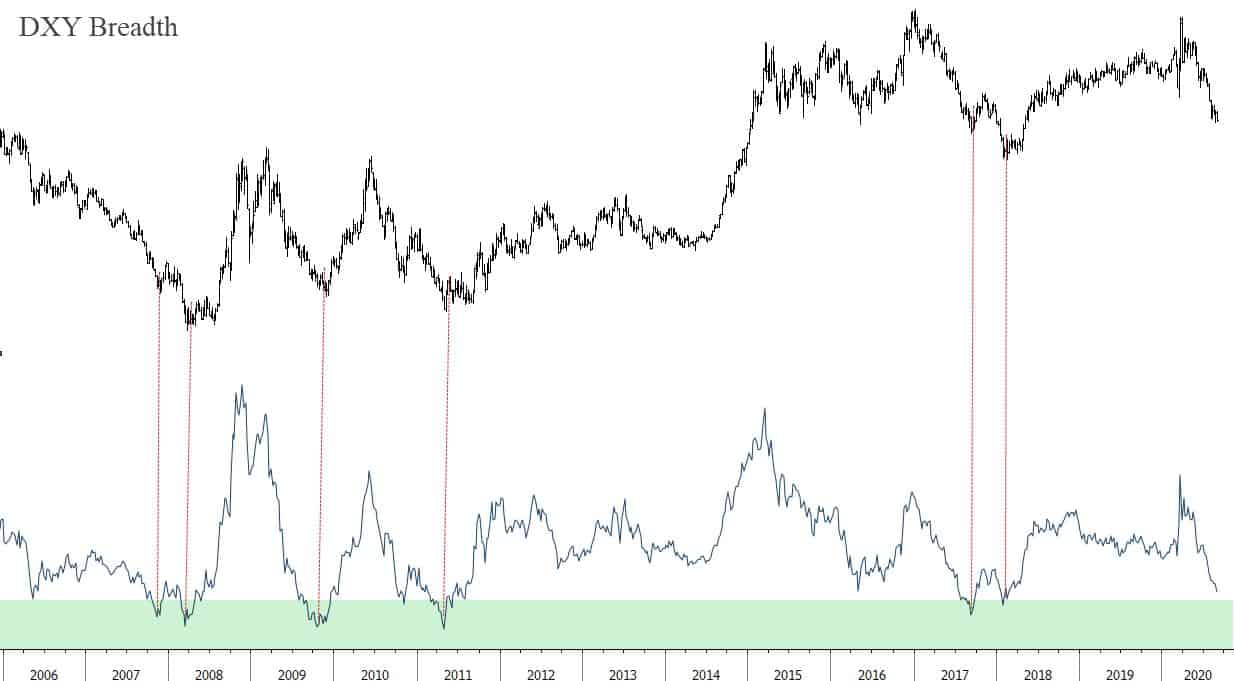
So far, the DXY has failed to rally and it in fact looks like it might break lower from its current consolidation. I’m okay with this since we’re short USD through a couple of pairs. Here’s a chart I’m watching closely. It’s a weekly of the breadth of cross dollar pairs. The green zone represents majorly oversold levels. The key though is that you want to see breadth turn and confirm a move higher. Right now it’s pointing straight down which favors the bear case in the near-term.
- Last week I did a short twitter thread on the topic of Bubble Rotation from Lars Tvede’s excellent book “Business Cycles: history, theory and investment reality.” There are some useful heuristics in there that’ll help you figure out where the next “bubbles” are likely to spawn. I’m personally looking at commodities, which are trading at all-time lows relative to the market (chart via GMO).
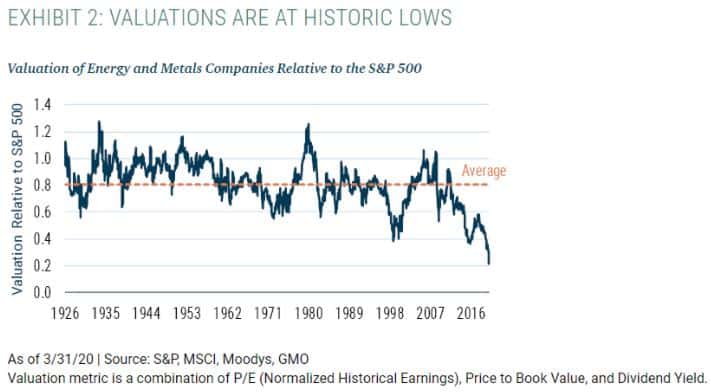
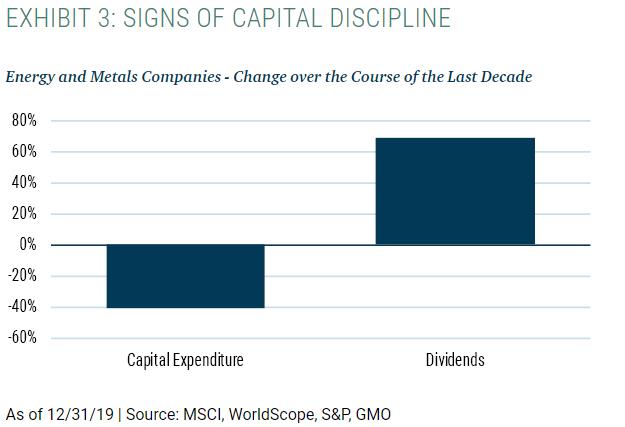
- They are going to have massive Capital Cycle tailwinds over the coming decade. According to GMO, CAPEX has been cut by more than 40% over the last decade. We’re tracking some exciting opportunities and are just patiently waiting for the market to signal that the time is ripe.
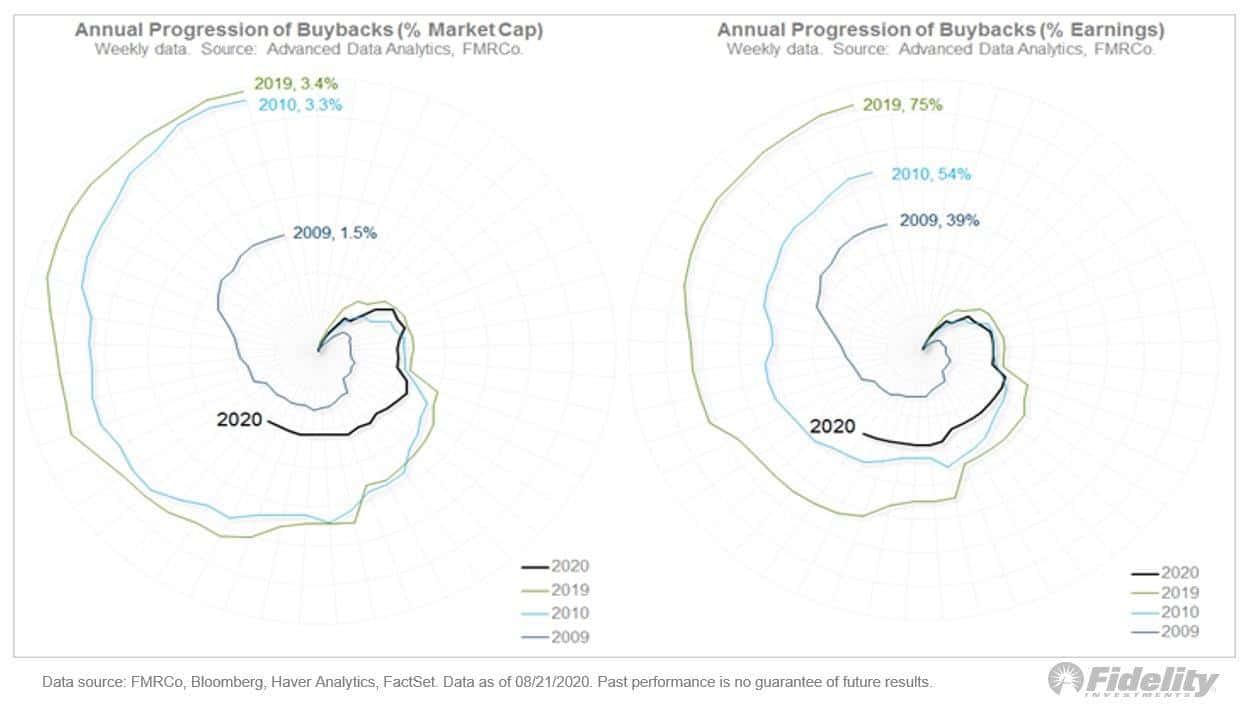
- Buybacks are a critical input in the cyclical market equation. This is why the below chart from @TimmerFidelity is concerning. Buybacks are extremely depressed this year. And it’s unlikely the bull market can extend its run much further if this key source of demand remains tepid.
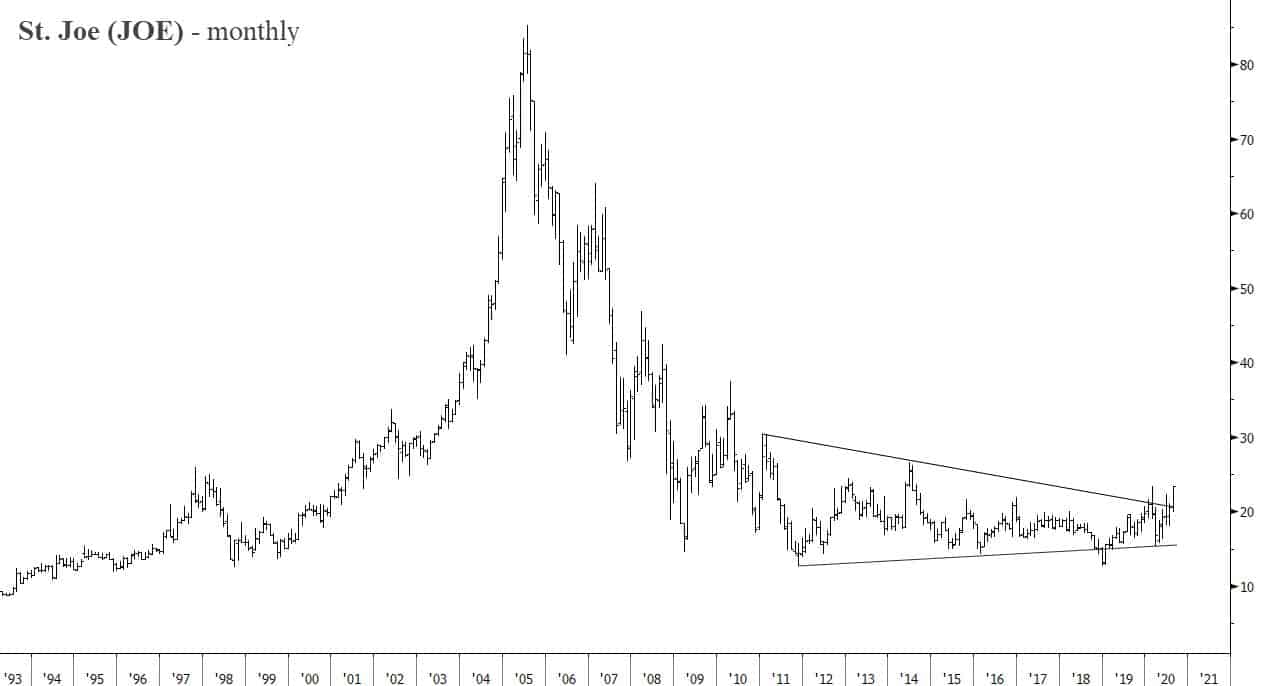
- We’ve been quite bullish on real estate plays at MO, as there are a number of strong secular tailwinds for the sector. One play, that we’re considering adding to our book is St. Joe (JOE). I read a number of bullish writeups on the company years ago as it was a faddish value stock for a time. I’ve kept it on my radar since but it’s been a dead money chart until only recently. The monthly chart below shows the stock is about to close at 6-year highs.
The company owns a massive portfolio of mixed-use land in Florida. Much of that acreage is prime beachfront real estate. Their developments are benefitting from a boost in demand due to long-term migration shifts with people seeking out nicer climates, lower taxes, and more rural living. You can find an older writeup on the stock done by our friend Kuppy over at his blog, Adventures in Capitalism.
Stay safe out there and keep your head on a swivel.