Summary: This is where the market gets a bit trickier. On the bullish side of the ledger, we have a significant price thrust off the April lows, accompanied by historically strong positive earnings revisions — that despite bearish grievances are fairly broadbased. It would be highly unusual for the market to correct more than 5% following its -10% correction in March and a v-bottom to new highs. On the flip side of things, we have an unusually narrow market with weakening breadth and new lows that are typical of bear markets, not the start of new bull legs. The MO liquidity gauge remains negative, while yields are breaking out from a historic compression regime — both bode ill for 3-6m returns. Where does this all put us then? I honestly don’t know. And when you throw in all the potential event risks, both positive and negative (US/Iran, Hantarivus, Trump goosing things for midterms, etc…) you get quite a puzzle. So not much to do but to stay humble, keep nimble, and tactically press what’s trending while tightly managing your risk!
***Quick housekeeping note: Enrollment into our Collective is open until the end of this week. The Collective includes all of our research, a full library of reports and videos on theory and strategy, our proprietary market dashboard, plus our internal slack where the team and I, plus fund managers and die-hards from around the world talk shop, exchange ideas, and shoot the shit. We will be raising our prices by over 25% within the next few months. So if you’ve been on the fence, now’s a good time to jump so you can lock in current pricing. Looking forward to seeing you in the group. ***
MO Portfolio & Trades
1. Last week was a painful one for the MO port. Mid-week it hit a YTD high of +61%, only to give back all the weekly gains and then some. The port ended Friday down -210bps, sitting at +50.7% YTD.
Core book: high levels of cash, long AI and semi plays, long RTY, long BTC, long BBG Commodities ETF, short bonds, long VIX, long Ags, long RBOB and Brent, short KC Coffee, long solar, long lithium and RE miners, plus a couple idiosyncratic equity names.
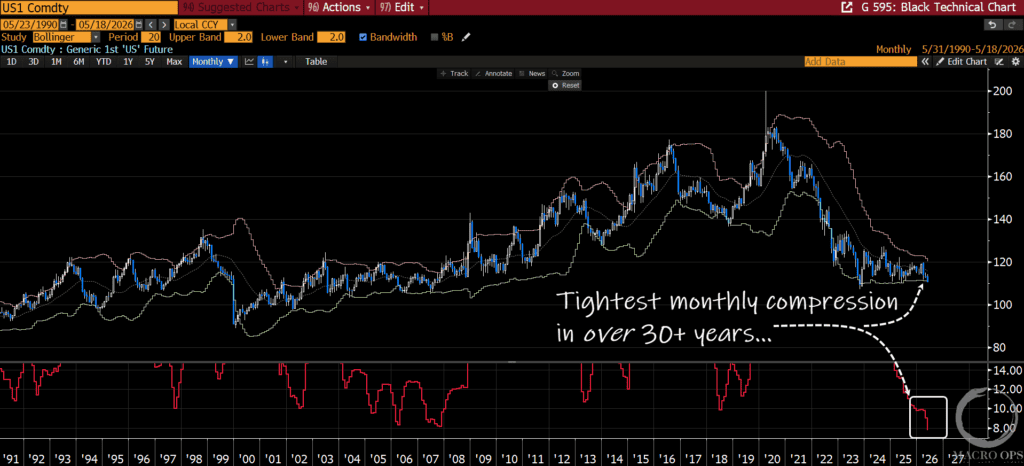
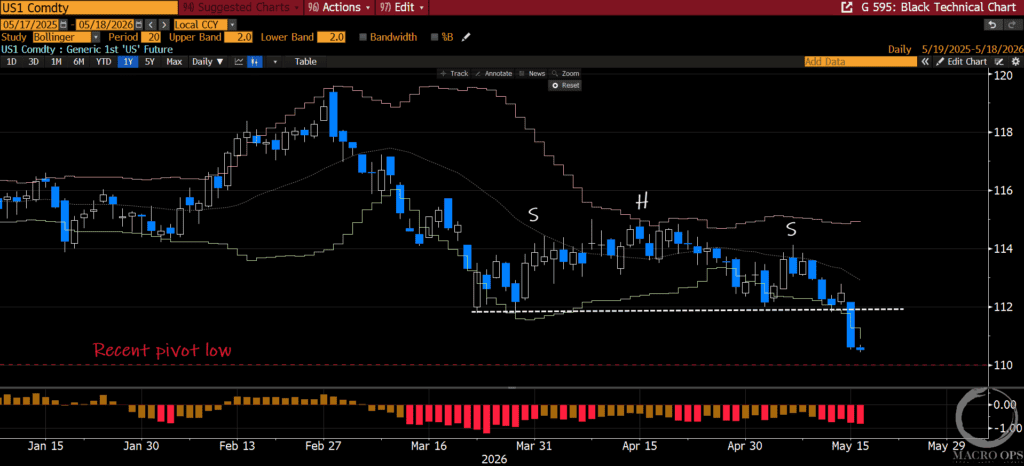
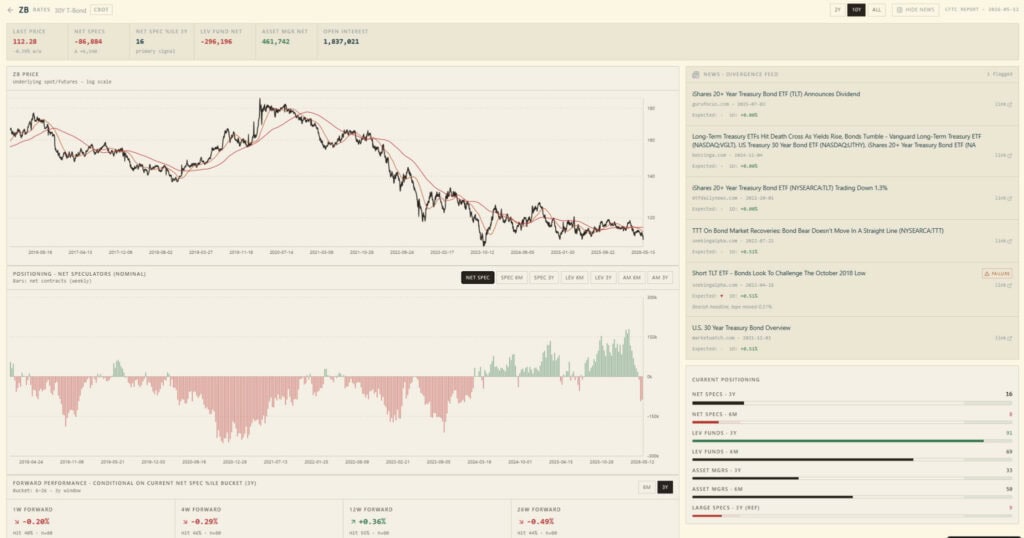
2. Back in September of last year I began writing about the increasingly tight compression regime that bonds were entering, suggesting a large trend was cooking (link here). Then in early March I noted the record long positioning in bonds, tilting the odds in favor of a bearish breakout (link here). The long end is now down at its lower monthly band and looks ready to punch through, while its monthly Bollinger Band has hit its tightest compression for which we have data. If this bearish breakdown holds, it’ll have significant repercussions across all major assets. This is the most important chart in macro at the moment.
3. We got short last week on the completion of this H&S continuation pattern (chart is a daily).
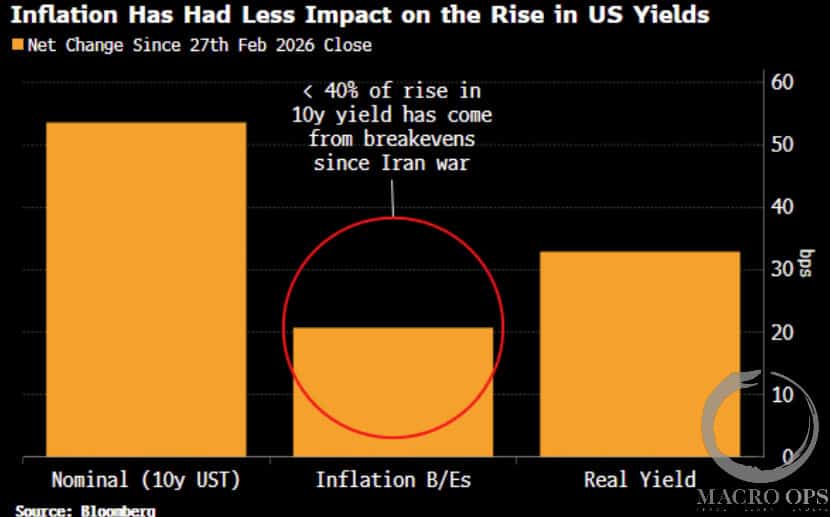
4. What’s interesting is that the recent rise in yields has been primarily driven by real yields, not inflation — despite one of the largest energy shocks since the 1970s, notes BBG’s Simon White. He writes “Real yields are rising as the market prices in a higher terminal rate for the Federal Reserve, with the peak implied rate from SOFR futures rising from under 3% on the eve of the Iran war to 3.85% now. Ten-year inflation breakevens have risen only about 20 basis points… That leaves a glaring risk if the market decides to take inflation risks from rising energy prices more seriously.”
The most obvious (to me, at least) and underpriced risk to this market is that we not only don’t get a ceasefire but things intensify, significantly.
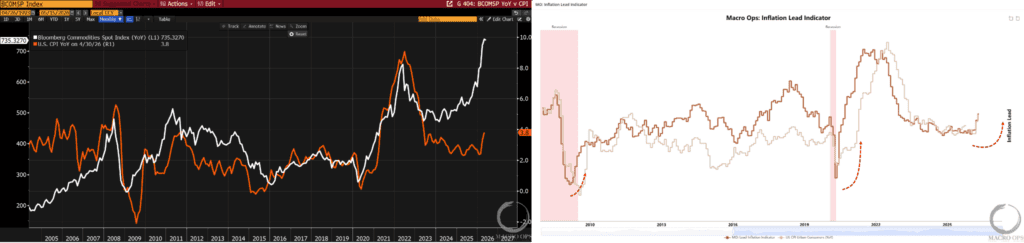
5. And it’s probably a good time to start taking inflation risk seriously… Chart on the left shows BCOM Index in white, leading CPI (in orange) higher. While the chart on the right shows our Leading Inflation indicator hockeysticking higher.
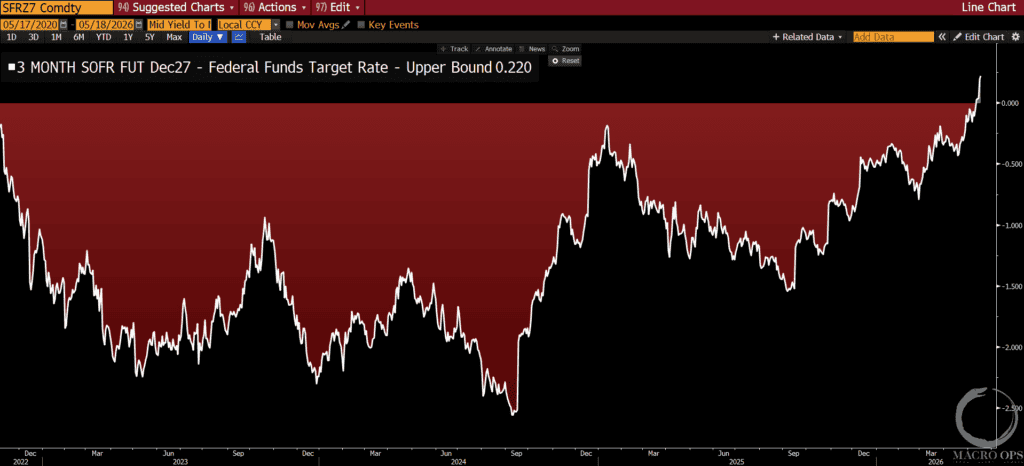
6. Dec 27’ SOFT rate has traded above the Fed Funds target rate for the first time this cycle, putting the rate cutting cycle on notice.
Trifecta Charts
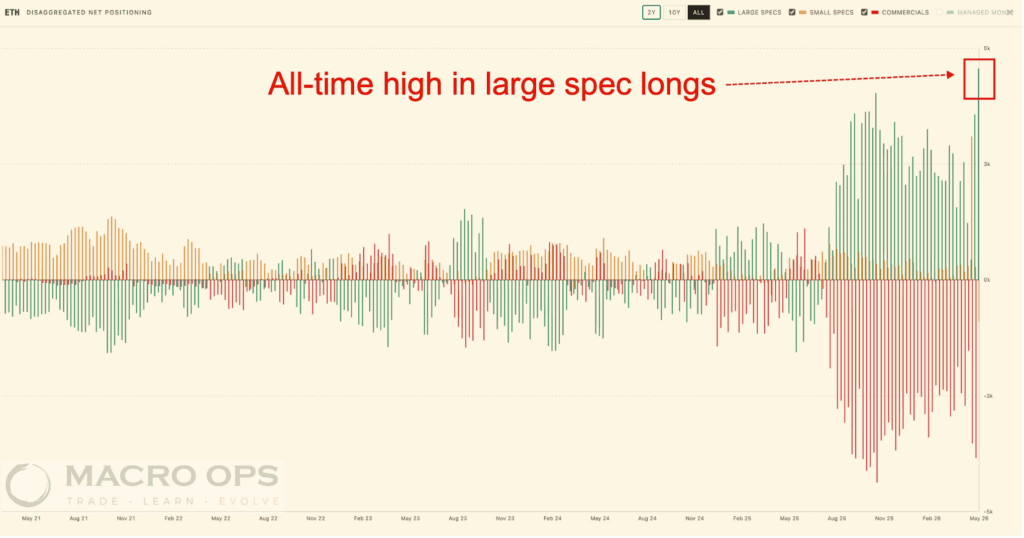
7. Long bond positioning has quickly flipped bearish, but it’s doing so from all-time record long positioning on a nominal basis. There are many events that could reverse this breakout (Hantavirus narrative, US-Iran deal, etc..) but with our indicators pointing to 6%+ NGDP and rising inflation volatility, bonds seem to be grossly overpriced.
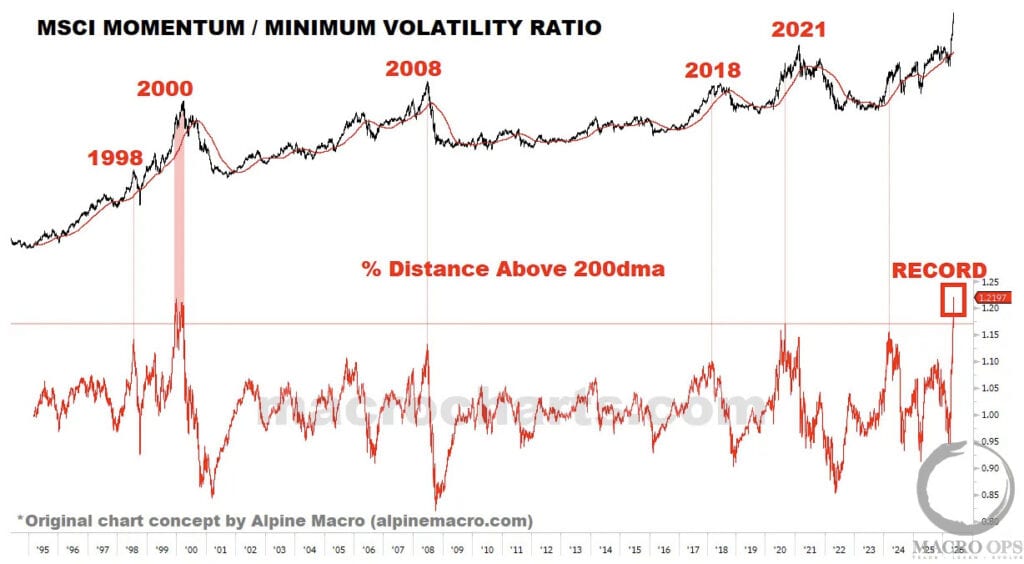
8. Someone sent me this interesting chart from @MacroCharts showing MSCI Momentum / Minimum Volatility spread’s % distance above the 200dma is at an all-time record high, surpassing the previous extreme reading in 2000.
This isn’t an immediately actionable chart. But it does point to the late cycle characteristics of the current rally.
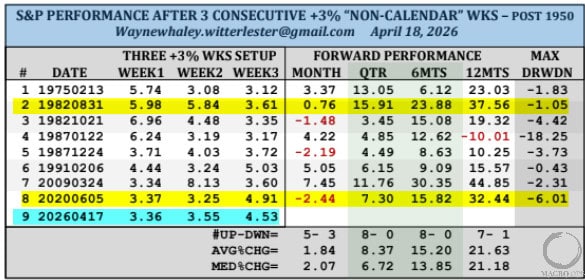
9. I’m increasingly split on this market. The “Whaley Price Thrusts” off the April lows, was significant. It also followed a -10% correction and when you get a 10% correction followed by a significant V price thrust to new highs, it’s highly unusual to see another significant (5%+) correction over the following six months. However, this is also just a highly unusual environment and the v-bottom wasn’t accompanied by any other classic breadth thrusts.
What does all this tell us? Not much, other than to keep humble and stay nimble, as we’re not in your typical bull market anymore. Give this thread from OG Walter Deemer a read where he shares his thoughts on the subject.
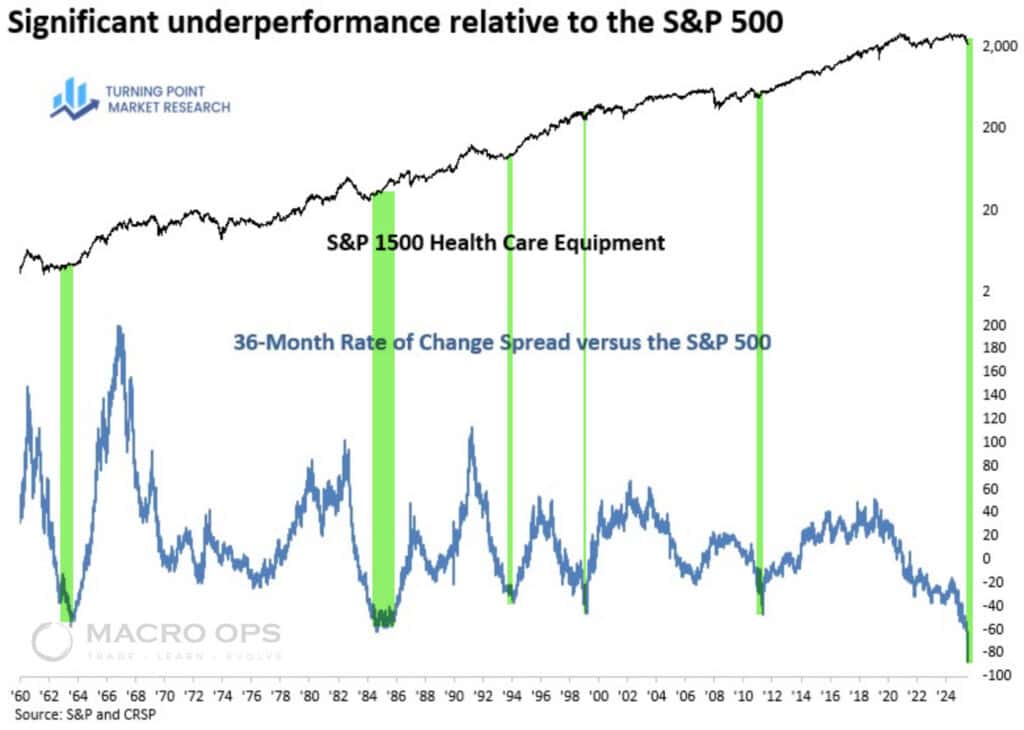
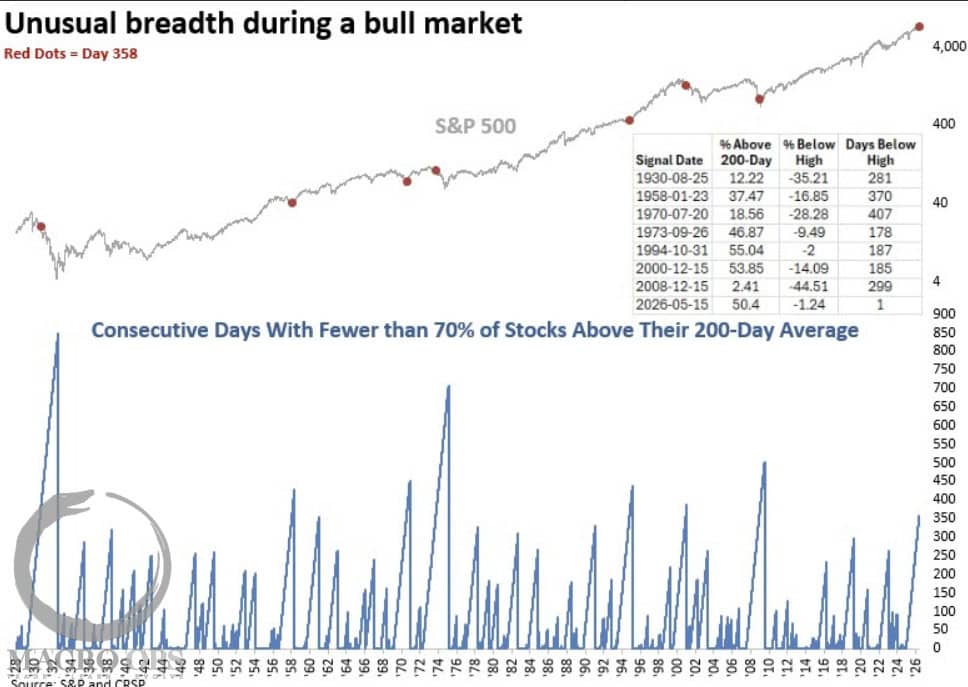
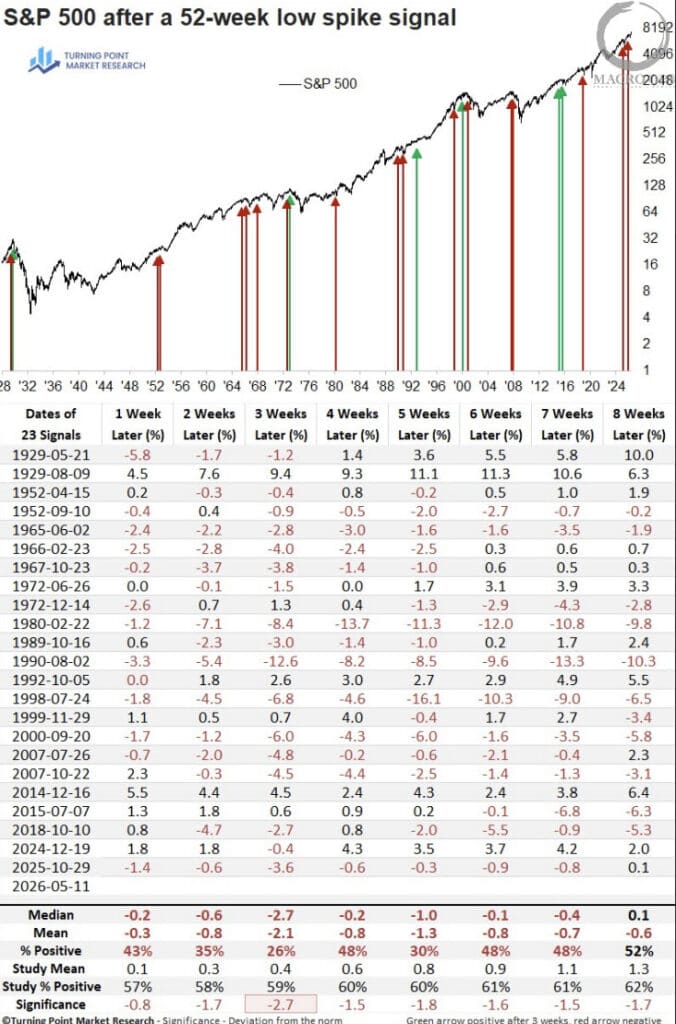
10. Speaking of unusual… our friend Dean Christians at TPMR makes a similar point in a recent note writing “in all but one case—1994—when fewer than 70% of stocks were above their 200-day moving averages for 358 consecutive sessions, the S&P 500 was in a bear market.”
Macro
11. And “A component of the TCTM Risk-Off composite issued a new alert when more than 7.75% of S&P 500 constituents fell to 52-week lows as the index hovered near a multi-year high. Historically, this kind of breadth deterioration has often preceded periods of increased market stress.
What makes this latest signal unusual is that it occurred while the S&P 500 was at a record high and still exhibiting strong upside price momentum.”
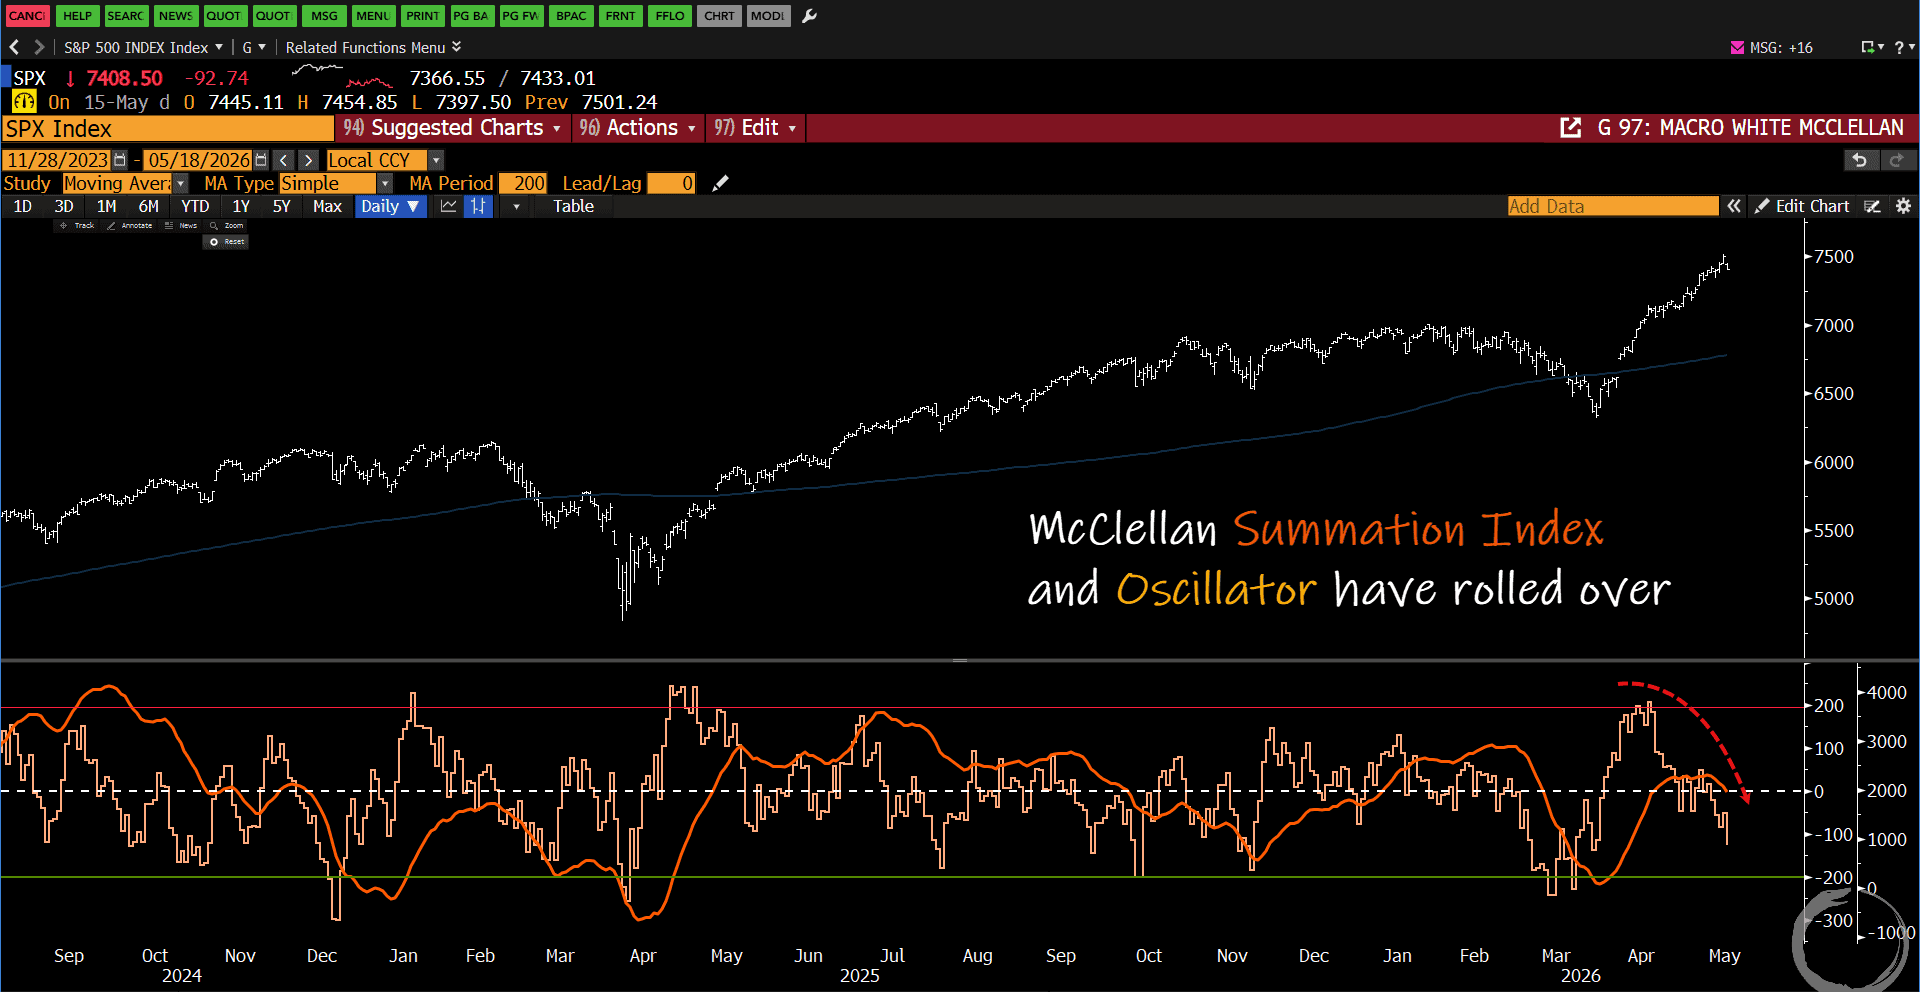
12. Our preferred short-term breadth gauges, the McClellan Summation Index and Oscillator have both firmly rolled over. This raises the likelihood that the market has started a technical correction. Whether that correction is sideways (through time) or down (through space) will depend on how quickly yields reprice, imo.

Trade Setups / Topical Charts
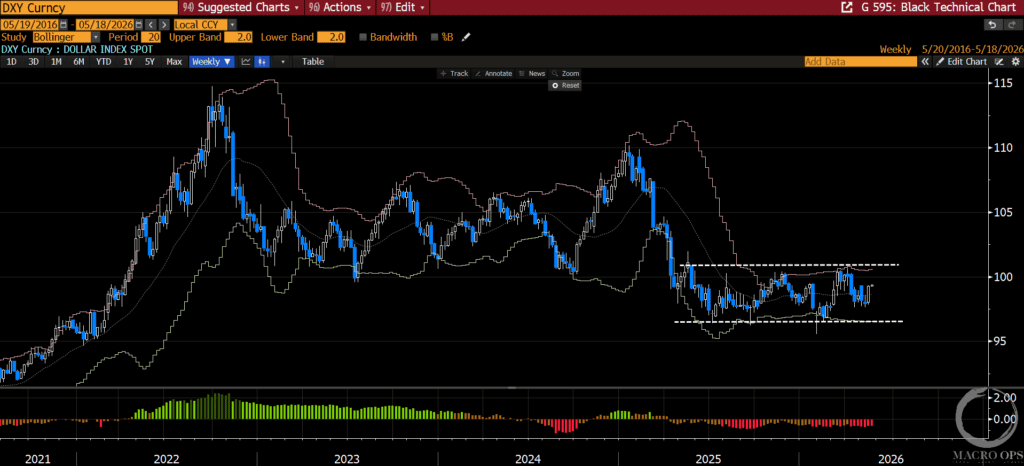
13. Increasing inflation volatility and rising yields should start to bring some action back into the FX majors soon. The dollar index (DXY) continues to compress within its 15m+ sideways range. A BIG move is coming. Our bias is for a break lower but we’ll happily play a trend in either direction.
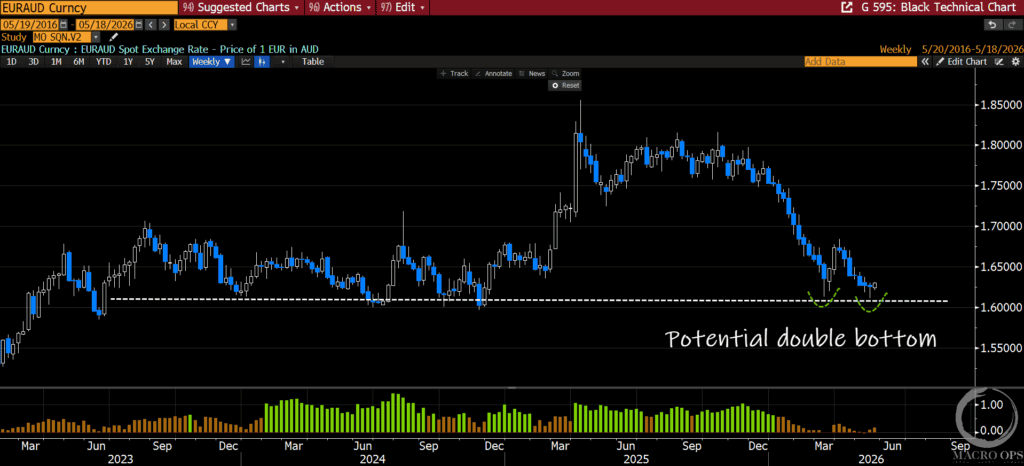
14. Our Lead Technical Analyst,Mike G, pointed out EURAUD’s potential double bottom in his always excellent weekly, This Infinite Game. I like this trade as positioning is crowded long AUD while it’s quite short EUR. And price is reversing off a mutli-year significant level.
Thanks for reading.