Summary: The Nasdaq has posted eight consecutive weekly gains — a historically rare signal that has preceded positive three-month returns in the large majority of prior instances. Defensive sub-industry relative performance has reinforced that reading. Both data points argue for remaining long the trend.
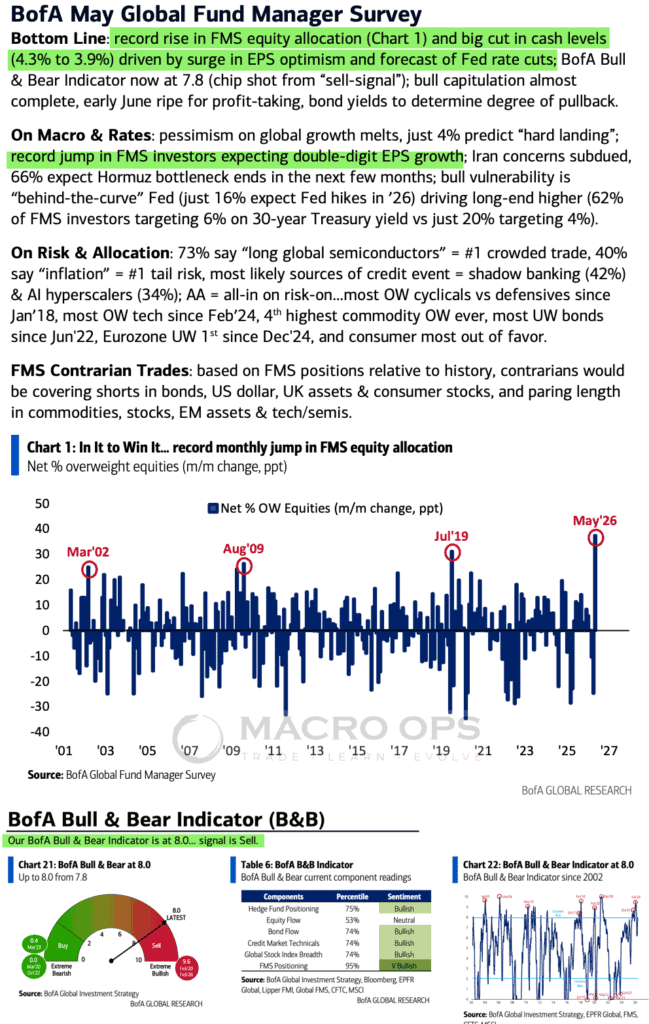
Against that, three developments warrant attention: our Trifecta Lens Score deteriorated last week; fund manager sentiment surveys show signs of euphoria; and BofA’s Bull-Bear Indicator triggered a sell signal. We are not calling a top. But the distribution of outcomes has widened. The appropriate response is to trail stops, size down on risk and tactically ride the momentum.
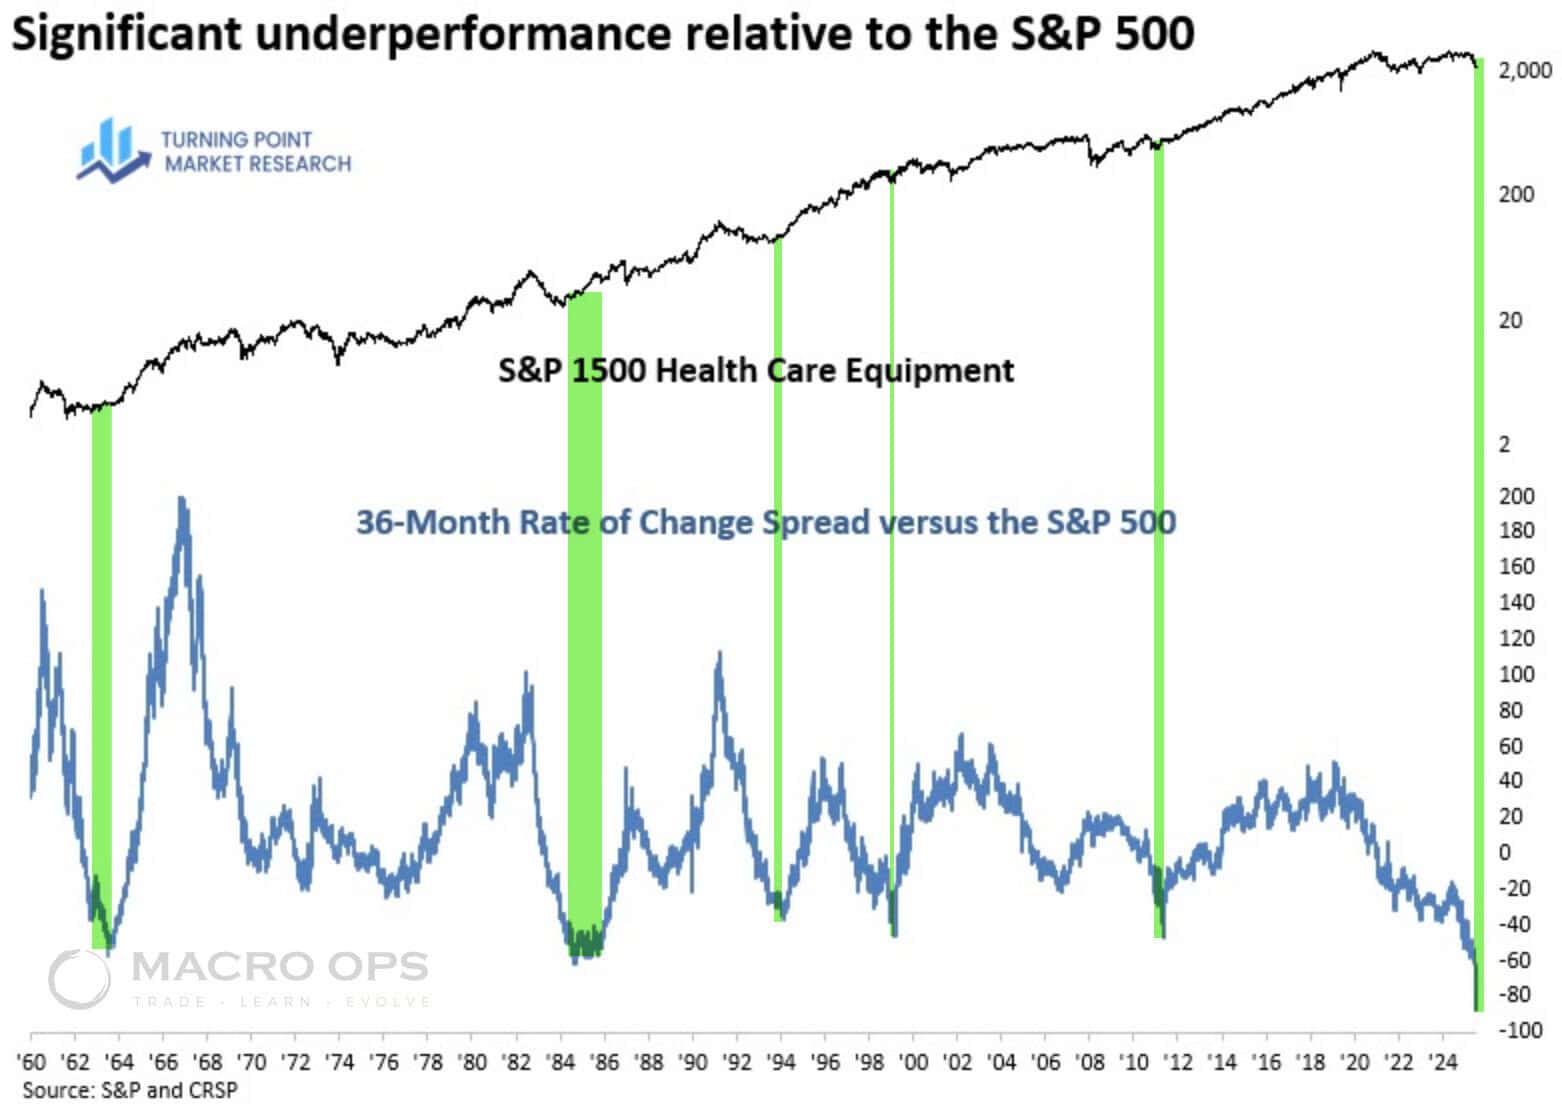
Separately, we examine Healthcare Equipment, which is registering its most oversold reading in recorded data and merits a closer look as a mean-reversion candidate.
***Quick housekeeping note: Enrollment into our Collective is open until the end of this week. The Collective includes all of our research, a full library of reports and videos on theory and strategy, our proprietary market dashboard, plus our internal slack where the team and I, plus fund managers and die-hards from around the world talk shop, exchange ideas, and shoot the shit. We will be raising our prices by over 25% within the next few months. So if you’ve been on the fence, now’s a good time to jump so you can lock in current pricing. Looking forward to seeing you in the group. ***
MO Portfolio & Trades
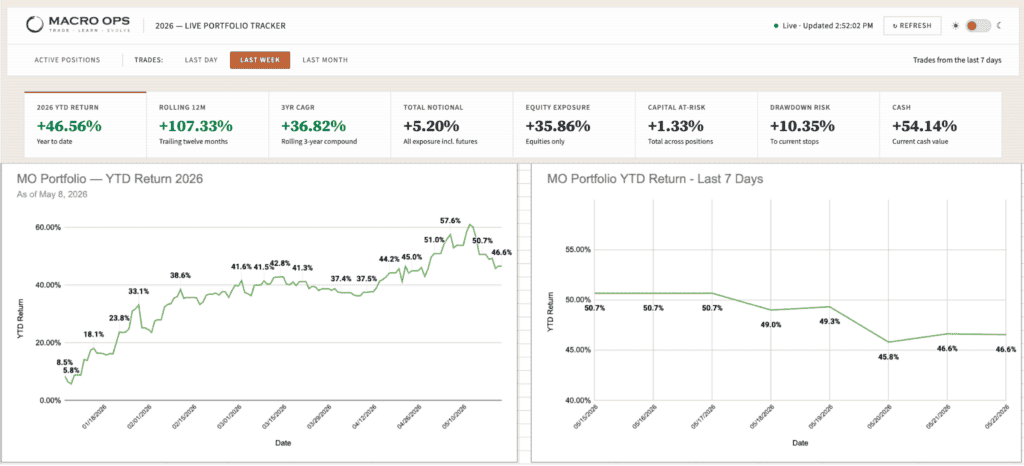
1. The portfolio ended last week down 344 bps, bringing year-to-date returns to +46.56%. We are now 14% below our YTD NAV high of +61%.
Current positioning: elevated cash, select beaten-down software, healthcare, and cybersecurity names; short ETH/USD; long the Bloomberg Commodity ETF; short duration; long solar; a handful of idiosyncratic equity positions.
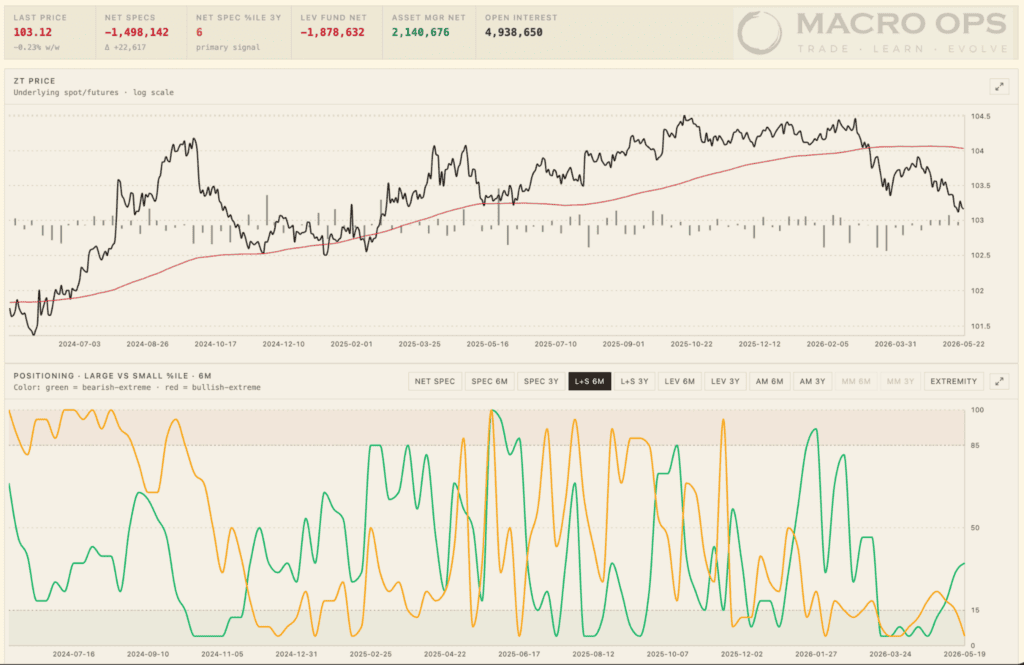
2. We are structurally bearish the long end of the curve but acknowledge it is technically oversold at a meaningful support level. Front-end positioning has grown crowded on the short side, and ceasefire speculation has begun unwinding that trade. A tactical long entry in the front end is worth considering. Any strength in the long end we will use to re-up our short.
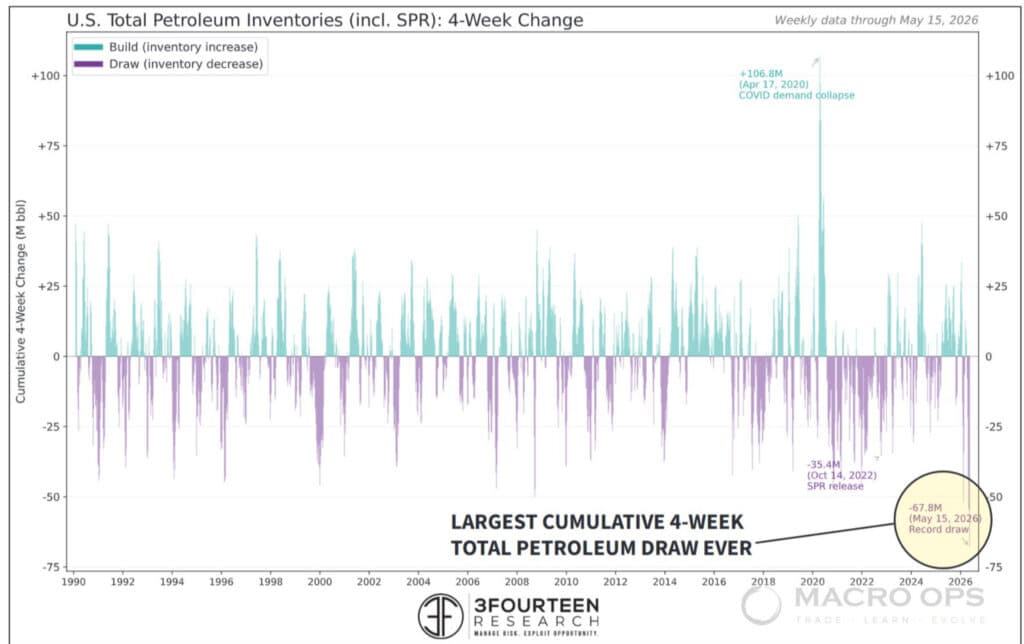
3. We significantly reduced long energy exposure last week. The tape was heavy, and ceasefire chatter introduced enough headline risk to justify trimming ahead of a positioning flush — regardless of where fundamentals stand. Our base case remains that any ceasefire will be short-lived, measured in weeks rather than months. However, we have no interest in stepping in front of a narrative-driven unwind, even when the fundies increasingly favor being long.
From Warren Pies: “The last month recorded the largest cumulative draw of total U.S. petroleum inventories on record. Gasoline inventories on a seasonally adjusted basis are at their lowest since 2014. Distillate inventories are at their lowest since 2003. The next few weeks represent a crucial window for oil fundamentals.”
We will look to re-engage on any washout.
Trifecta Charts
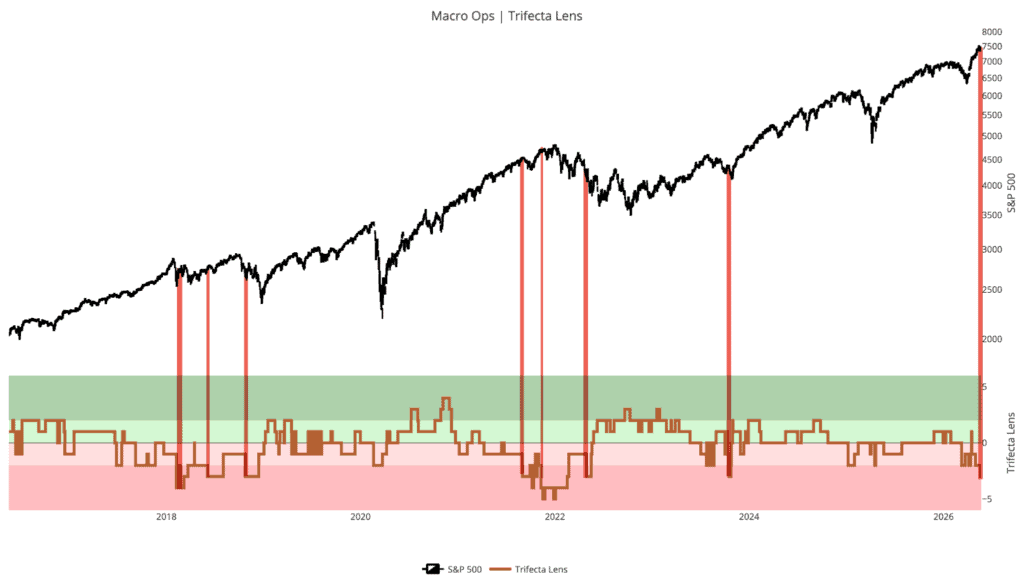
4. Trifecta Lens Score dropped to -3 last week. This reading is not yet confirmed — it could reverse quickly. But historically, a reading at or below -3 that persists has preceded elevated volatility regimes with high reliability. We are watching closely.
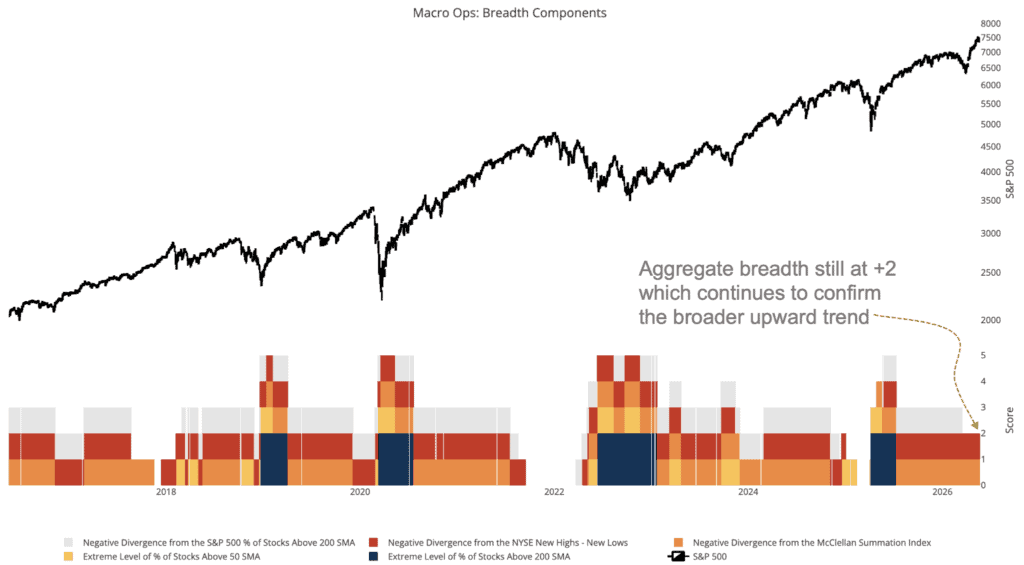
5. Aggregate Breadth Indicator remains at +2, which is supportive of the broader trend. Historically, larger corrections have not been preceded by readings above 1. No deterioration here yet.
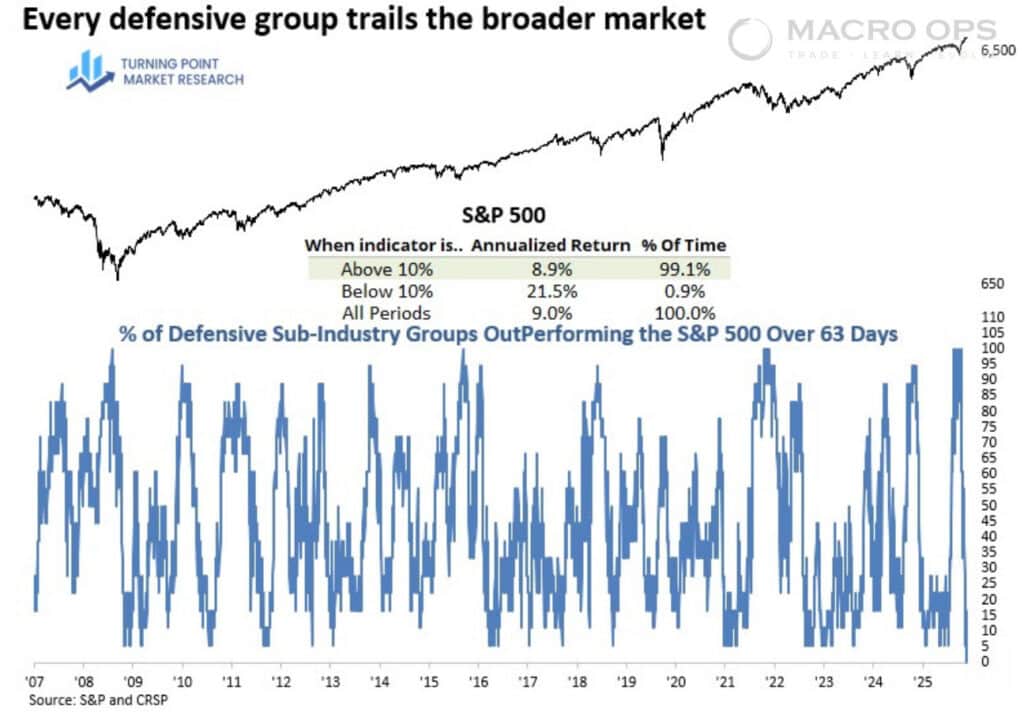
6. My friend Dean has built a really deep sub-industry dataset back to the 1960s, and one of his favorite tells is what defensive groups are doing versus the S&P over a rolling 63-day window. In his latest work (link here), that indicator went from 100% of defensive sub-industries outperforming during the Iran conflict pullback to literally 0% afterward—something his history has never recorded before.
As Dean notes, when fewer than 10% of defensive groups are outperforming, the S&P has historically posted about a +21.5% annualized return, which is a pretty powerful bull-market signal.
7. BofA’s latest Global Fund Manager Survey shows record equity allocation, a sharp drop in cash holdings, record expectations for earnings growth, and a second consecutive Bull & Bear Indicator sell signal. The prior signal triggered February 26 — just ahead of the Iran-conflict selloff.
Sentiment at these levels does not predict the direction of the next move. It does reduce the margin for error.
Macro
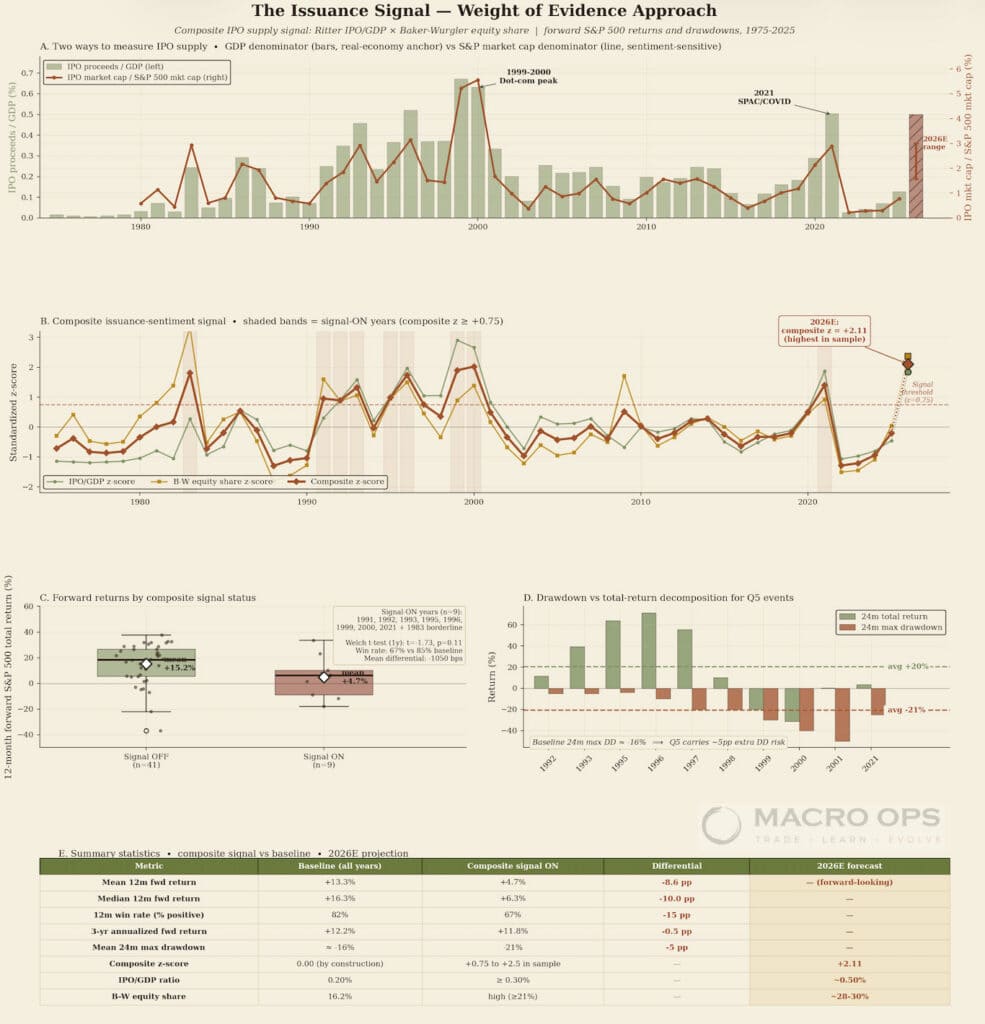
8. The “Issuance Signal” study tests whether surges in equity supply — IPO proceeds normalized to GDP, combined with Baker-Wurgler’s classic equity share of new issuance — predict weaker forward S&P 500 returns. Across 50 years (1975-2024), the composite signal fires in just 9 instances (1991-96 cluster, 1999-2000, and 2021), and in those years subsequent 12-month returns averaged just +4.7% versus the +13.3% baseline, with maximum drawdowns averaging -21% over the following 24 months versus -16% otherwise.
Critically, the 2026 projection of ~$160B in IPO proceeds plus ~$440B in follow-on issuance would produce a composite z-score of +2.11 — the highest reading in the entire 50-year sample, exceeding even 1999-2000 and 2021 — though this is contingent on the projection materializing rather than coming in like the muted 2023-24 cycle.
The signal should be read as a late-cycle regime warning rather than a market-timing trigger: it can fire 2+ years before the actual peak, but every prior reading above +1.8 was followed within three years by a peak-to-trough drawdown of at least -20%.
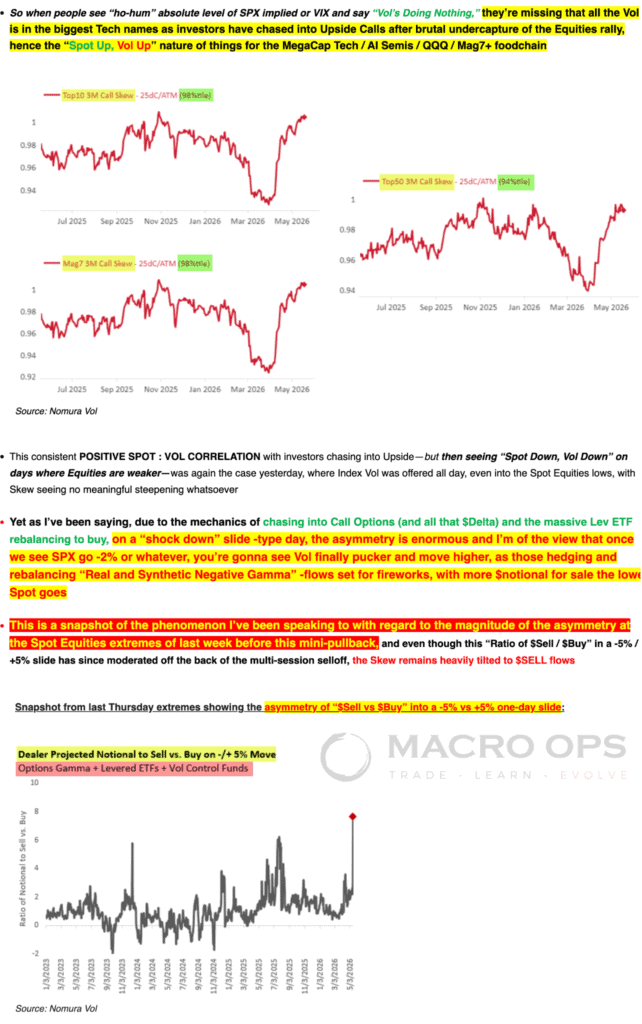
9. Nomura’s Charlie Mcelligott’s latest on the inevitable “shock down
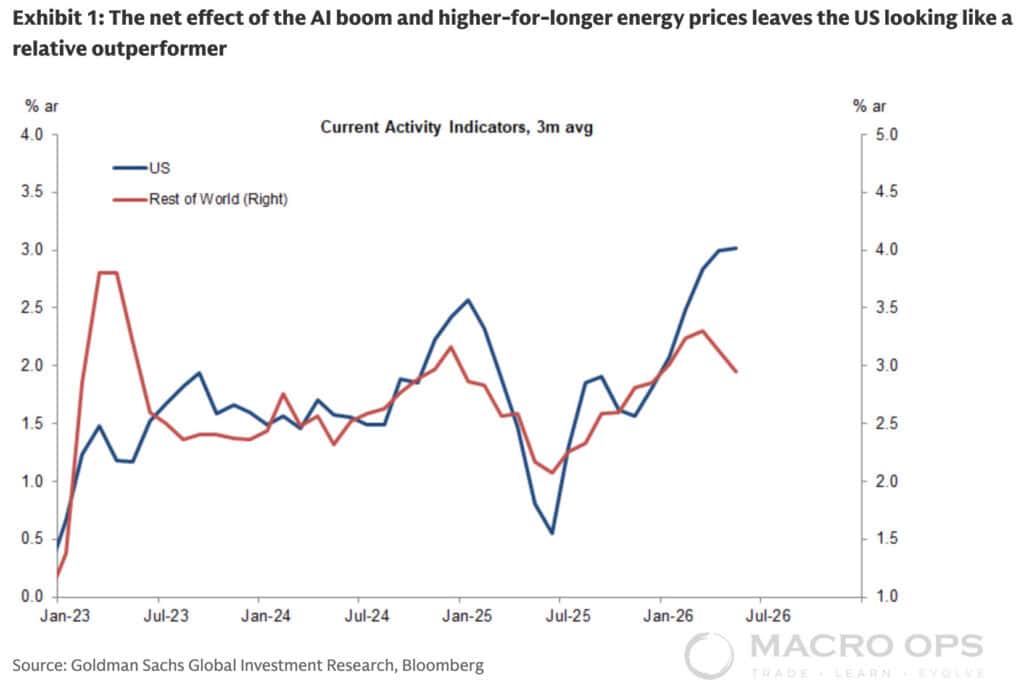
10. The AI CAPEX spend is driving a massive surge in US vs RoW economic outperformance. This growth divergence has driven a breakout in US vs RoW equities. Yet, what’s interesting is that DXY — which typically tracks relative growth and equity performance — remains firmly in its 12m+ range. A sign of USD oversaturation? I think so.
Trade Setups / Topical Charts
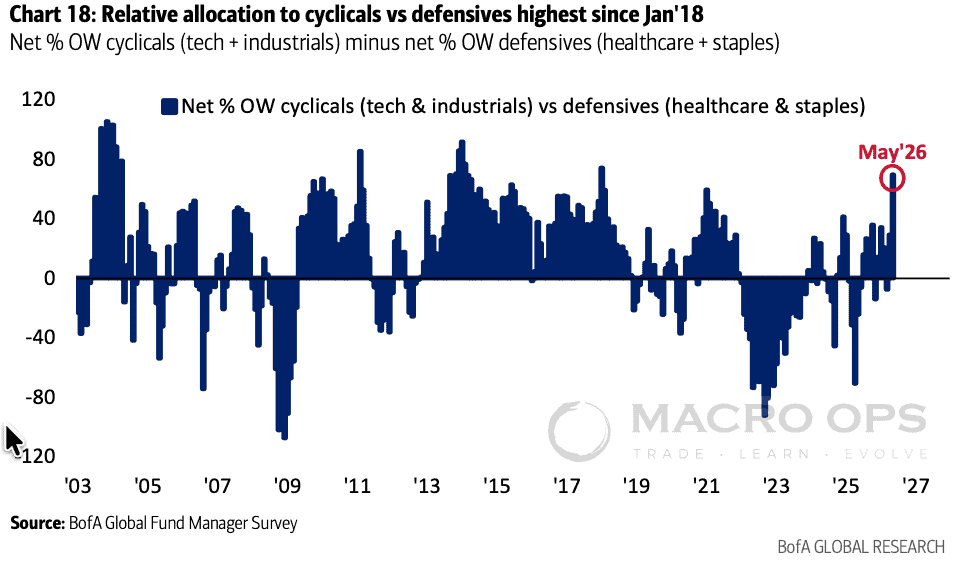
11. BofA GFS relative allocation to cyclicals (tech + industrials) versus defensives (healthcare + staples) has climbed to its highest level since Jan 18’. Time for some mean reversion in this trend?
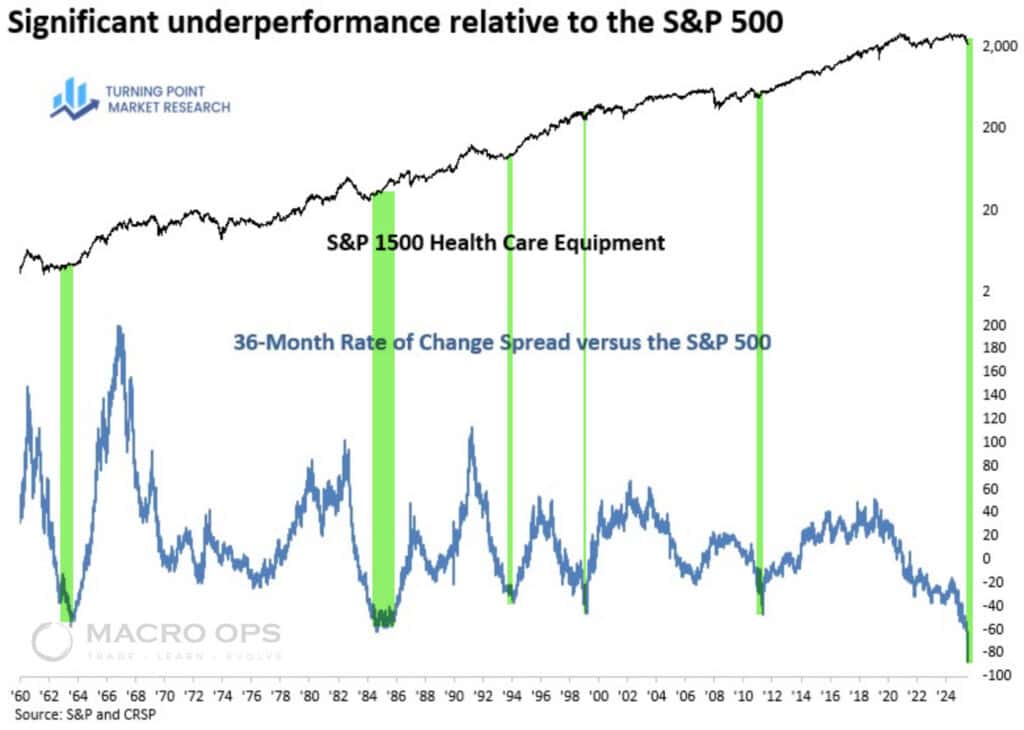
12. Healthcare Equipment — Dean’s relative performance data shows Healthcare sitting at or near all-time lows relative to the S&P. The sector is at a historically extreme oversold reading.
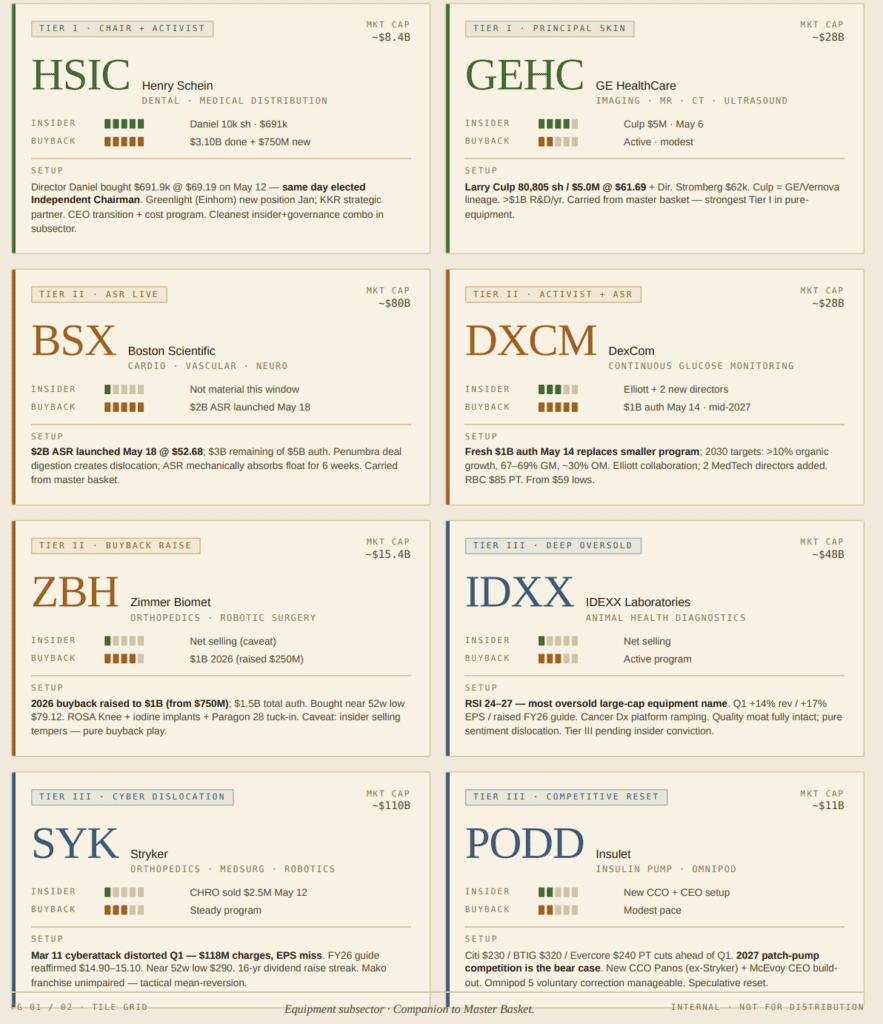
13. We have begun building a basket using three filters: (1) technical leadership off the lows, (2) meaningful share repurchase activity underway or authorized, and (3) insider buying at significant scale.
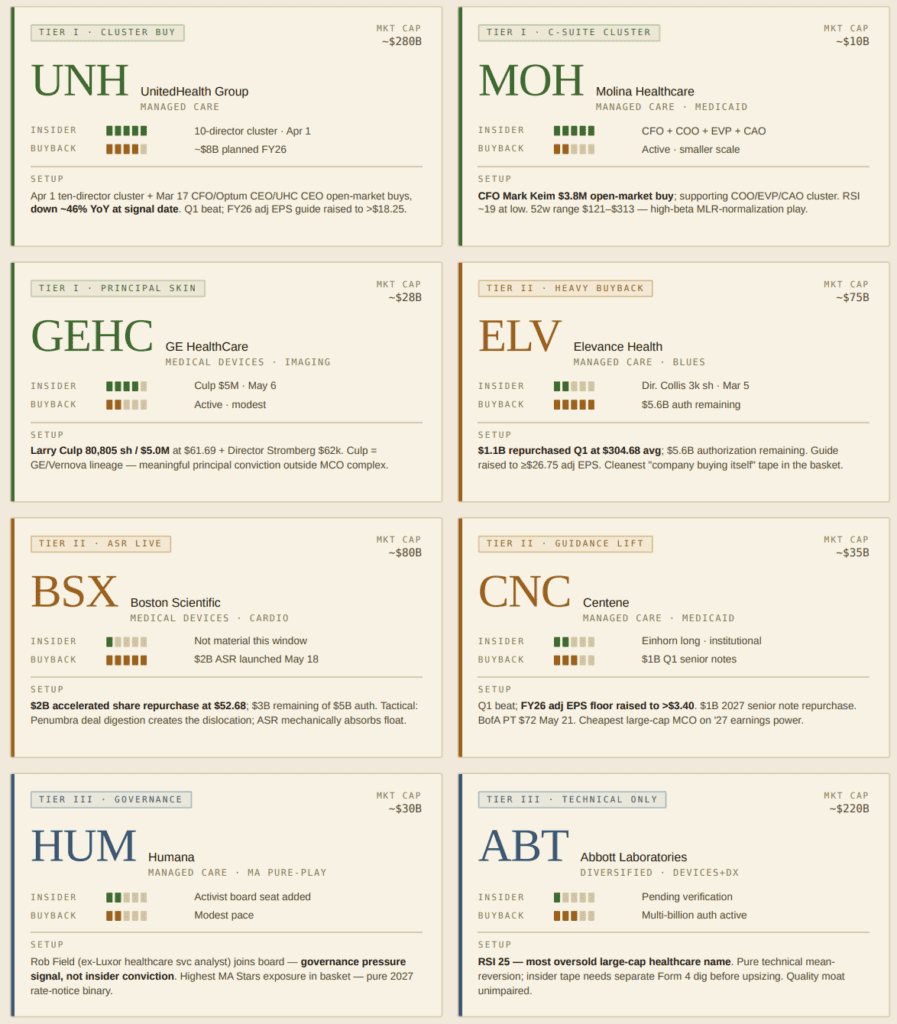
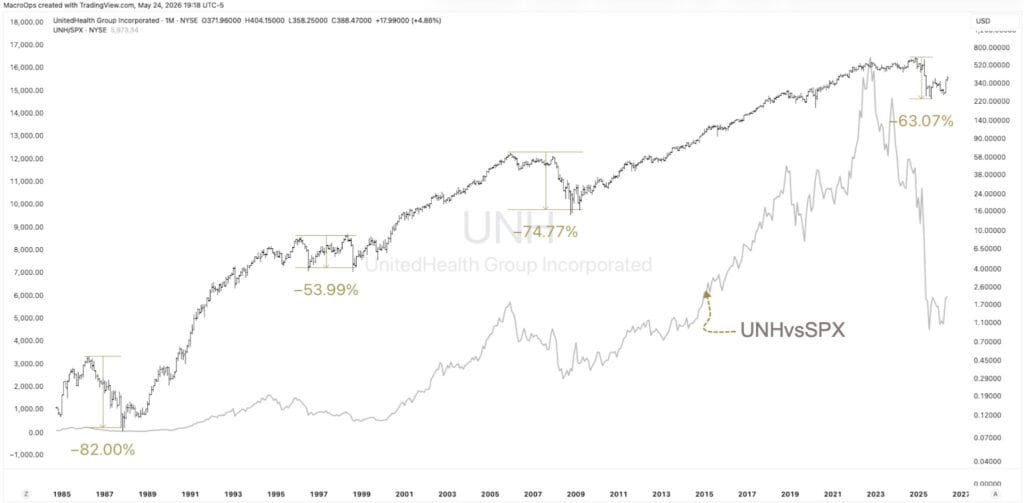
14. UNH is one name we are evaluating for inclusion. The monthly chart, including relative performance, is shown below
Thanks for reading.