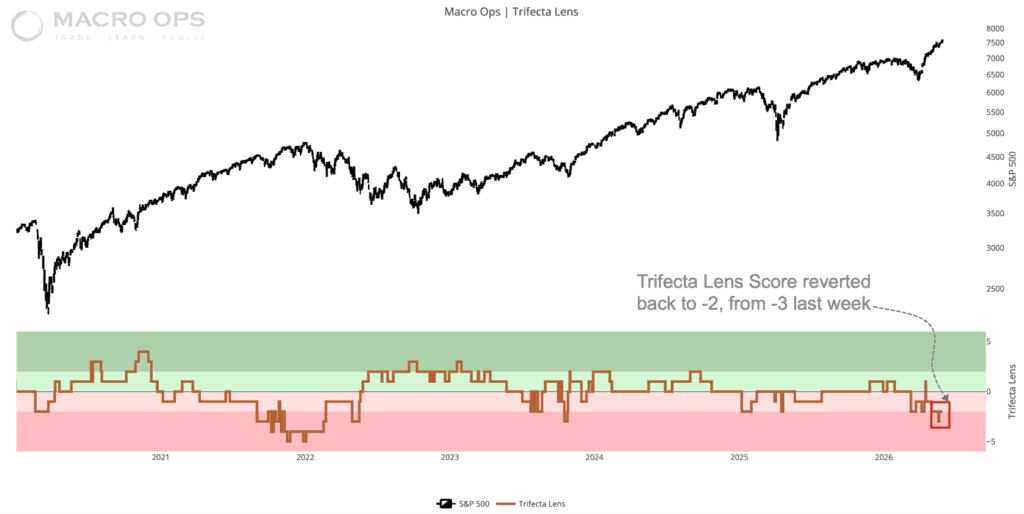
Summary: Momentum continues to favor trend continuation in the major indices. The intermediate-term BofA Bull/Bear indicator has an active sell signal, but our shorter-term Trend Fragility measure sits at 69% — neutral, and consistent with at least several more weeks of upside runway. The Trifecta Lens Score has recovered from last week’s -3 reading to -2, a neutral level. Aggregate breadth remains supportive. Yields have decelerated, though the current gamma squeeze is building conditions for a volatile unwind down the road.
One thing worth stating plainly: we are in one of the most consequential technology revolutions in history. That is not an earnings forecast or a valuation argument — it is an observation about the secular backdrop. From a Narrative Pendulum standpoint, the “singularity” narrative carries some of the most powerful trend-extension properties we’ve seen. Extended markets can get much more extended. That’s the regime we’re in.
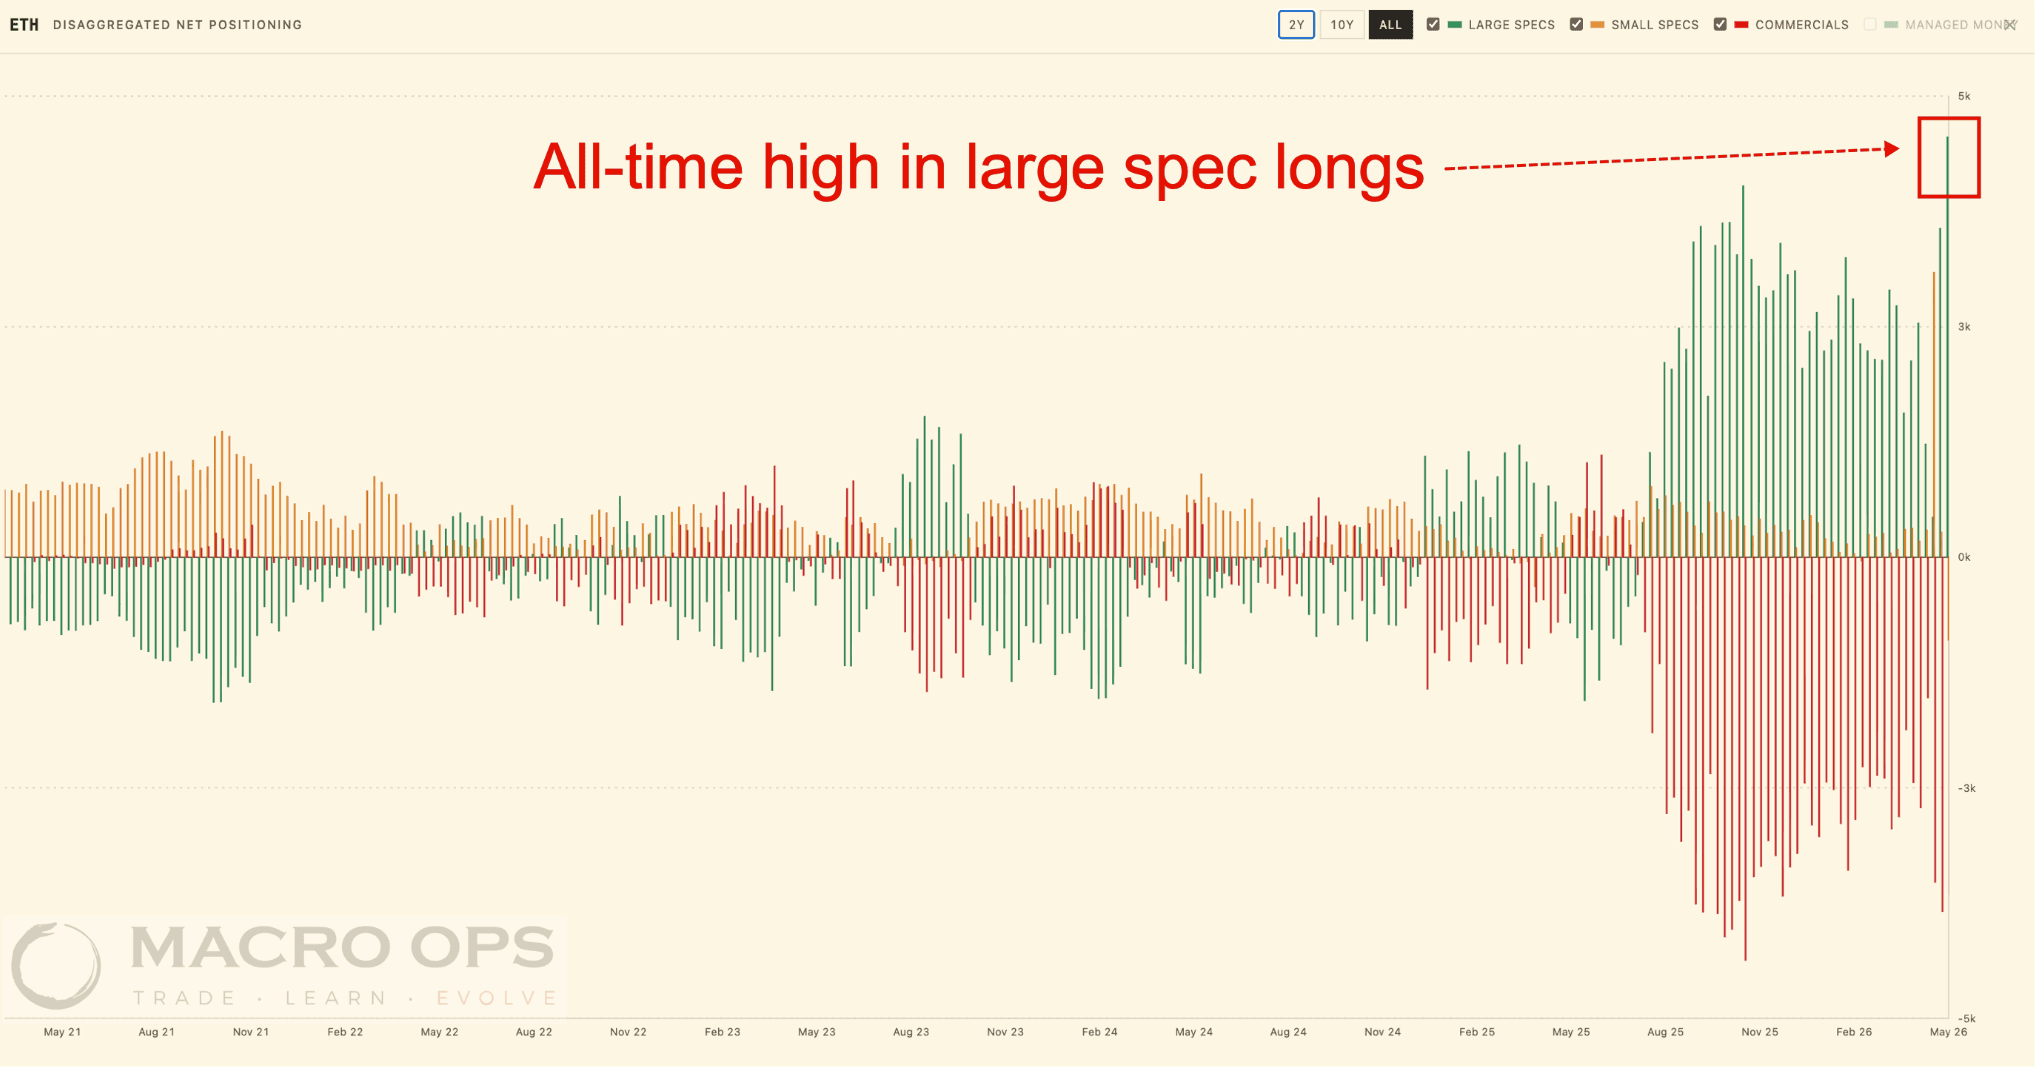
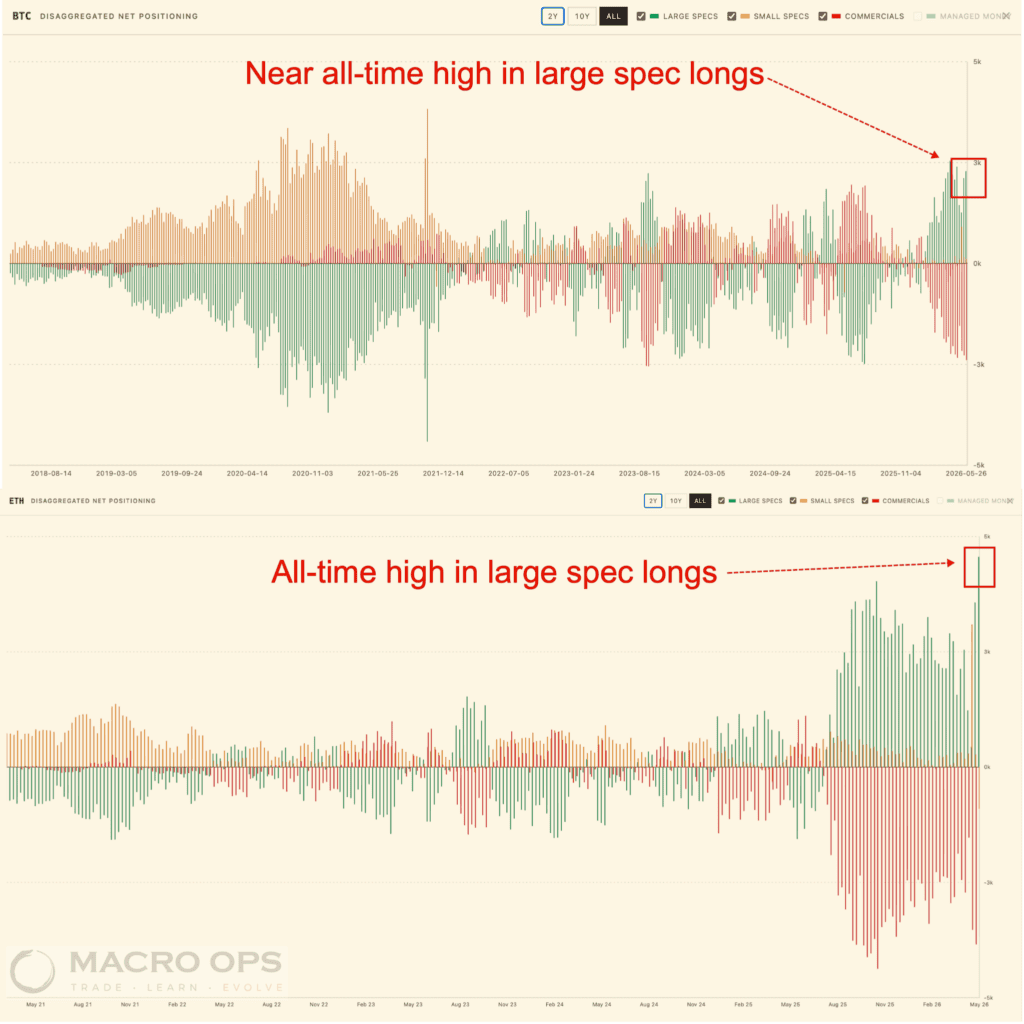
Crypto continues to lag the equity rally. Large specs have pushed long positioning in BTC and ETH to or near all-time highs, yet price isn’t catching bids with the market. That combination — crowded positioning, max downside beta — makes it a functional hedge against our long book, which is exactly how we’re using it. Bonds and DXY remain compressed and appear to be on the cusp of significant directional moves.
MO Portfolio & Trades
1. The portfolio ended last week down -172 bps, bringing year-to-date returns to +44.83%. We are now 15.7% below our YTD NAV high of +61%.
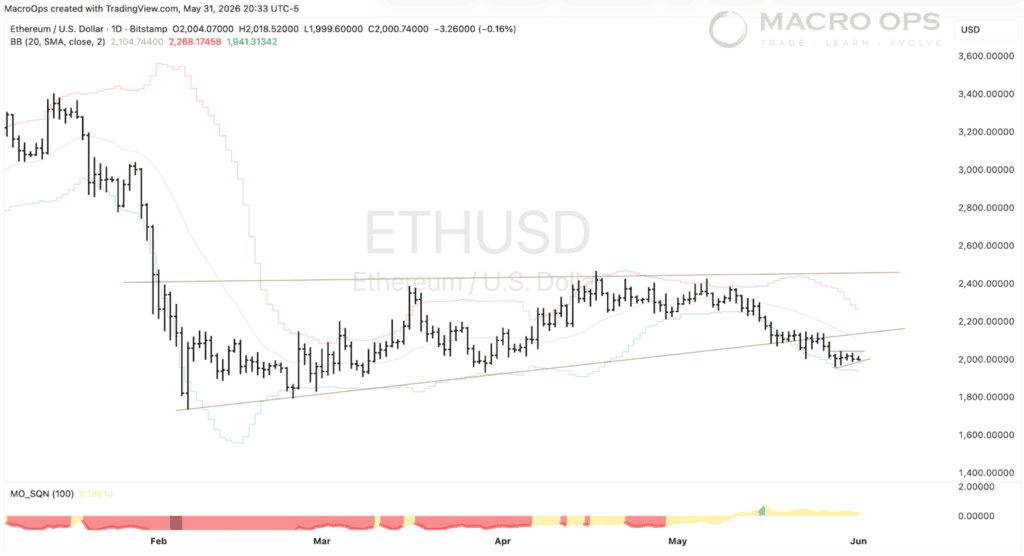
Current positioning: elevated cash, long NQ and select beaten-down software, healthcare, and cybersecurity names; short ETHUSD; long the Bloomberg Commodity ETF; long solar; a handful of idiosyncratic equity positions.
2. Large spec longs in BTC and ETH are at or near all-time highs. The crowd is fully loaded. Price isn’t keeping pace with the equity rally. It is, however, showing maximum beta to the downside — which makes it a useful hedge against the long book. That is how we’re treating it.
3. ETH daily chart below. Multiple long-term bearish setups across the crypto complex. We are short.
Trifecta Charts
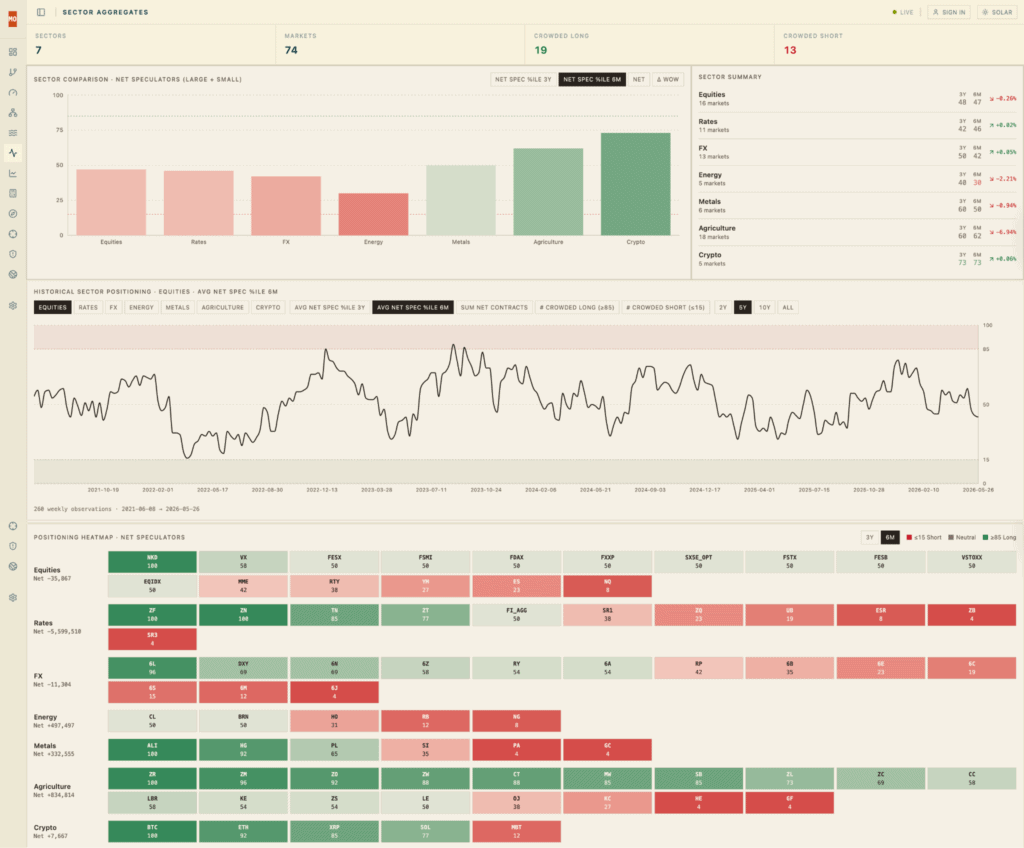
4. CoT sector positioning dashboard below.
- Most crowded longs: Nikkei, UST 5yr, UST 10yr, 6L, Aluminum, Copper, Rough Rice, Soybean Meal, Oats, BTC, ETH, XRP
- Most crowded shorts: NQ, Ultras, 6J, 6M, Natural Gas, Gold, Palladium, GF, HE
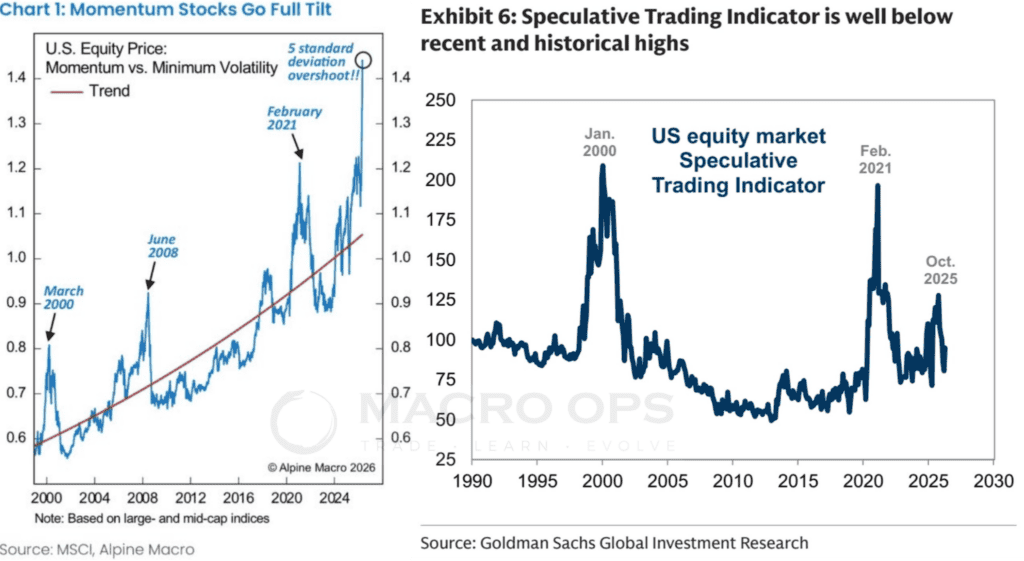
5. Two data points worth holding together: Momentum vs. Minimum Vol is running 5 standard deviations above its long-term trend, while Goldman’s US Equity Speculative Trading Indicator sits at neutral. The GS indicator tracks relative trading volumes across penny stocks, unprofitable companies, and high-EV/sales names — a composite measure of retail froth. Elevated factor spread, subdued speculative activity. That combination is worth monitoring.
Charts via AlpineMacro & GS.
6. Last week’s Trifecta Lens Score drop to -3 warranted attention but not action — the signal needed to hold at that level consistently before it carried weight. It reversed quickly to -2. Neutral. No change to posture.
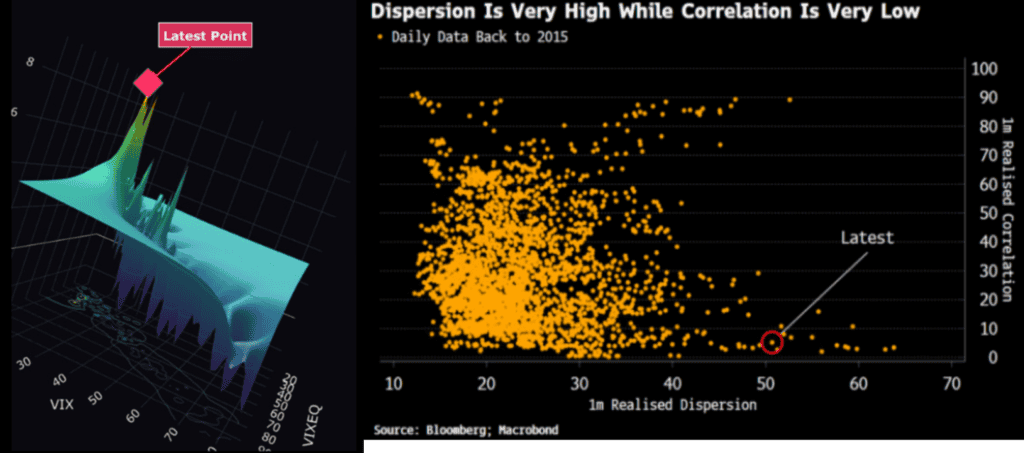
7. Bloomberg’s Simon White recently described the underlying risk structure in US equities: a gamma squeeze driven by single-stock options is holding individual vol elevated while VIX stays suppressed. It’s a rare configuration historically, and it’s sowing the conditions for a disorderly unwind when the squeeze exhausts.
Macro
8. Real personal income less transfers, measured on a 6-month annualized basis, has turned negative at -1.8%. Historically, that inflection has preceded a ~1.3 percentage point softening in 12-month payroll growth, and roughly doubles recession odds over the following year (25% to 57%).
We don’t think a recession is imminent. AI capex and fiscal deficits remain large enough to offset the signal — though the fiscal impulse is decelerating. But this is another data point confirming how unusual the current environment is. Reliable signals are misfiring. That tells you something about the regime, even if it doesn’t change the near-term outlook.
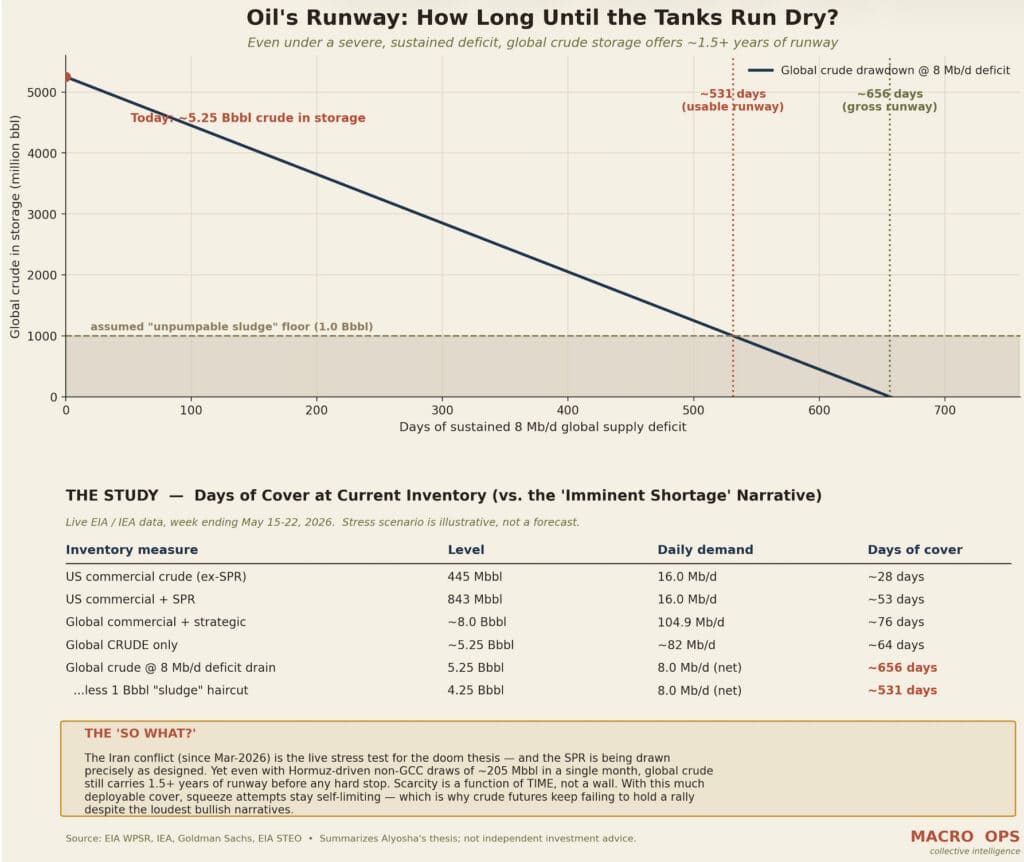
9. Alyosha’s bearish oil thesis rests on a simple premise: scarcity fears are overstated. With roughly 8 billion barrels of petroleum in global storage (~5.25B crude) and meaningful non-GCC spare capacity still available, the market has more than a year of runway even under a severe supply deficit. In his framing, squeeze attempts remain self-limiting — and crude can’t hold a rally because the cushion is larger than the bulls believe.
The bull case argues the opposite: that much of that storage is functionally unusable (tank bottoms, line-fill), that SPR depletion has removed a real buffer, and that the live Iran/Hormuz risk compounds the tightness. Alyosha’s counter is that unusable-barrel claims are overstated, the SPR release is largely term-lending already priced on the curve, and scarcity is a function of time rather than a hard wall.
Note: this summarizes his view, not an endorsement. The assumptions are stylized. Recent price action, however, appears to be voting in his direction. Below is a chart we made to illustrate his point.
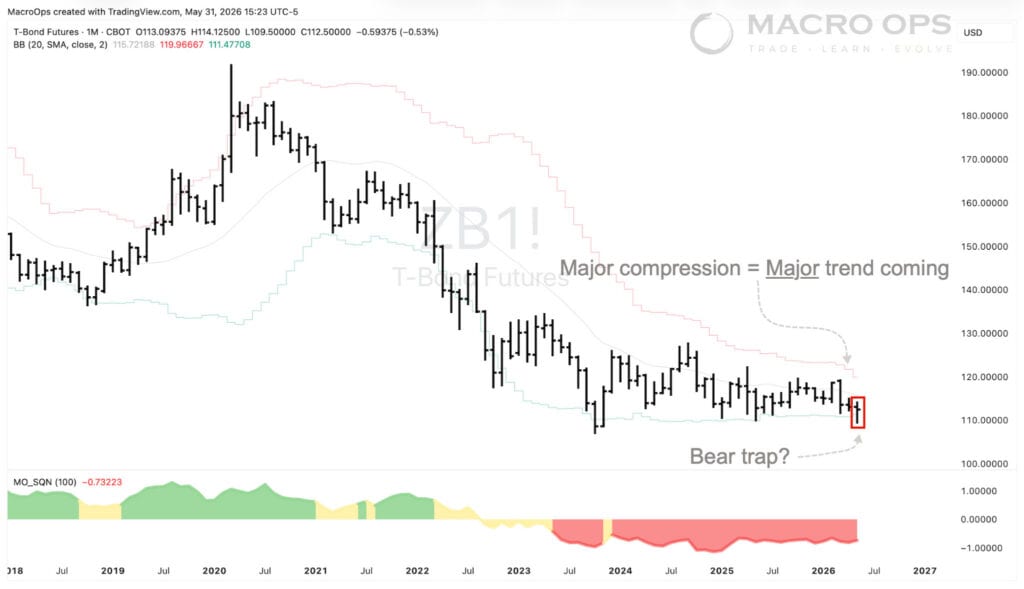
10. Bonds remain the fulcrum for everything else in macro right now. Our bias is that long bonds break lower. However, the May bar is shaping up as a failed breakdown — which doesn’t change the bias, but does demand patience and flexibility. Nothing to do here except stay attentive and let the tape tell us what’s next.
Trade Setups / Topical Charts
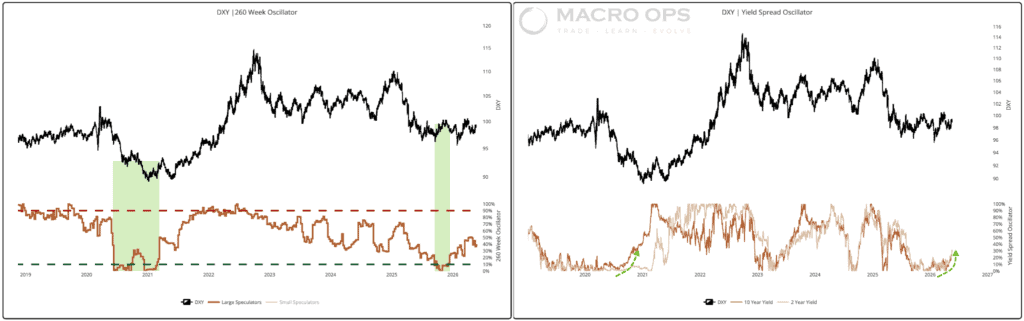
11. DXY continues to coil in a 12-month-plus range. The long-term bias is lower — a 3-to-5-year secular move driven by the reversal of capital flows out of Core and back toward the Periphery as US exceptionalism gets re-rated.
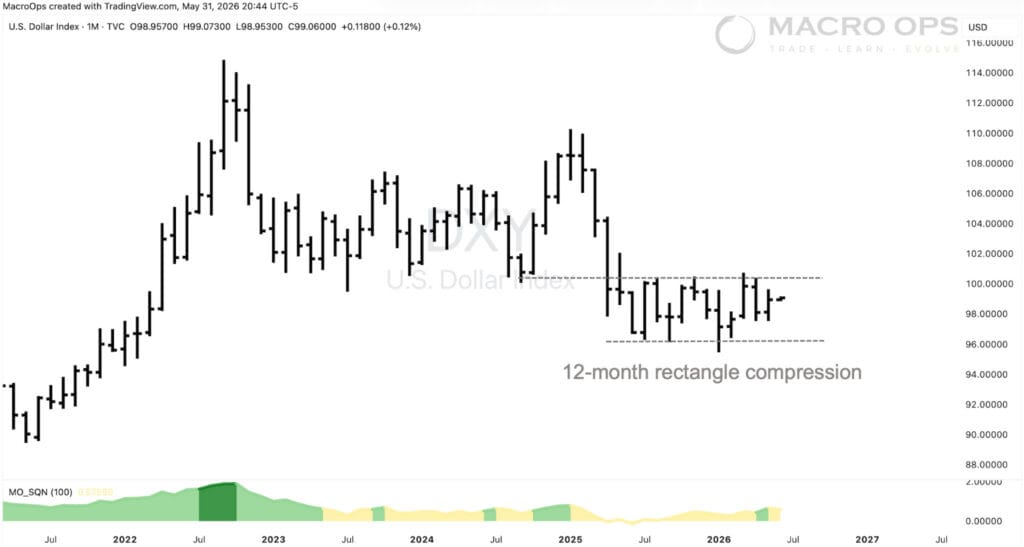
12. That said, a number of conditions are aligning that mirror the setup preceding the early ’21 DXY breakout. Our Large Spec 3-Year Oscillator is coming off a bearish consensus hit — same as early ’21. DXY yield spread momentum is accelerating in the dollar’s favor — same as early ’21. Relative US equity outperformance is positive. Relative USvsRoW growth is accelerating, driven by the AI trade. And the US is meaningfully insulated from rising energy costs via Strait of Hormuz (SoH) closure risk in ways that most of the world is not.
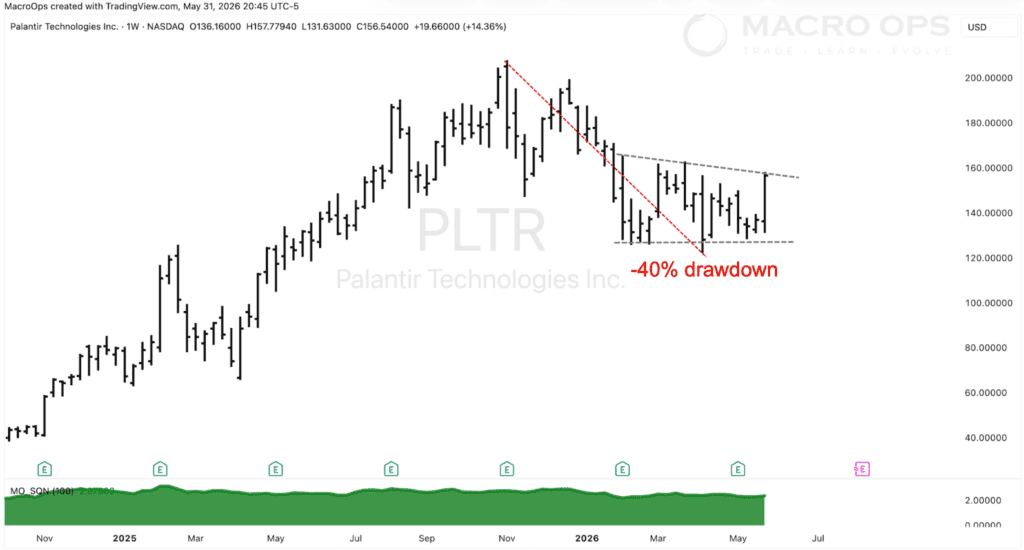
13. Defense appears to have finished correcting. PLTR sits at the intersection of AI and defense — two of the most durable secular themes in the current environment. The weekly chart looks constructive. New highs look to be on the horizon.
Thanks for reading.