It is important to see distant things as if they were close and to take a distanced view of close things.
~ Miyamoto Musashi, The Book of Five Rings [1645CE]
Good morning!
In this week’s Dirty Dozen [CHART PACK] we look at the trend in global PMIs and what that’s meant for sector returns going forward, plus we look at falling oil demand and dropping rig counts, and end with a look at some lending data and a coiling high carry FX trade. Here we go…
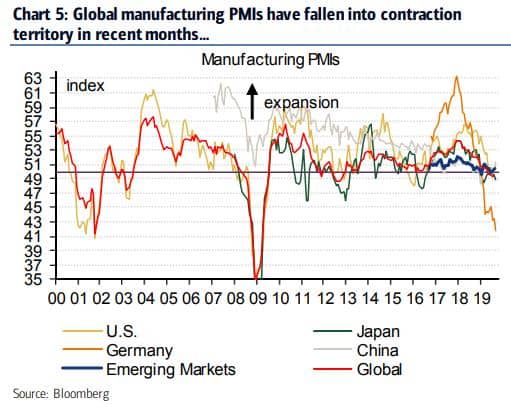
- Global manufacturing PMIs have fallen into contraction territory in recent months, with DM markets leading the way (chart via BofAML).
- This heatmap of global manufacturing PMI levels and their 3-month changes gives a more under the hood look at the deterioration in growth globally (charts via MS).
![]()
![]()
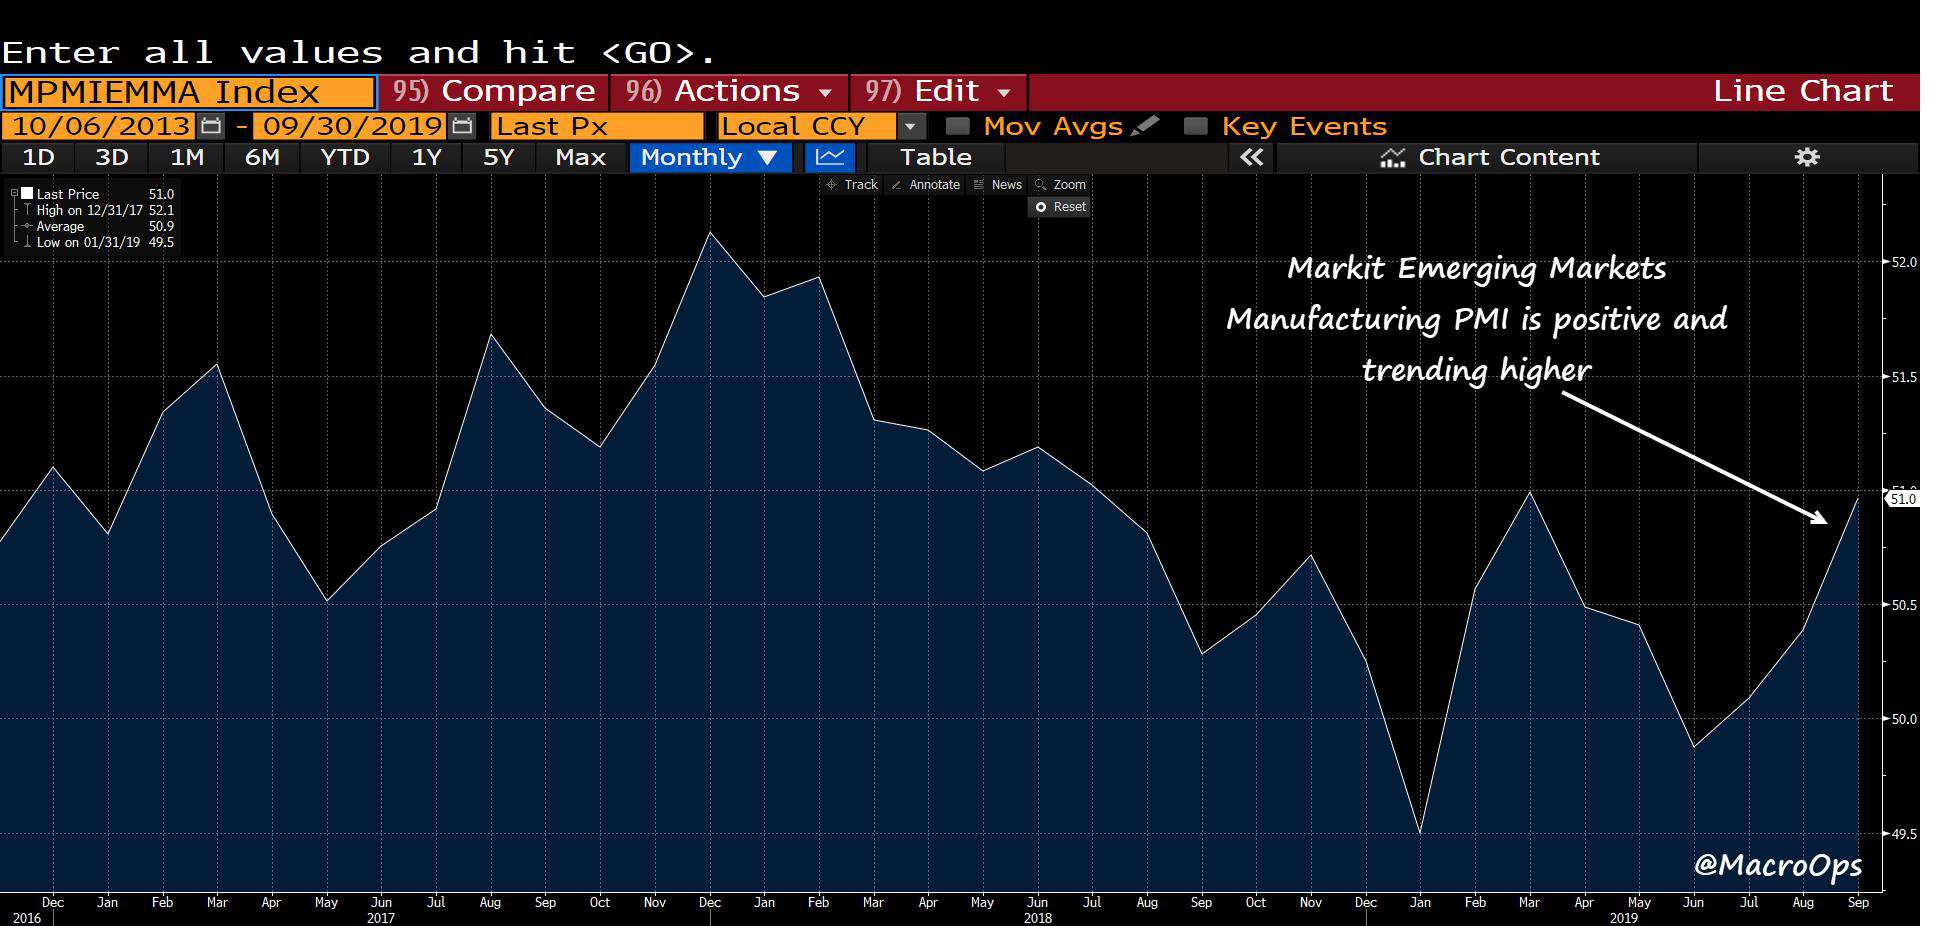
- One interesting standout though is emerging markets where growth seems to have potentially bottomed and is now rebounding. The chart below is of IHS Markit’s emerging markets manufacturing PMI which hit 51 last month.
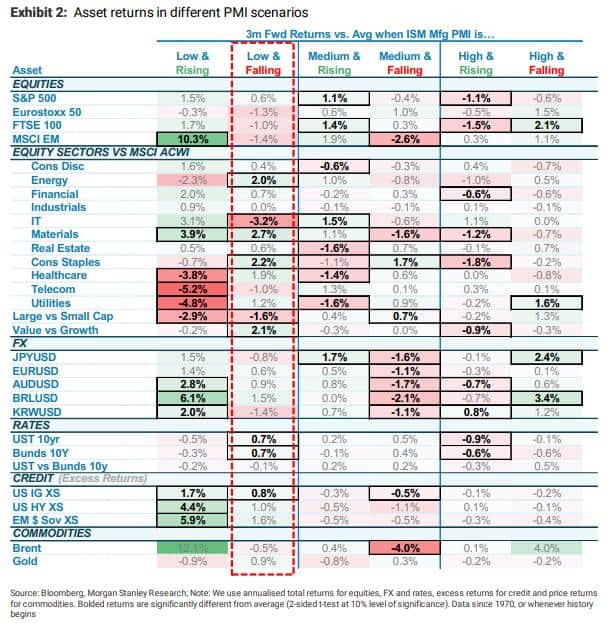
- The market’s forward returns have a high correlation to the trend in ISM manufacturing PMI. The graph below from MS shows how various assets have performed along certain points in the PMI sine curve. In the current environment, where the PMI is low and falling, value tends to outperform growth; with energy, materials, and consumer staples leading the way.
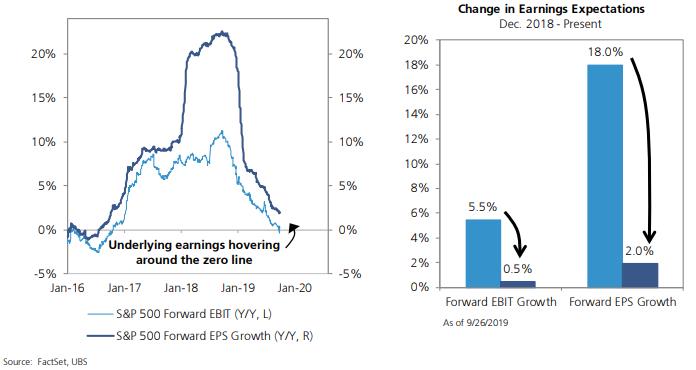
- The deteriorating global growth backdrop has led to a huge revision in expectations since the beginning of the year. The consensus is now expecting 0.5% EBIT growth and just 2% growth in earnings per share for the year (chart via UBS).
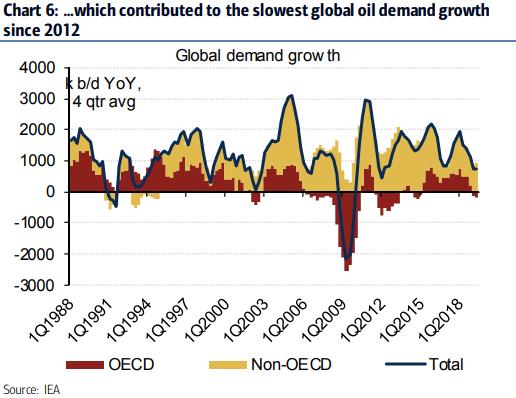
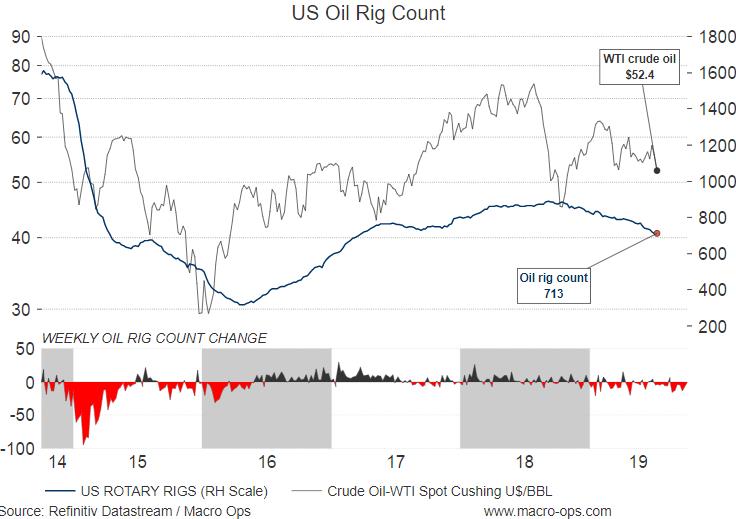
- This slowdown has led to the lowest YoY% growth in global oil demand since 2012 (chart via BofAML).
- Lower oil prices are leading to a drop in rigs. I wonder if the energy sector has finally had its come-to-Jesus-moment. Maybe this time they’ll maintain capital discipline should we see another bounce in prices following this rout— once bitten, twice shy perhaps?
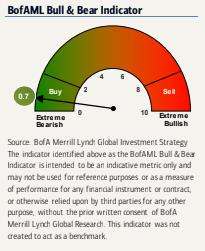
- Our Put/Call moving average indicator that we talked about last week triggered an official buy signal shortly after. My expectations are for further chop over the coming week before another leg down to wring out the last of the bulls. But we have things like BofA’s Bull & Bear indicator showing extreme bearishness and strong price action in semis, so there’s a chance the market goes on a bit of a run here.
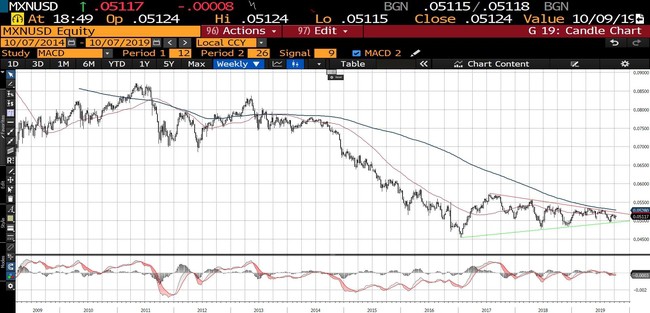
- I’ve discussed the peso (MXN) a number of times in these pages over the last few months. It’s the highest yielding major currency out there that also happens to have the lowest forecasted spot returns (read: bearish consensus). I love the chart. It looks like a classic bottoming pattern to me + the MEXBOL looks like it’s put in a bottom after a 2-year bear market. Keep an eye on this one…


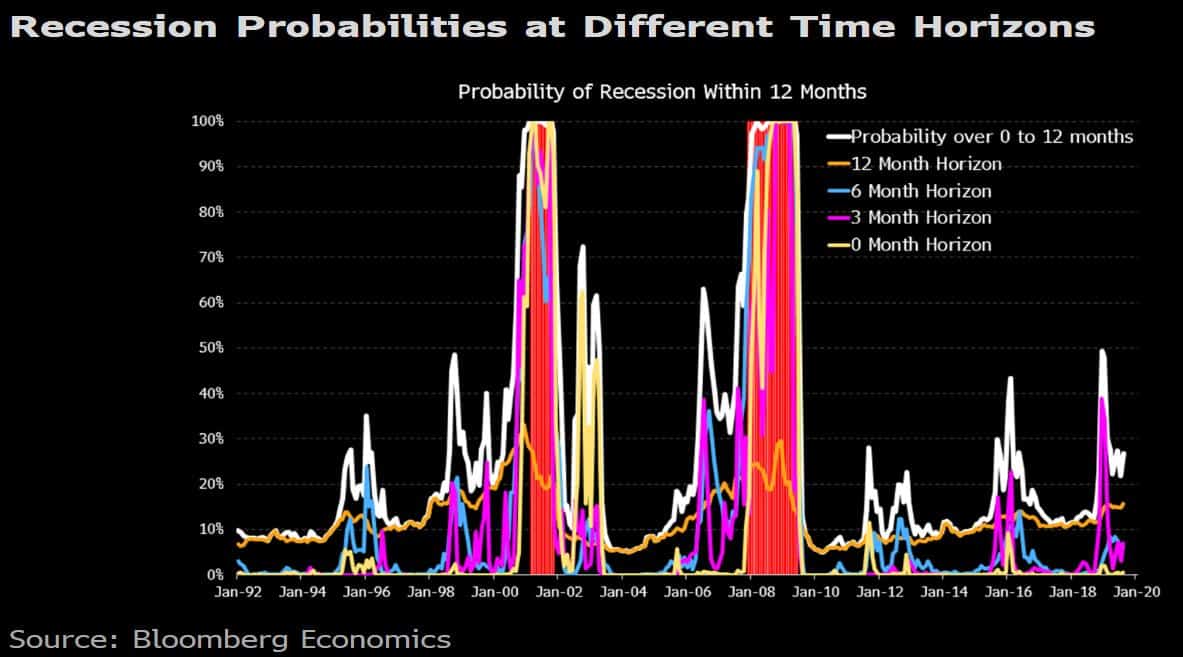
- Bloomberg Economic’s new recession probability model is giving just a 16% probability of the US heading into recession over the coming 12-months. The model incorporates “a range of financial market indicators, activity data, and measures of background imbalances.”
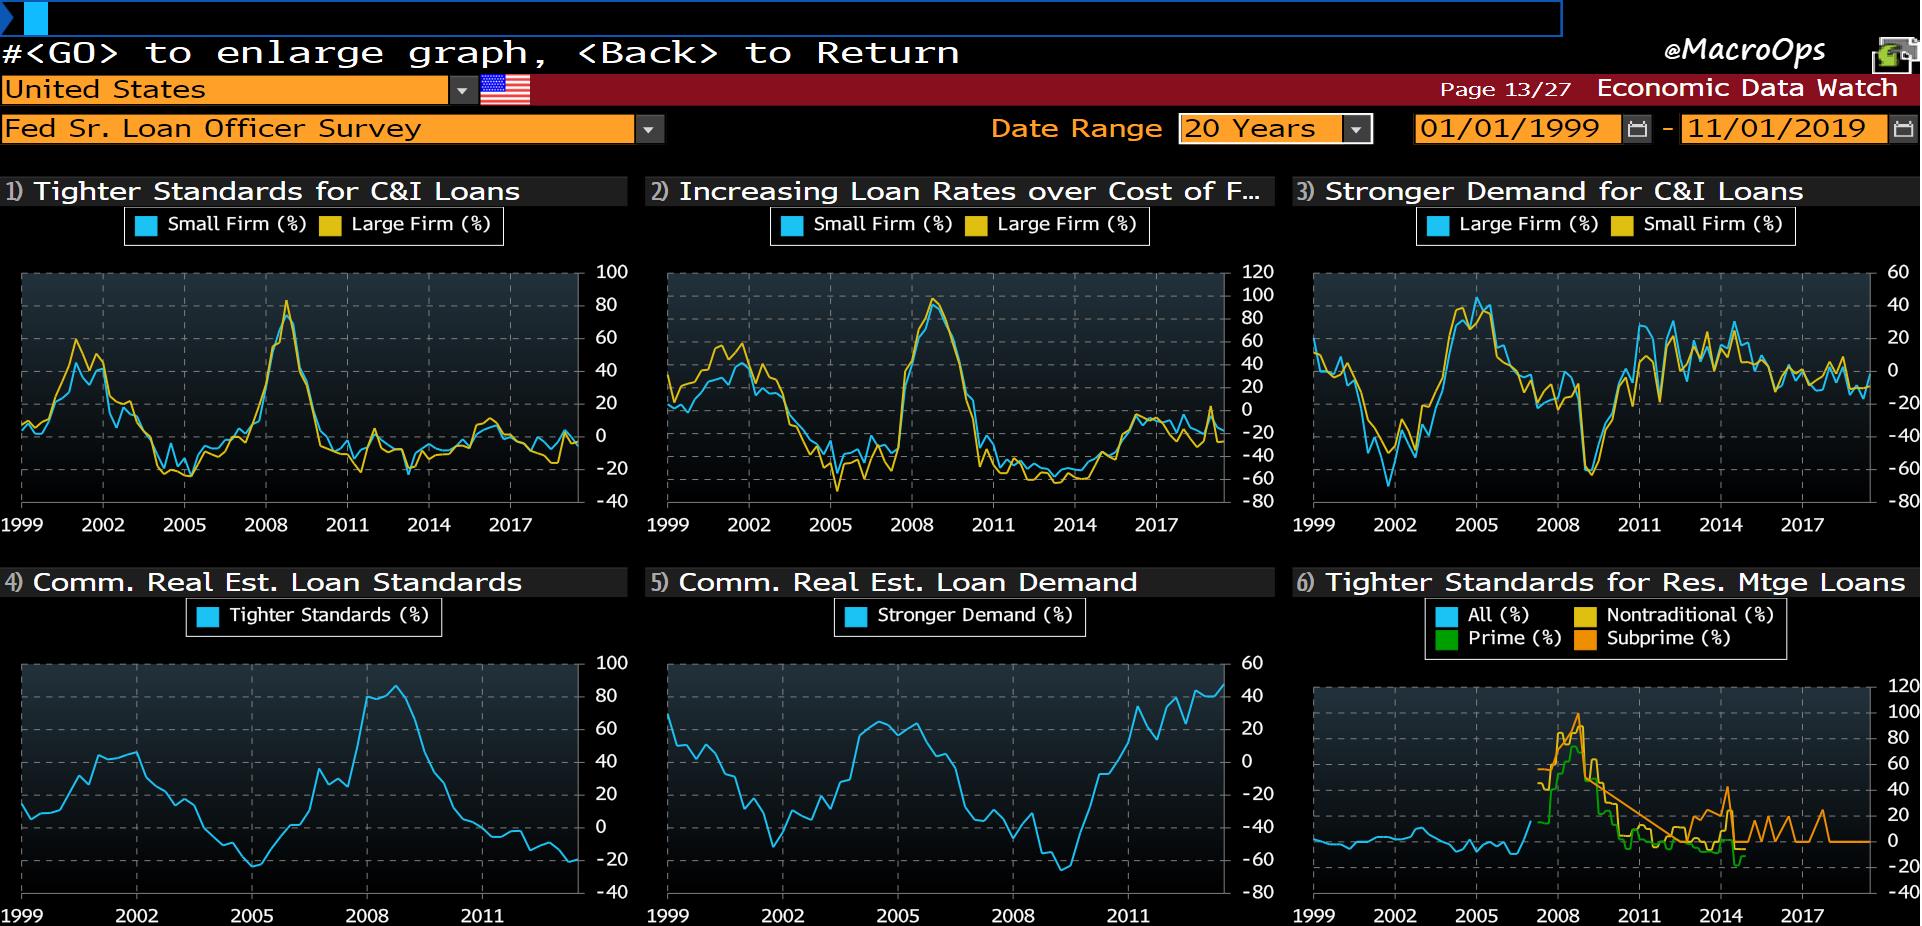
- Speaking of recession, some of the lesser-known data that I like to regularly check up on is that from the Fed’s Senior Loan Officer Survey (aka SLO data). It gives you some good insight into the lending market which is important since our economy lives or dies on the supply and demand of credit. And as of right now, there’s little in the SLO data to suggest much cause for alarm.
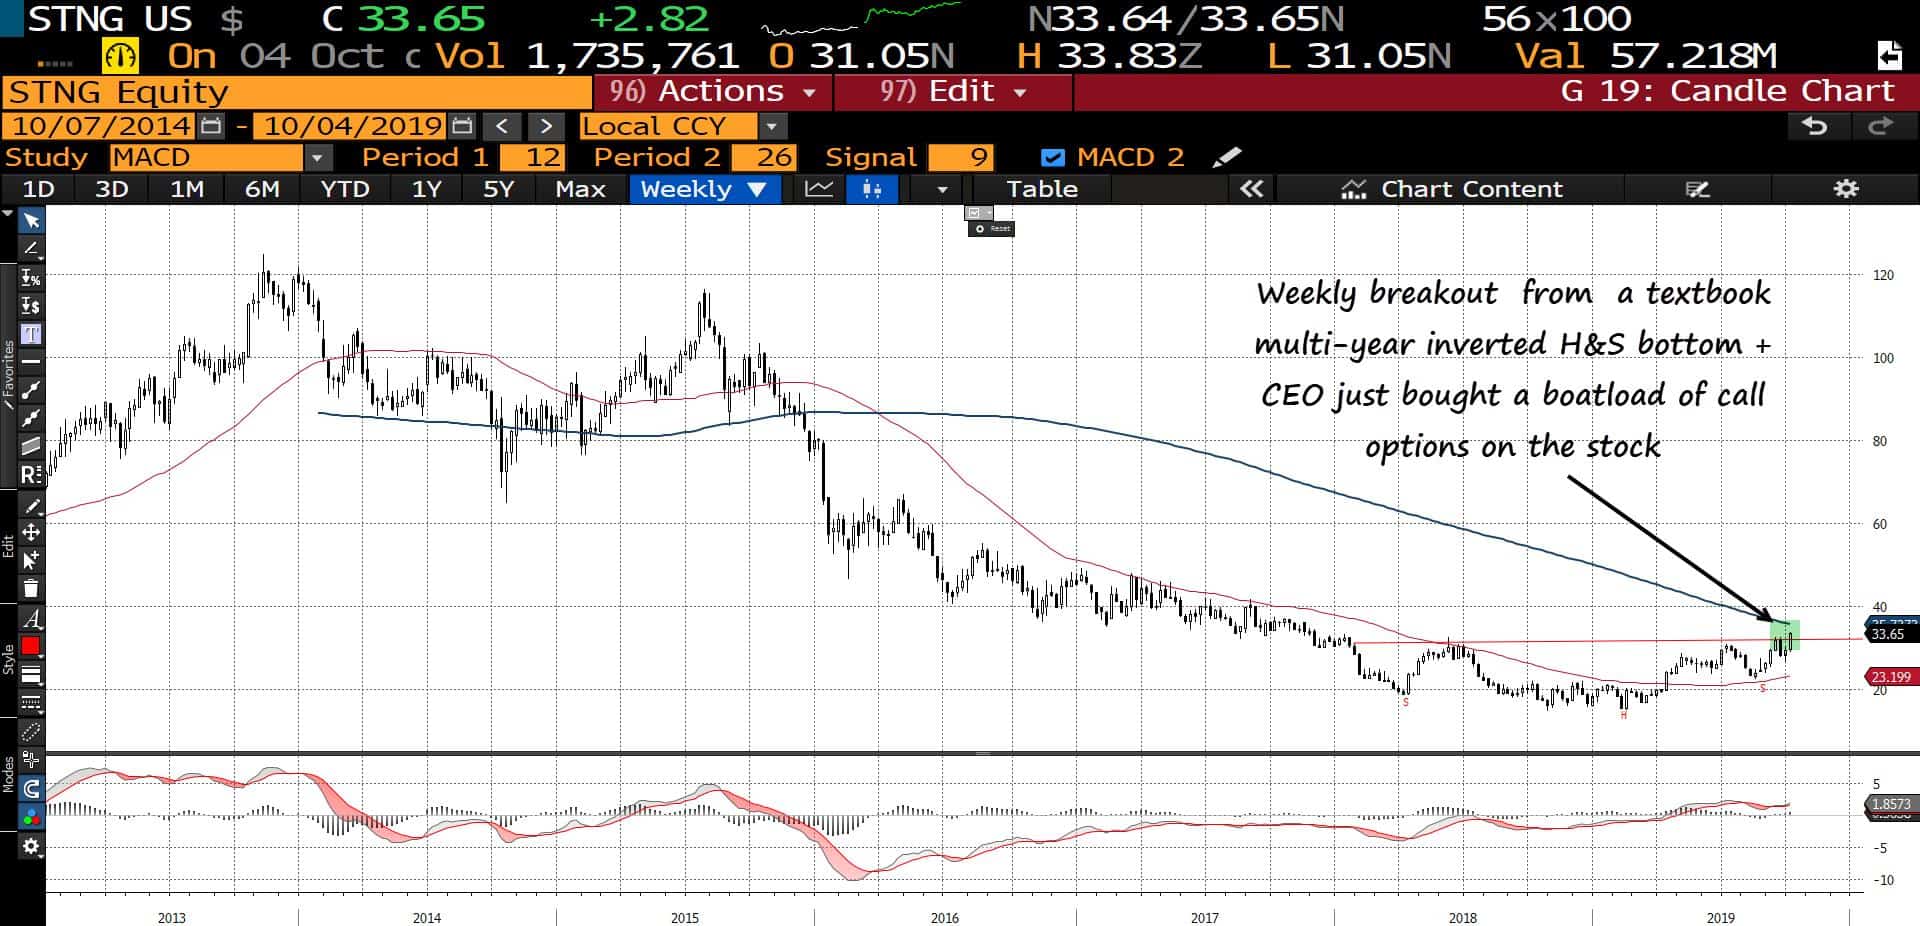
- I think I shared this chart not too long ago but I’m doing it again because it’s such a great technical setup — the macro and fundamental backdrop also happens to be incredible. It’s a weekly chart of Scorpio Tankers (STNG), a shipping stock and also my largest holding. It broke out of a multi-year inverted H&S bottom last week. You can read my bull thesis on shipping here.