The following is an excerpt from our monthly Macro Intelligence Report (MIR). If you’re interested in learning more about the MIR, click here.
Some investors, desperate for better yield, have been reaching not for a new Wall Street product but for a very old one–common stocks. Finding the yield on cash unacceptably low, people who have invested conservatively for years are beginning to throw money into stocks, despite the obvious high valuation of the market, its historically low dividend yield and the serious economic downturn currently under way.
How many times have we heard in recent months that stocks have always outperformed bonds in the long run? Funny, but we never hear that argument at market bottoms. In my view, it is only a matter of time before today’s yield pigs are led to the slaughter house. The shares of good companies and bad companies alike are vulnerable to sharp declines. Moreover, many junk bonds that have rallied will tumble again, and a number of today’s investment-grade issues will be downgraded to junk status if the economy doesn’t begin to recover soon.
What if you depend on a higher return on your money and can’t live on the income from 4% interest rates? In that case, I would advise people to ignore conventional wisdom and consume some principal for a while, if necessary, rather than to reach for yield and incur the risk of major capital loss. Stick to short-term U.S. government securities, federally insured bank CDs, or money market funds that hold only U.S. government securities. Better to end the year with 98% of your principal intact than to risk your capital roofing around for incremental yield that is simply not attainable.
I would also counsel conservative income-oriented investors to get out of most stocks and bonds now, while the gettin is good. Caution has not been a profitable investment tactic for a long time now. I strongly believe it is about to make a comeback.
The above is from a Forbes article written by legendary value investor and hedge fund manager Seth Klarman.
In the article, Klarman excoriates common investors for being “yield pigs” blindly piling into common stock. Low yields having driven them into a frenzy for return… as they hoof their way to the slaughterhouse to be ground into some expensive breakfast sausage.
Hopefully some of you more astute readers caught this line, “What if you depend on a higher return on your money and can’t live on the income from 4% interest rates?”.
4% rates isn’t a typo. This article sounds like it could’ve been written today (it’s actually a lot more applicable now), but Klarman wrote it all the way back in 92’.
Klarman made some good points. Back in 92’ stocks were overvalued on a historical basis and investors were chasing yield.
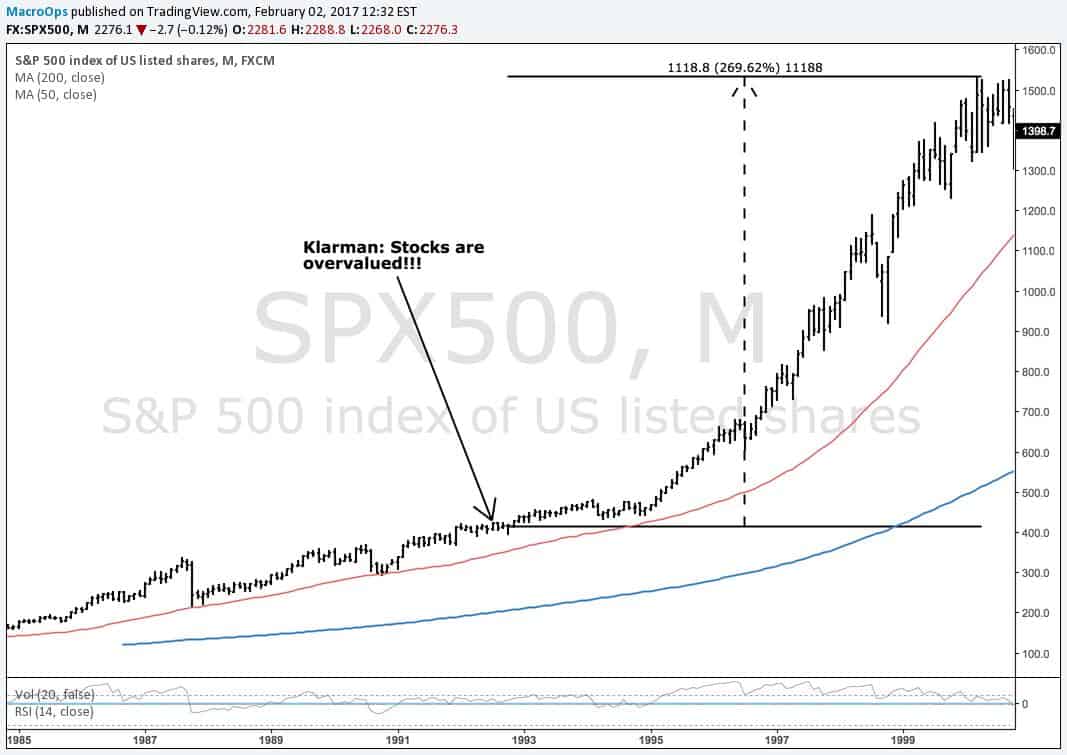
What Klarman got wrong was the timing… he was 8 years too early to be exact.
The “yield pigs” got to enjoy a 269% return in the S&P and a not too shabby 840+% run in the Nasdaq before they were led to the “slaughterhouse”.
Not to pick on Klarman — despite his error in 92’ he’s managed to do just fine (massive understatement) — but he fell victim to a common misunderstanding of how to assess valuations and future returns from a macro perspective.
At this point you may be thinking to yourself, “Jesus, Alex… just how full of yourself are you to think that you can teach Seth Klarman something about valuation?”
Yeah, yeah. I get it. That’s a more than reasonable response and I wouldn’t blame you if you’re somewhat skeptical of my sanity (you’re hardly alone). But just hear me out. Keep an open mind and come to your own conclusions.
What I’m going to show you is that valuations matter a lot but not in the way that most people use them. To do this, we’ll discuss the following theory that’s central to how we at Macro Ops determine macro valuations:
- Relativity Theory: Valuations can’t be looked at in a vacuum but only relative to other asset classes
Afterwards, we’ll look at where relative valuations are today and how we want to be positioned going forward.
Back in 1992…
Let’s start at the beginning and go back in time to 1992 when Seth Klarman warned readers about the impending “stock market disaster”.
It was a contentious presidential election year between the incumbent George H.W. Bush and his opponent Bill Clinton.
The US military had ended the Gulf war a year earlier and the economy had just come out of a mild recession in the middle of 91’.
US GDP growth was hovering around 4%. Inflation was at just over 3% and the 10-year was yielding a whopping 7.25%. (Can you imagine getting over 7% on a government bond? Must have been nice.)
If one were to open the NYT they would see articles such as:
- MARKET WATCH; A Clinton Win: Good for Stocks, Bad for Bonds?
- Next It May Be Economy Up, Stocks Down
- Stocks Surge, And Wall Street Is Surprised
Newspapers were filled with concerns over stock market valuations, debt levels, a coming boost in fiscal stimulus driving up inflation, and political risks from a new presidential administration. Just a lot of dour pessimistic views on the economy in general — sounds somewhat familiar, huh?
The S&P had a PE ratio of 25.93 (today it’s at 25.56) and a cyclically-adjusted price-earnings (CAPE) ratio of 19 (today it’s 28).
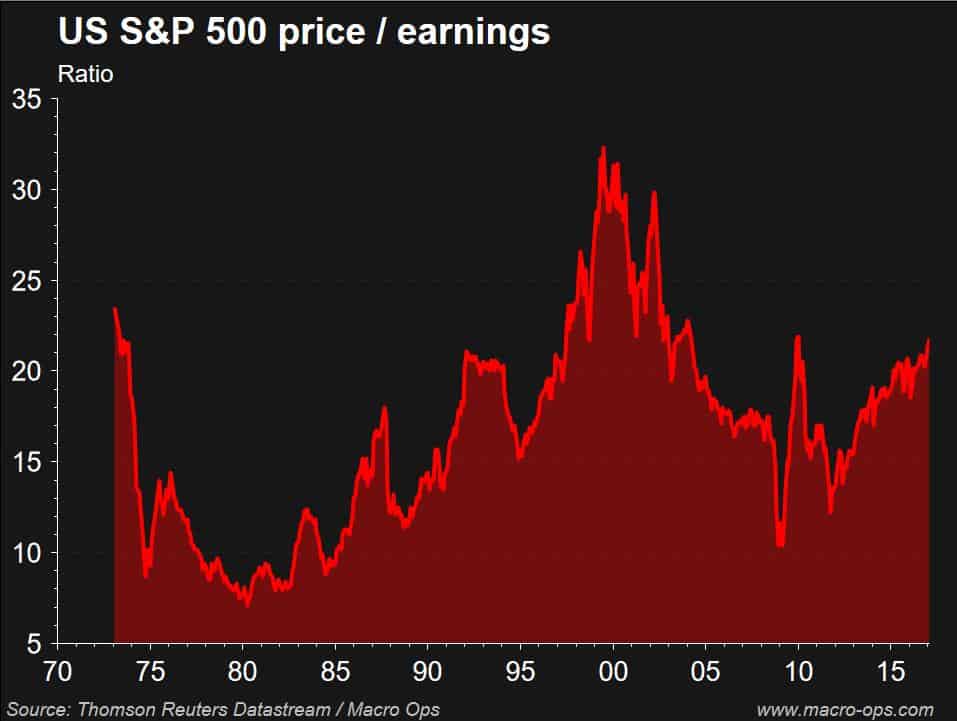
Valuations were high (average historical PE is 15 and CAPE is 16), debt levels were high, we’d just come out of a war, and like today there were a lot of things to be worried about.
Under these circumstances it was very reasonable to be if not bearish, then at least pragmatic about future stock market returns.
Seth Klarman probably sounded pretty smart and responsible admonishing those yield chasing pigs who were destined to pay for their investing gluttony.
And yet… 92’ happened to mark the very beginning of the longest economic expansion and greatest equity bull market in US history — one that would last for 3,452 days…
The S&P’s CAPE went from 19 to a high of 44 and its price-to-earnings climbed from 25 to the nosebleed levels of 34 (and those pale in comparison to the multiples on the Nasdaq which were at 175).
So why did this happen?
How were extremely talented value investors like Klarman and Buffet left sidelined and befuddled by market valuations that seemed to go from stupid to “you gotta be kidding me” levels?
The most common explanation comes from nobel laureate economist Robert Shiller — the market entered a period of “irrational exuberance”. Basically… we all lost our marbles and entered a collective hysteria culminating in a massive stock buying orgy.
Okay, that’s kinda like what ole’ Keynes said about how the market can stay irrational longer than the investor can stay solvent.
Now it’s true our animal spirits may certainly account for some of the 90’s bull market, especially the latter part. But it can’t account for the first half where market skepticism was prevalent and investors were far from exuberant.
To solve this puzzle, let’s unpack valuation multiples real quick. Since the price/earnings (PE) ratio is the most commonly used, we’ll deal with that, though what we’re going to talk about applies to all valuation multiples.
The PE ratio has just two variables: price, which is the numerator, and earnings per share, which is the denominator. The valuation multiple is comprised of the ratio of the price paid for an amount of earnings, or price divided by earnings.
So there are two ways to affect the PE multiple (1) adjust the price paid up or down or (2) grow or shrink the amount of earnings. Higher earnings, all else equal, means a declining PE multiple and vice-versa.
Basic stuff.
Well we know that earnings are driven by the business cycle and the resulting profit margin expansion/contraction. But what really drives the change in valuation multiples is the numerator; the price investors are willing to pay for a certain amount of earnings.
The common misperception is that this “price” is determined solely by investor risk appetite and expectations for future growth. If that were true, then why were stock multiples so high in 92’? And why did they continue to scream higher when there were so many logical reasons to be bearish?
The answer is the Relative Risk-Premium Spread (RRPS).
Here’s a quick explanation of RRPS:
- The cyclic nature of markets and the economy is transmitted through financial spreads, beginning with the cost of money. The central bank controls the cost of money; in which EVERYTHING is valued off of. The relative changes over time to the cost of money transmit through these financial spreads, creating large bull and bear markets in different assets. Nothing is valued in a vacuum. Everything is relative and reflexive.
- Spreads start with the cost of money. The next spread up is the closest asset in terms of risk/return (ie, short dated treasuries). After that comes longer dated treasuries. And then you get investment grade corporates.Then there’s high-yield and finally, equities. It could look something like this:
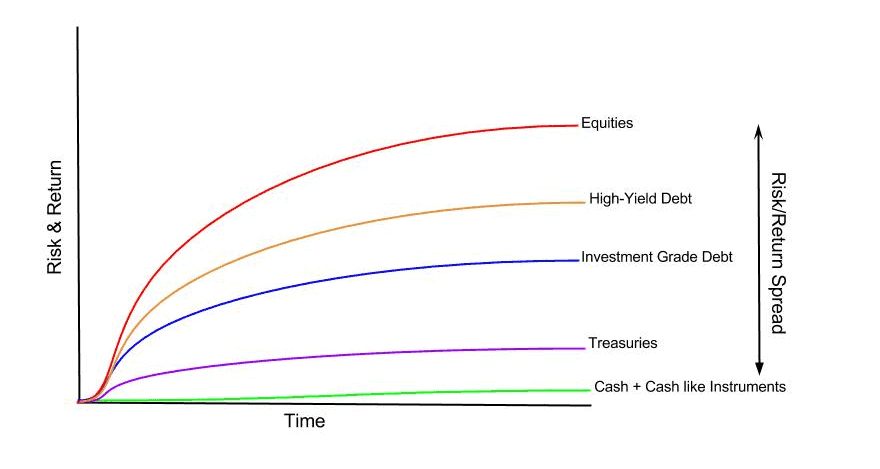
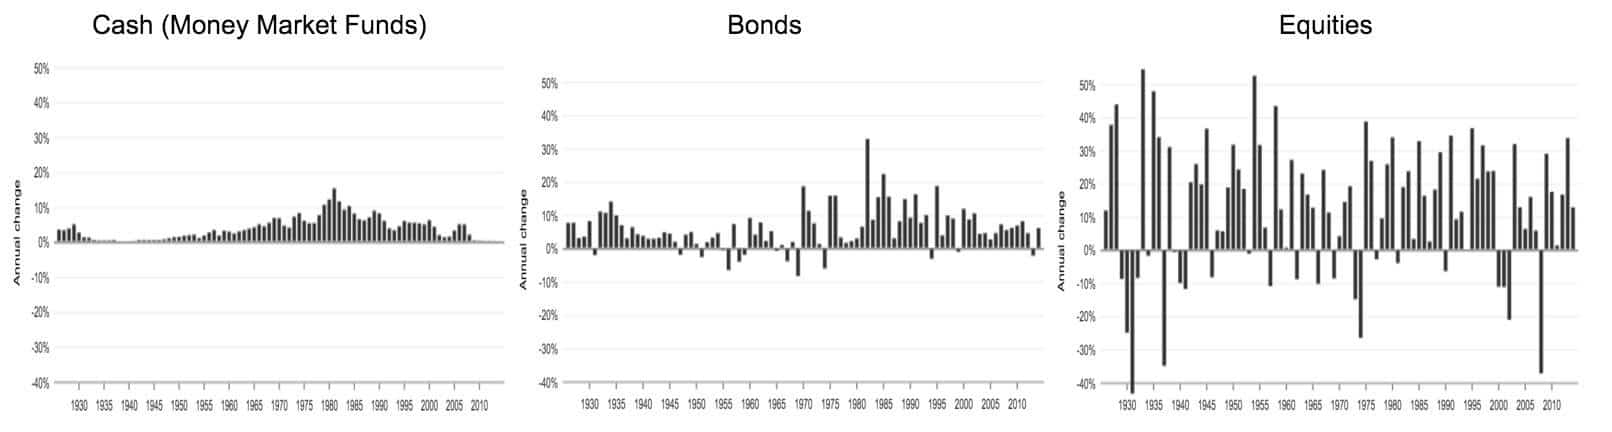
- The difference (spread) between all of these assets is called risk premia. Risk premia is the risk (volatility) and average return function of each asset. The asset classes with lower risk premia (ie, higher on the capital structure and less volatile) offer a lower average return. While assets like equities, which have much higher volatility and payout a higher average return over time, have a higher risk premia. Here’s a little snapshot that shows this volatility/return relationship of the big three asset classes over the last 80 years.
- Risk premia exists because people need to be compensated for lending their money (exchanging cash for stock) and assuming risk. Or else why the hell would anybody change their fungible safe dollars for a more illiquid and risky asset? They wouldn’t. It would be illogical.
It all starts with the Fed’s policy tools. The overnight rate, open market operations, and reserve requirements are the tools the Fed uses to set the cost of money.
When they lower the cost of money, it transmits through the yield curve of treasury bonds, bringing down both the short and long end — pulling the premia of cash + cash like instruments and bonds lower. As bonds get pulled lower the spread between them and stocks widen. The larger risk premia means that investors get compensated more for assuming risk relative to that of cash and bonds.
As a result, stocks get bid up. And the higher their multiples go, the more the premia spread between them and bonds turns around and contracts. As this happens, the future return on stocks actually goes down. This is because future returns have been pulled forward and enjoyed today.
In typical cycles, the spread on risk premia gets pulled closer and closer to that of cash and bonds. This goes on until it can’t get any tighter. You can take rates negative… you can make the return on cash negative… and you can eke out a bit more in the return spread between risk-free and risky assets… but eventually that spread gets bid tight and looks something like this:
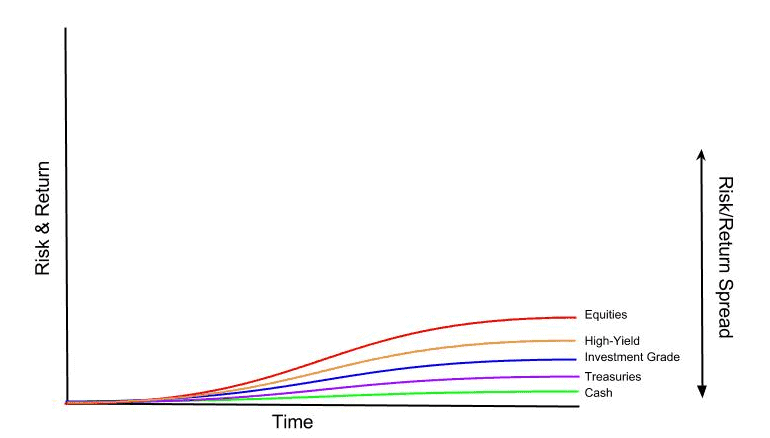
Now, here’s the thing. When the risk premia spread is pulled as tight as it can go, not only does the future return on those assets drop, but the risk, or volatility distribution, actually widens and becomes increasingly asymmetric with a fat negative tail.
Say what? Sorry… this time in English. When there is little difference in risk premia (expected return) between cash and risk assets (equities), risk assets becomes drastically more risky. That’s because when stocks have high multiples and tight spreads, there’s little upside in holding them (future return has been brought forward to today) but there’s lots of downside due to their equity valuations tendency to mean revert.
When there’s no difference between the expected return on that of equities over cash, then why would anybody want to hold equities?
That’s a good question.
Now you may be saying, “that’s all very interesting Alex but how do you know what the risk-premium spread is on stocks?”
Well, let’s make a generalization and say that an investor can put his cash into either stocks or bonds or some mix of the two.
US treasuries are the closest thing an investor can get to a free lunch (risk-free return).
To figure out what the relative risk-premium is on stocks we have to know what the equivalent PE ratio is for bonds. We can construct a bond PE ratio by dividing 1 by the 10-year rate.
Bond PE = 1/10-year UST rate
If you purchased a bond in 92’ you would have effectively paid 14 times earnings because 1/.0720 = 13.8
Now that we have our bond PE ratio of 14, we can compare it to the stock PE ratio of 25 and get an idea of what the risk premium for equities was.
The following chart is from NYU finance professor Aswath Damodaran. In this, he charts the PE of bonds (blue line), the Shiller PE for stocks (purple line), and the ratio or spread between the two (orange bars). The lower the orange bars, the greater the risk-premium spread between bonds and stocks; meaning the more attractive (cheap) stocks are relative to bonds or cash.
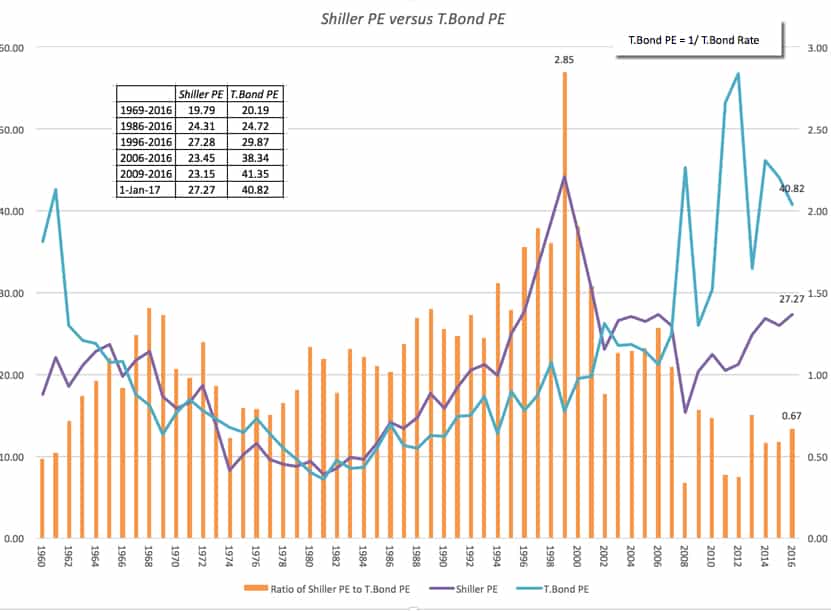
In the early 90’s we can see that stocks benefited from falling yields (higher bond prices) which drove up the PE multiple for bonds and made stocks relatively more attractive in comparison.
Secularly falling bond yields acted as a magnet over the 90’s, pulling stock multiples higher and higher.
Falling interest rates not only boost the numerator in multiples but they also increase the denominator (earnings).
Lower yields increases borrowing and lowers debt servicing costs, pushing up consumption. This boost in demand widens profit margins and fuels the business cycle.
The driving force behind the extended boom in the 90’s is the loose Fed governor Alan Greenspan who kept interest rates too low for too long, leading to the tech bubble.
So it’s not enough to say that stocks are overvalued because such and such multiple is at X, like Klarman did at the start of the 90’s bull market.
Valuations cannot be looked at in a vacuum. Investors have to put their money somewhere and that somewhere is always based off their considerations of risk/preservation and return/growth across a range of assets.
In its most simple form, this choice is deciding the right mix between stocks and bonds. As a result, it’s the relative valuation between the two choices that matter because it’s the relative risk-premium spread that drives much of investors decision making (whether they’re conscious of it or not).
A Slimming Margin of Spread
Now that I’ve explained financial relativity theory we can apply that to where markets are today.
Going back to our premium spread chart we can see that the shiller PE to Bond PE ratio is still near record lows, despite earnings multiples being near record highs.
Similar to Klarman in 92’, we’ve had many smart financial pundits and market players calling for market chaos over the last four years because of these “high” valuations. And just like in 92’, stocks have risen, multiples have expanded, and valuation bears have continued to be wrong.
All this is because real interest rates have been between negative and 50bps for the last seven years (the real 10-year rate is only 46bps and real rates on the 5-years are zero).
Low nominal and real interest rates on bonds mean a wider risk-premium spread on stocks and a cheaper relative valuation.
So does that mean we’re at a point in time similar to 92’ and we’re about to go on a large secular bull market expansion?
No. No. No…
The 90’s benefited from the tailwinds of a long-term debt cycle where interest rates trended lower from historical highs. And the consumer had a relatively strong balance sheet (reasonable debt to income).
But now we’re going through a turning point of the long-term debt cycle and moving into the deleveraging phase. Interest rates can’t fall any further and the balance sheets of consumers and companies alike are maxed out with leverage. What were tailwinds in the 80’s and 90’s will be headwinds over the next 10 years.
With that said, the relative value of US equities is still attractive at the moment. The equity risk premia spread is only at 0.62. This spread has a ways to tighten before equities’ relative valuation starts to look less attractive (it’s when the stock/bond PE ratio is closer to 1 that investors should start to worry).
The biggest risk to premia spreads right now are either collapsing earnings or much higher rates.
Barring any politically induced blow ups (which both figuratively and literally look more and more possible) we should see sustained earnings growth over the coming year. Earnings growth is continuing to benefit from low hurdle (comparables) relative to the year before. We talked about these base effects in a previous MIR which you can read here.
The primary risk is that the rise in interest rates greatly exceeds the growth in earnings. This could happen under an environment where growth and/or inflation starts picking up and the Fed moves more aggressively to raise rates.
This type of scenario is plausible if the Trump administration is successful in pushing through its tax and regulation reforms and in carrying out its expansionary fiscal policy.
I see the 3.25 – 3.5% level as being the critical point on the 10-year note where we’ll likely see the end of the bull market in US equities — risk premium spreads would be completely collapsed at that point and holding stocks would offer the same return as cash but with a lot more volatility.
And just as lower interest rates can boost earnings and drive the business cycle upward, higher rates can turn the business cycle lower and put the earnings trend in reverse.
When this happens (all business cycles eventually do come to an end) we’ll be left with double valuation headwinds: falling earnings forcing high valuation multiples higher and higher stock/bond relative PE ratios.
It’s in market environments like this when conventional valuations of just plain PE ratios begin to matter. That’s because the power of mean-reversion takes effect, with higher multiples generally equating to larger falls.
The following two charts via Pension Capital and Star Capital, respectively, demonstrate the markets tendency towards this mean-reversion of valuations. Meaning, higher valuations equate to lower future returns.
US stocks are currently in the top valuation percentile. The average future returns from these levels as the graphs clearly show are not good.
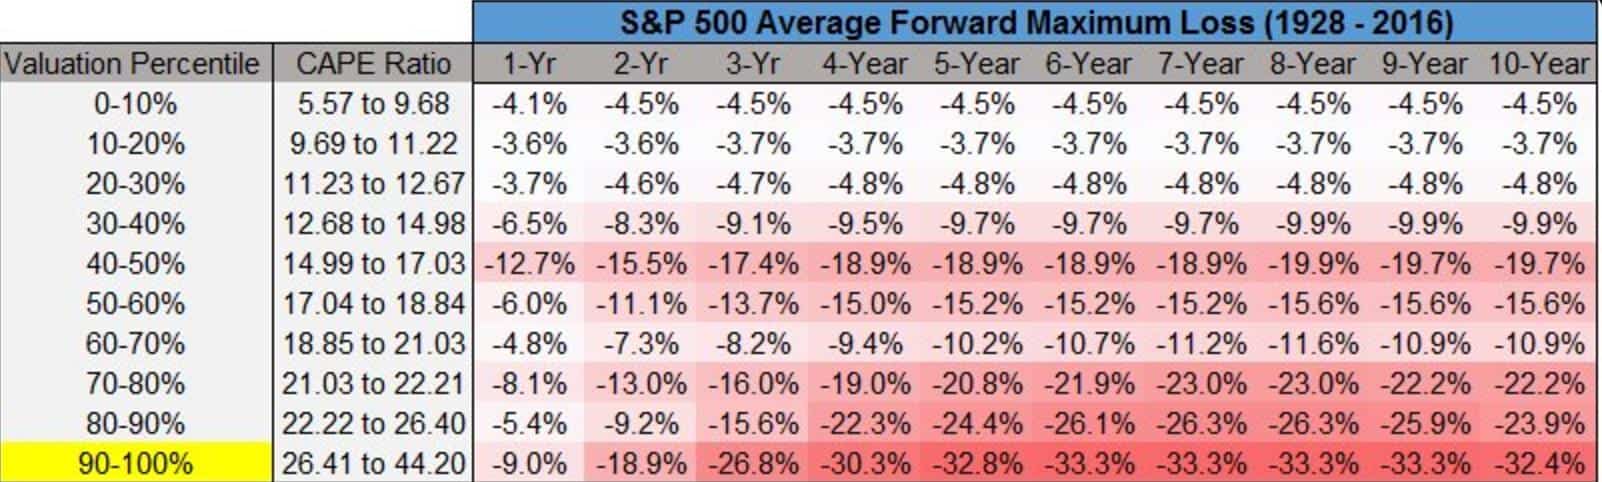
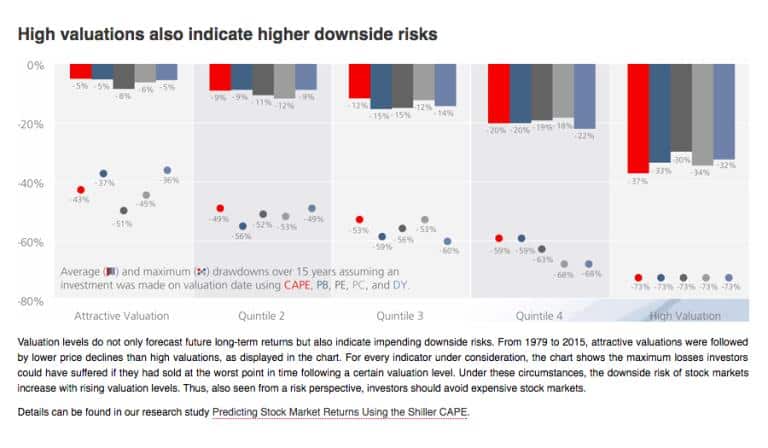
So we find ourselves in an environment where classic earnings multiples are historically stretched. And these valuations are typically followed by large drawdowns.
But relative risk premiums still favor stocks over bonds. Interest rates will also only go higher from here, which will compress that premium spread further, leaving us with high valuations in a rising rate environment. Meaning, by holding US stocks investors will be carrying a lot more risk than they think. Mean reversion hasn’t disappeared from markets.
This fits in with our US market outlook that we’ve been writing about for the last six months: we believe we have entered a period similar to 98’ – 99’. US stocks should continue to move higher but with those gains come increasingly dangerous drawdown risks.
This is also inline with the sentiment I’m seeing around the market. I’ve noticed signs of growing exuberance from other fund managers and private equity guys about the next few years. But I haven’t seen the level of frothiness or excitement that’s indicative of a market top… though I think we’ll get there fairly quickly if it looks as though the Trump administration will be successful in carrying out its economic agenda.
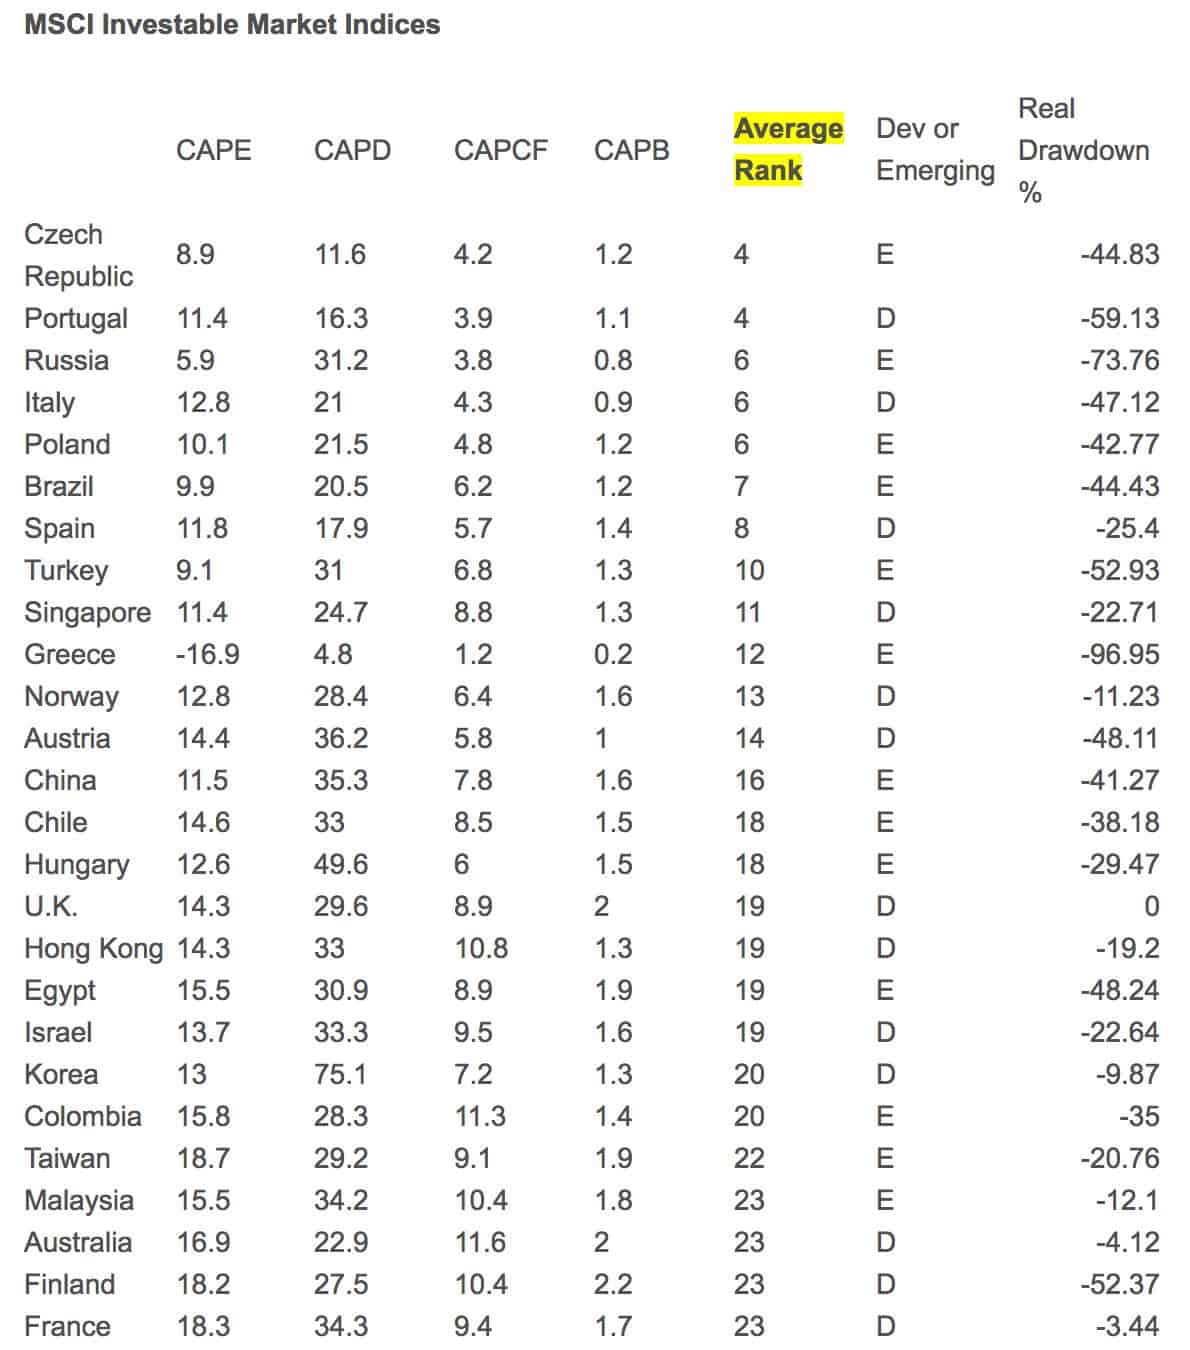
If I was an asset allocator and not a trader, I would start allocating more and more of my money into lower valued foreign stocks and bonds. The following table via Meb Faber shows the lowest valued markets around the world. And the next graph shows the average following returns for those various valuation percentiles.
At Macro Ops we’ll continue to play the US market to the long side until we see the bond/stock spread go over 1. Then it’ll be time to start testing the market to the short side.
The above is an excerpt from our monthly Macro Intelligence Report (MIR). If you’re interested in learning more about the MIR, click here.