Conventional economic “wisdom” fails to understand the role of credit/debt in our market based system. Mainstream economics completely neglects to understand not only credits affect on demand, but also how this credit demand fluctuates in both short and long-term cycles.
Now when I say cycles, don’t roll your eyes and think I’m some tinfoil hat wearing conspiracy theorist. I don’t believe in Elliot Waves or Fibonacci or Pi or that some other hidden universal force has set us on a predetermined path of repetition — though I admit, I do look good in tinfoil.
A debt cycle is simply the logical progression of large economic sequences that follow a certain order. These sequences arise due to predictable human nature and the inherent structure of our monetary system.
Understanding these cycles won’t give you the ability to predict the future. But it will give you the ability to better understand the present and enable you to assign significant probabilities to what’s around the corner.
Our view of the world and the dynamics of debt were born out of the work done by Ray Dalio and Bridgewater (the most successful hedge fund of all time). If you’re not familiar with their work on “How The Economic Machine Works”, I suggest you check out this site.
How the Economic Machine and Debt Cycles Work:
The economic machine starts with money, or more specifically, what we think of as money; which is cash + credit.
Mainstream economics tends to focus solely on physical hard cash. But it is credit that makes up the majority of transactions in the world. In the US, the supply of physical cash amounts to roughly $3 trillion. But total credit is near $60 trillion. Most buying (demand) is through credit, not cash.
It’s important to know this because though many people mistakenly think of credit as cash, the two actually work very differently. And it’s this difference that has compounding second and third order large scale effects.
You see, when you buy something with cash, you exchange that cash for a service or good. The transaction is closed. Complete. There is no further obligation between the two parties.
When you buy something with credit, you exchange credit (a promise to pay in the future) for a good or service now. That transaction is not complete until the borrower pays off that debt. So in this instance, credit or money is created out of thin air, without the help of the central bank or US treasury. All you need is two willing parties and credit (money) can be created. An asset to the lender is created, as well as a liability to the debtor, that lasts until the transaction is closed by the debt being repaid.
It is this ability to create “money” independently through credit purchases that compounds over time and builds cycles. And it is these credit cycles that drive the economic machine.
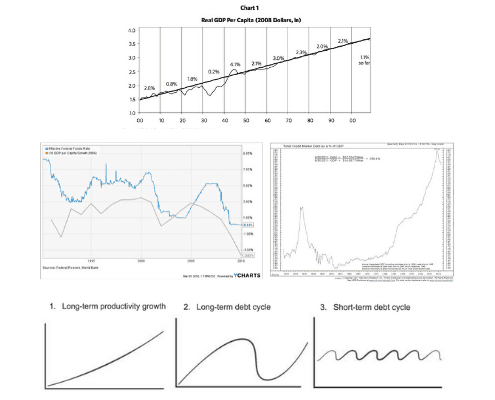
The 3 Primary Forces That Drive The Economy Are:
(Charts via Bridgewater “How The Economic Machine Works”)

Long-Term Productivity Growth
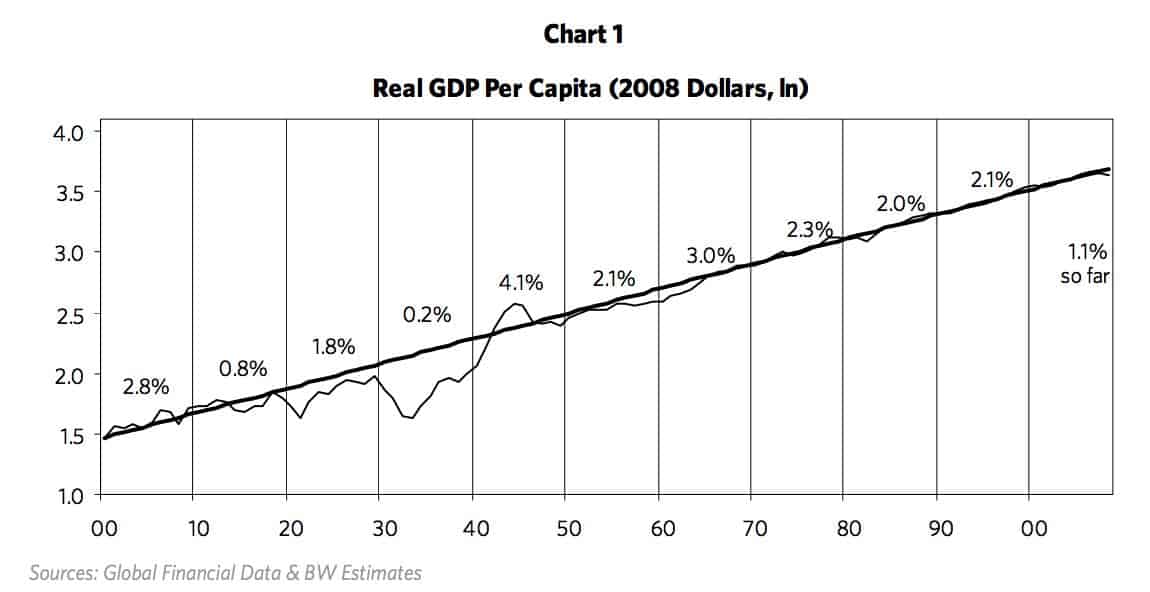
Over time, the economy (real GDP per capita) averages 2% growth. This is the result of efficiency gains born from the accumulation of knowledge — we become more productive over time.
It’s this steady build up of knowledge (advancements in our technology and know how) that drives productivity and results in the continuous improvement of our living standards.
Many of us love to be pessimistic about the current state of the world, complaining that “things were so much better back in the day”. But were they? Truth is, we as a society have it pretty good when compared to the generations before us. As Buffett noted in Berkshire’s recent letter:
“Indeed, most of today’s children are doing well. All families in my upper middle-class neighborhood regularly enjoy a living standard better than that achieved by John D. Rockefeller Sr. at the time of my birth. His unparalleled fortune couldn’t buy what we now take for granted, whether the field is – to name just a few – transportation, entertainment, communication or medical services. Rockefeller certainly had power and fame; he could not, however, live as well as my neighbors now do.”
But we are interesting creatures. We’re not satisfied with just a 2% average increase in living standards. We base the quality of our lives in comparison to those around us (usually those who are wealthier than us). And in addition to our instinctual pettiness, we’re actually neurologically wired with the propensity to live beyond our means. Jason Zweig explains this phenomena in his excellent book Your Money and Your Brain: How the New Science of Neuroeconomics Can Help Make You Rich :
“You would expect logically that the borrowing and spending of money would be emotionally painful to people because having money is intrinsically a good thing, and having less money would have to be worse… Going from more money to less would be painful. When people borrow and spend money, it’s really the reward centers of the brain that become activated… When you borrow money, you are thinking not about the long-term consequences but the short-term result: You have more cash in your pocket. The pain you are going to experience down the road of having to pay — that’s in the future, it’s remote, it’s abstract.”
So credit is like a drug… we’re addicted to shots of dopamine that we receive every time we purchase something. We are literally programmed to overvalue present rewards and greatly underestimate future costs.
Credit allows us to delude ourselves into thinking we can outpace this 2% trend. But in the long run we can only consume (spend) as much as we produce (earn). When we spend more than we earn we create bad debts — debts that will not be repaid.
The way we’re wired and the structure of our credit system clashes with the limits of our average long-term productivity growth. This irreconcilable difference creates cycles.
These cycles, that oscillate around the 2% productivity trendline are called debt cycles. They’re comprised of leveragings and deleveragings of debt/credit.
A debt leveraging occurs as we increase our debt spending over time (total debt load relative to income). By doing so we pull future consumption forward while causing temporary increases in productivity above the 2% trendline average.
Eventually these leveragings reach a saturation point where debt servicing costs relative to incomes grow too large. They begin to hamper demand growth. When that point is reached, the economy will begin a deleveraging. In a deleveraging, we fall below the 2% productivity trendline.
The chart below (again, via Bridgewater) shows the overlay of all three forces over the last 100 years.
These leveragings and deleveragings are the result of the long-term and short-term debt cycles.
The Short-Term Debt Cycle
The short-term debt cycle (otherwise known as the business cycle) is fairly well understood, since it tends to occur every 5-7 years.
These short-term cycles result from the easing and tightening of money by the Federal Reserve Bank. Here’s a quick rundown of what happens when the Fed eases (lowers interest rates).
Three Immediate Impacts of Lower Interest Rates:
- New credit becomes more attractive, so people and businesses borrow more money.
- Existing debt becomes cheaper to service, since its interest payments are now lower.
- The discount rate at which businesses and financial assets are valued is lowered (a lower discount rate increases present value, making an asset more attractive). Investors then bid up these assets, moving further out on the risk curve, causing spreads between financial instruments (ie, cash, bonds, equities) to tighten.
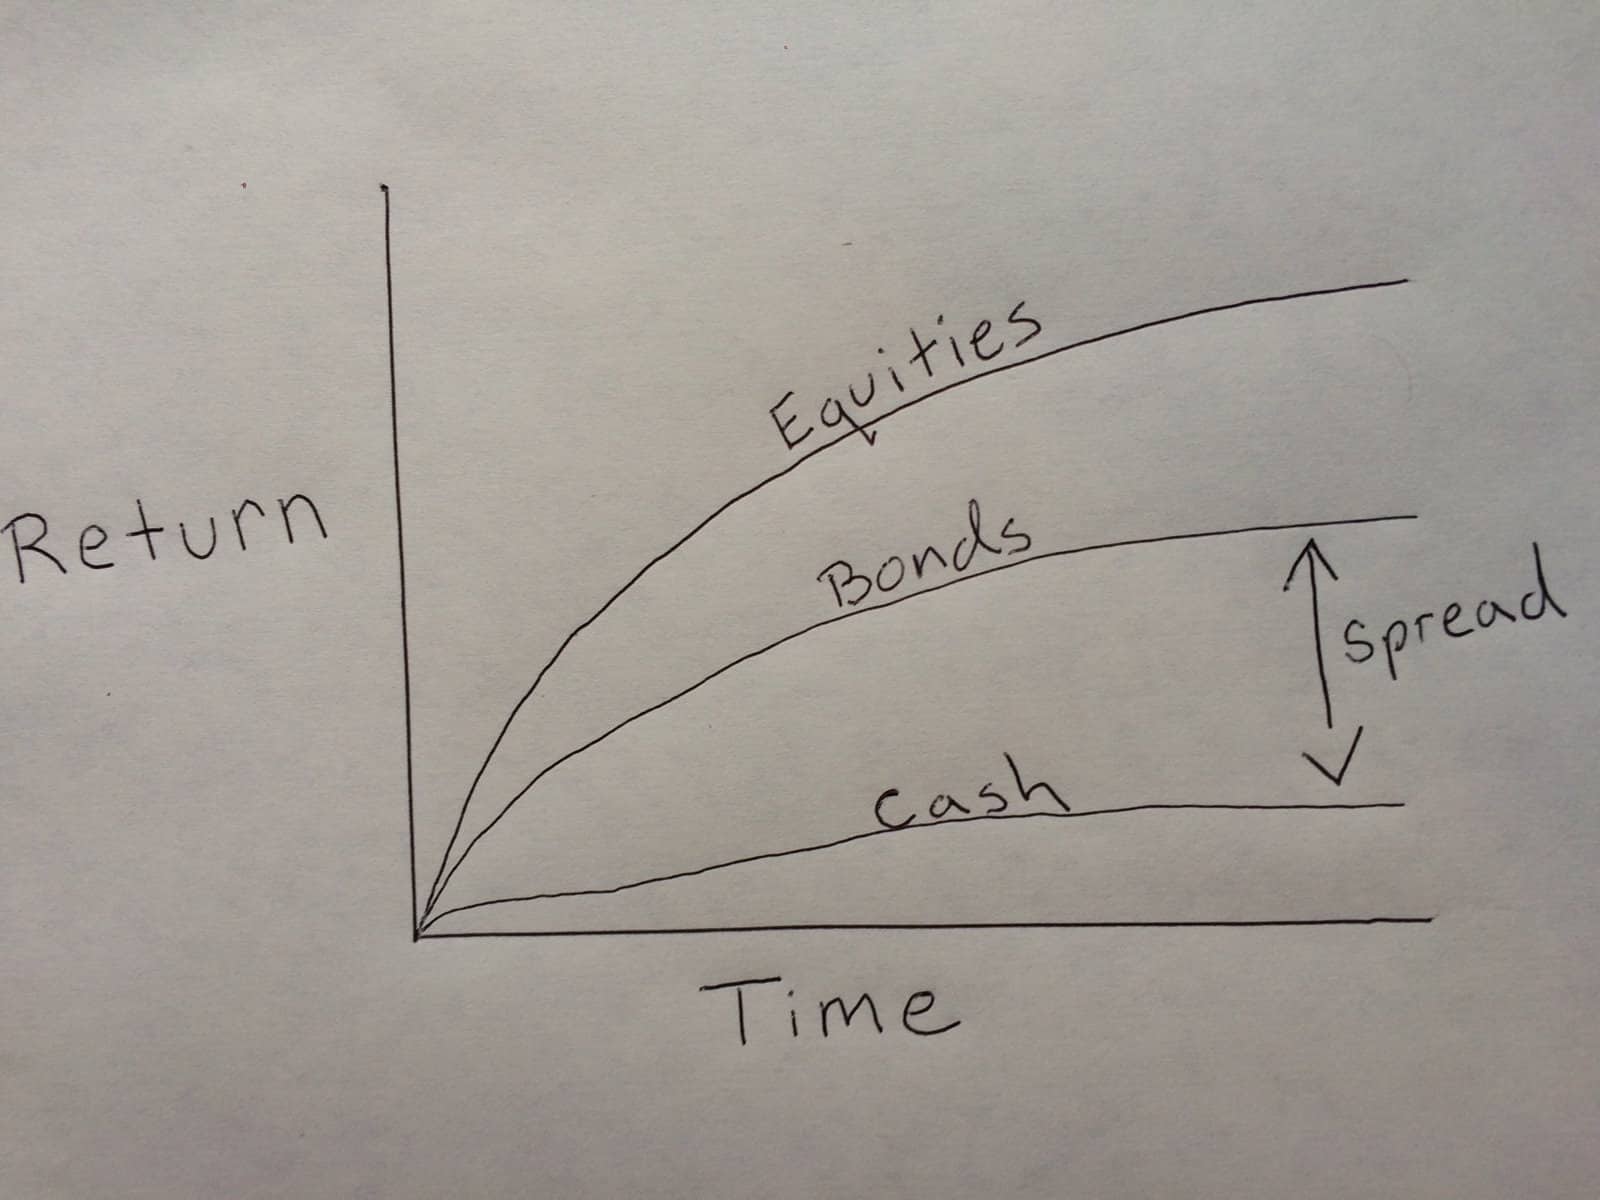
The beautifully hand drawn chart above shows the spread between financial assets. When spreads widen (higher interest rates), risk premiums go up and investors get more return for assuming risk. And when spreads tighten (lower interest rates) the risk premiums go down and investors get less return for assuming risk.
Cheaper debt increases borrowing and boosts demand. People and businesses borrow and spend more. And since one person’s spending is another’s income, incomes rise, further driving demand.
Increasing demand inflates asset prices (ie, homes, business, stocks etc.). When asset prices rise, people’s net worth rises, as well as their credit profiles. This allows them to borrow more. And since we’re strongly affected by recency bias and myopia, we extrapolate this current income growth into the future. We expect it to continue and borrow even more.
This is a reflexive process. Increased borrowing raises demand which drives up incomes and inflates asset prices. Higher asset prices result in stronger credit profiles which lead to more lending/borrowing. A positive feedback loop is created.
This process goes on until rising demand bumps up against productive capacity and we get demand-pull inflation. Productive capacity is the limit of what an economy can produce. Credit demand can be created much faster than what an economy can realistically support. When this happens, inflation begins to accelerate because there’s more demand than what suppliers can handle. Too much money begins chasing after too few goods (which drives up prices). The result is demand-pull inflation.
One of the Federal Reserve’s mandates is to regulate inflation. So when inflation begins to rise, the Fed is forced to raise interest rates. Once they do, the feedback loop goes into reverse.
The cost of debt increases due to higher interest rates. This causes money to tighten and demand to fall as people and businesses borrow and spend less. And since one person’s spending is another’s income, incomes drop, further decreasing demand. The fall in demand causes asset prices to drop which lowers the credit profiles of borrowers, resulting in less lending. The discount rate rises and widens the spread between financial assets (ie, stocks and bonds sell off and become less attractive)… and on and on it goes.
Until the Fed cuts rates once again.
But this time, since debts are now higher than they were when the Fed previously lowered rates (meaning more income has to go to debt servicing), the Fed has to cut interest rates even lower than they were before.
You can see this logical sequence of events in the chart below. It shows the Fed Funds Rate over two short-term business cycles.
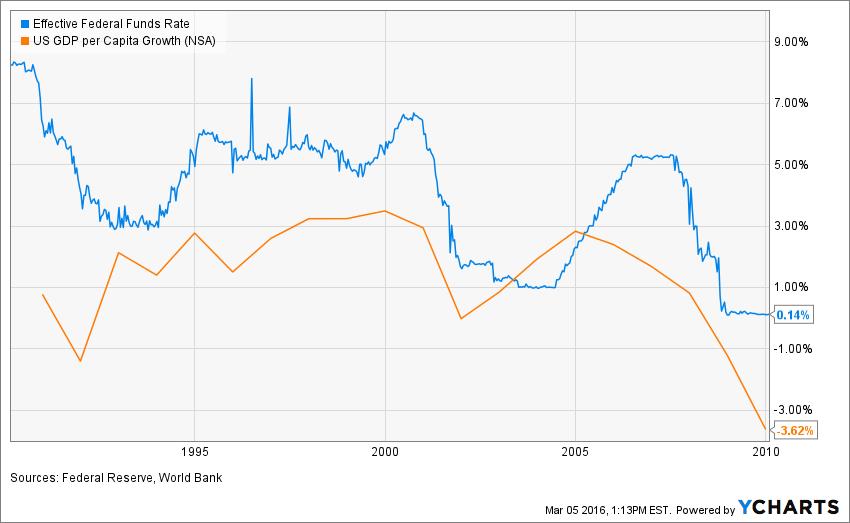
From 99’ to 00’ the Fed raised interest rates until demand and asset prices started to fall and the economy went into recession. The Fed then quickly cut interest rates to a point lower than the previous cycle low.
The short-term cycle repeated itself again in 04’ to 07’, when the Fed raised rates to subdue inflation. But interest rates were raised to a lower point than the previous cycle. And then in 08’ the Fed was forced to lower them again to fight off recession — and they were dropped to a new secular low.
Short-term business cycles repeat over time. Each time, interest rates move lower. Interest rates have to move lower because debt (and the costs to service it) keep on rising, in both the public and private sector.
This sequence continues until rates cannot be lowered anymore (they reach zero or negative). This is the point at which a pivot in the long-term debt cycle takes place.
The Long – Term Debt Cycle
Long term debt cycles are not well understood by the public. This is because they operate on a longer timeframe (hence the name). The cycle only becomes very noticeable at transition points, which generally occur once every generation, about every 25-50 years.
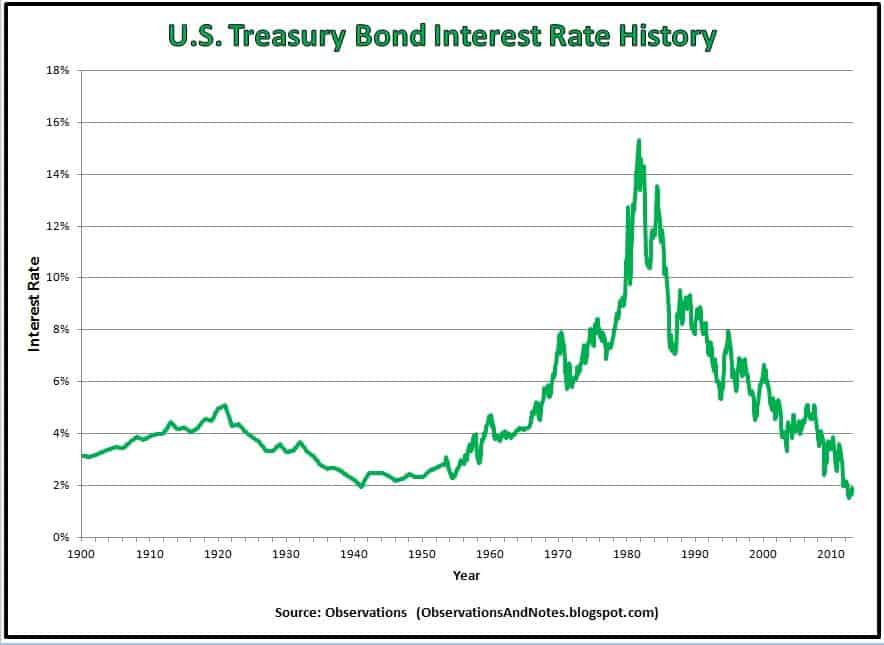
Looking at the chart above, you can see the long-term debt cycle at work. Interest rates peaked in 1920 and then turned over and began trending lower (which led to the roaring 20’s). They bottomed out in the 30’s – 40’s before trending higher again for the next 40 years. In 1981 they peaked again and have been trending lower ever since.
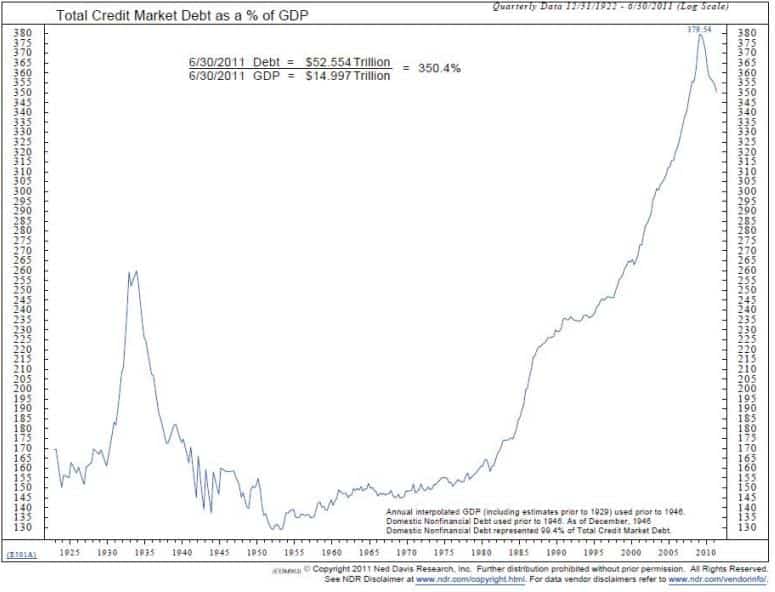
Total debt accumulates over the long-term as shown in the chart below. You can see two debt mountain peaks. One in 1929 where total debt peaked at 260% to GDP. And then the peak today where debt is at 380% to GDP.
Most people focus on public debt (debt owed by the government) at the exclusion of private debt (debt owed by households and corporations). This is wrong. Though public debt is important, private debt is the primary driver of debt cycles. Private debt is where the demand comes from that propels the economy. Also, governments can more easily manage their debt by monetizing it through central banks. Unfortunately, the private side doesn’t have this option.
The accumulation of debt cannot go on ad infinitum. The reason being that eventually interest rates cannot be lowered any further to keep things going. They reach the zero bound and no amount of credit easing can induce people to borrow and spend more. Accumulated debt levels become too high and the servicing costs too large. The credit system literally becomes maxed out.
And that’s a summary of the role that both short and long-term debt cycles play in markets. It’s a significant one… especially at the turning points.


