Last week we had Connor Haley on the podcast. If you haven’t heard our conversation, check it out here. For those that don’t know who Connor is, here’s a quick rundown:
-
- Graduated Harvard University
- Founded Alta Fox Capital in 2018 and has generated (to date) 40% gross annualized returns
- #1 Micro Cap Investor on Micro Cap Club
One aspect we covered at length was unit economic analysis. I loved Connor’s thoughts on the topic and wanted to dive deeper into this mental framework.
Most investors inspect revenue trends and call it a day. But doing that misses a vital piece of analysis. It misses the fact that each incremental unit sold might generate less profit for the business. No matter how fast you grow revenues, that’s a losing scenario over time.
“If it’s retail, you want to get into how the store matures over time. How much it costs to build. You want to understand that if you were running this business, how it would look over time. If you were competing against this business how you would look at it.” – Connor Haley
That’s where unit economics comes in.
Unit economic analysis gives us a deeper understanding of a company’s business model. It’s taking this huge organism known as a business and distilling it to its most basic form: a single unit or service.
This week we’re diving deep into the unit economic framework. We’ll learn what it is, how we can calculate it and why it really matters.
What Is Unit Economics?
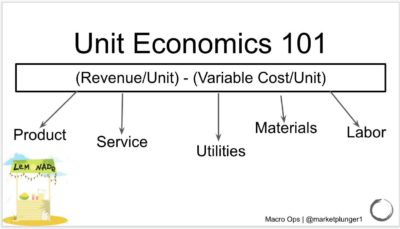 Unit economics is a company’s revenue minus its expenses on a per-unit basis. Units can be single items sold (one purse) or a single service (one engine repair). This allows us to see a company’s profitability for each individual unit sold.
“They’ll look at it on an aggregated basis and look at overall revenue and margin trends. But there’s so many things happening underneath that. And that really gets to unit economics. If a company on a single transaction is not generating attractive unit economics, and there’s not a good reason to think those will change — it will never be a good business.” – Connor Haley
The Lemonade Stand Example
Let’s break this equation down using a lemonade stand model. Our lemonade stand sells each cup for $1.00. We know what our revenue looks like on a per unit basis: one cup of lemonade = $1.00 in revenue. But the expenses side of the equation is a bit nuanced.
We focus on variable costs per unit when analyzing expenses. Variable costs are expenses that change in proportion to total revenue. In general, variable costs rise when a company makes more goods and fall when they produce less goods.
In the case of our lemonade stand, the basic variable costs are:
-
- Lemons
- Sugar
We don’t have hourly employee wages to worry about since we’ll run the lemonade stand ourselves. This means our variable costs = inventory.
Let’s assume we spend $0.20 worth of lemons and $0.05 worth of sugar per cup of lemonade we produce. That brings our total variable costs to $0.25.
Calculating Contribution Margin
We know our revenue per cup is $1.00 and our variable costs per cup is $0.25. That gives us a contribution margin of $0.75 per cup (or 75%).
This allows us to compare our lemonade stand to others in the area on a unit economic basis. If Sally down the street has a 85% contribution margin we should ask ourselves, “why?” What is Sally doing that we aren’t? Where is she buying her ingredients? Is she charging more than $1?
These are important questions. These are the questions a business owner would ask. And that’s what we are as common shareholders. Part owners of businesses.
But the above example is too basic. We know businesses have both fixed and variable costs. Contribution margin tells us how much profit per unit we sell. Now let’s see how many cups we need to sell to pay both our variable and fixed costs.
Adding Fixed Costs To Our Lemonade Stand
We need a stand to sell our lemonade. So we rent the stand and the six feet at the end of our driveway for $50/month ($600/year). That’s our fixed cost.
This is where the power of unit economic analysis appears. Here’s our most important question for our lemonade stand business: how many cups of lemonade do we have to sell to cover our fixed and variable costs? In other words, how many do we have to sell to breakeven and turn a profit?
We can find that exact answer with our contribution margin calculation.
Using Contribution Margin To Find Breakeven
Remember our contribution margin is (revenue – variable costs) for each cup of lemonade we sell. We charge $1 per cup and it costs $0.25 to make, giving us a 75% contribution margin.
Here’s our breakeven point calculation: Fixed Costs divided by Contribution Margin.
We can choose whatever timeframe we want for our fixed costs (monthly, weekly, quarterly, etc.). It doesn’t change the end result.
Let’s use a monthly example. We have $50/month in fixed costs to operate the lemonade stand. Divide that by our 75% contribution margin and we have a monthly break-even of $66.7. Since we sell our lemonade for $1/cup, that means we must sell at least 66.7 cups of lemonade to break even. Anything above that is pure profit.
Now that we’re comfortable with the concept of unit economics we can use it for a larger, lemonade stand style business: Starbucks (SBUX).
Starbucks Unit Economics Analysis (Pershing Square)
I love Bill Ackman’s ability to analyze a company on a unit economic level. There’s no better example of this than his analysis of Starbucks (SBUX). You can read the entire SBUX pitch deck here.
In our lemonade example, each unit represented one cup of lemonade. In Bill’s SBUX thesis, each unit represents one new store opening. Now all we have to do is determine the cost of opening one new store versus the contribution margin (or EBITDA) we generate from that store.
Here’s the breakdown:
-
- New store build cost: $680M
- Average store sales volume: $1,500M
- Average store-level EBITDA margin: 30%
Each new store loses roughly $230M in the first year of opening ($450M in EBITDA – $680 costs of opening). But, the new store turns profitable halfway through its second year of operations. Not bad! But we can go deeper, more granular. Let’s look at the individual dollars.
According to Ackman, $1 spent opening a new Starbucks store is worth $10-$15 in the future as the store matures and approaches steady state. He gets there by applying a 15x multiple on the average run-rate per-store EBITDA ($480M).
Comparing Companies
Whether its lemonade stands or Starbucks stores, unit economics allow us to compare companies on their first principle drivers: what makes them money.
We can see which company performs better than the rest. Which one has better cost control or higher margins. Driving our analysis down to its basic unit economic level ensures a deeper understanding of the business. We think like owners because we are owners.
Unit Economics Through The Lens of The Customer
We’re continuing our unit economics series next week where we look through the lens of a customer. We’ll dive into customer acquisitions costs, lifetime values and how to compare LTV/CAC ratios amongst firms.
I’m excited to bring that to your inbox.
As always, feel free to reach out to me with any questions.