The hierarchy of market technicals looks something like this:
-
- Price: The tape is the first and final arbiter of truth
- Trend: Newton’s first law reigns. A trend in motion tends to stay in motion and a tape at rest, stays at rest
- Breadth: A measure of the strength and durability of the price and trend
- Hard Positioning/Sentiment: Quantitative measures of actual positioning in markets (ie, put/calls & CoT)
- Soft Sentiment/Data: Survey sentiment data, such as AAII and Investors Intelligence
Here’s how this works in practice.
Oh… and a quick reminder for those of you who missed it. I put together a free webinar where I dive deep into this subject + much more, which you can find here.
If you don’t know how to read the first one, then the other four can be dangerous facilitators of confirmation bias.
But… If you’ve developed an aptitude for reading the tape then the other tools can be great for helping with your timing and analysis of the potential amplitude of moves.
The idea is to use all the above tools holistically, as a means of providing context, and in their hierarchy of importance.
That’s what we’re going to do today. We’re going to run through some charts and see if we can put some puzzle pieces together to form a clearer picture of where we are.
I’ve purposefully left out any mention of more general macro data points. The current situation is too fluid with COVID on one end and record-breaking fiscal/monetary actions on the other, that I feel it detracts from the analysis at this point more than adds.
Until we see a semblance of consensus, I’ll trust that the market is smarter than me in discerning what the future holds.
Investors Intelligence Bull/Bear Ratio
We’ll start with the bottom and work our way up.
Soft sentiment data is rebounding from a very bearish consensus. Depending on which survey and what cohort you’re looking at, sentiment is either back near neutral territory, such as AAII Net Bulls-Bears, or has recovered completely to outright bullish levels such as we see in Investors Intelligence and NAAIM Exposure index.
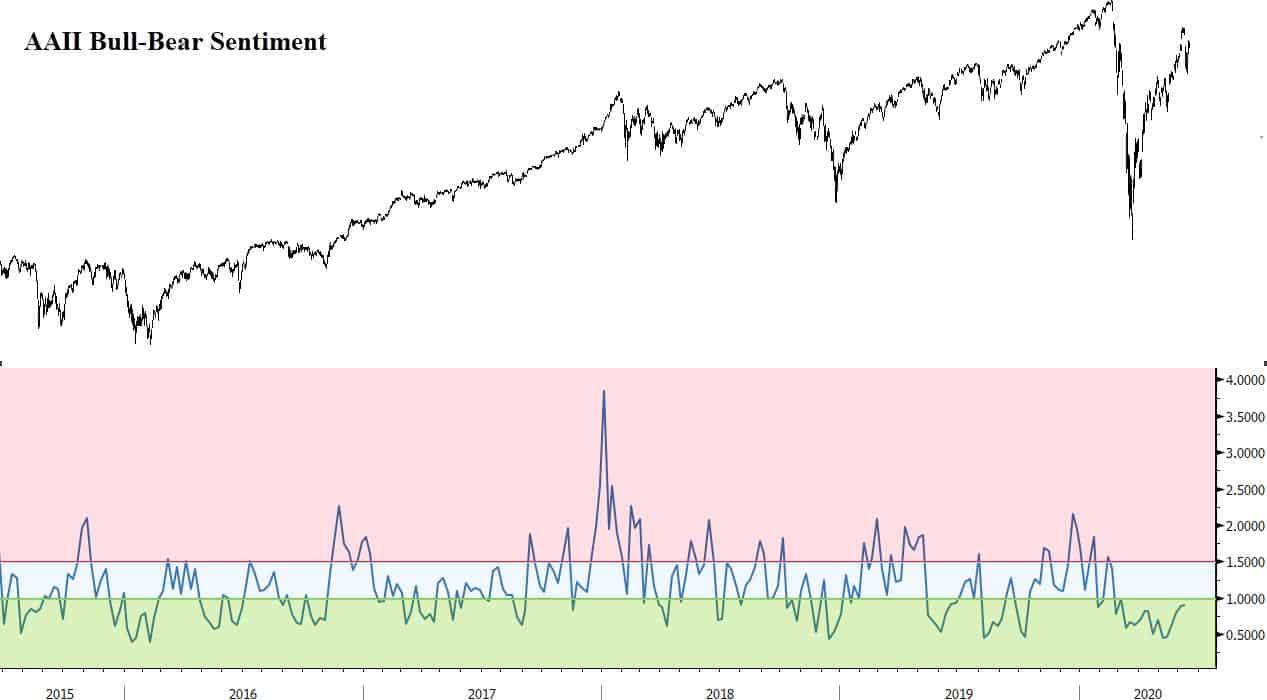
Here’s a chart of AAII Net. It’s still showing fairly bearish readings considering the run in the tape. It’ll be interesting to see where the numbers are when they come out today.
Investors Intelligence Sentiment
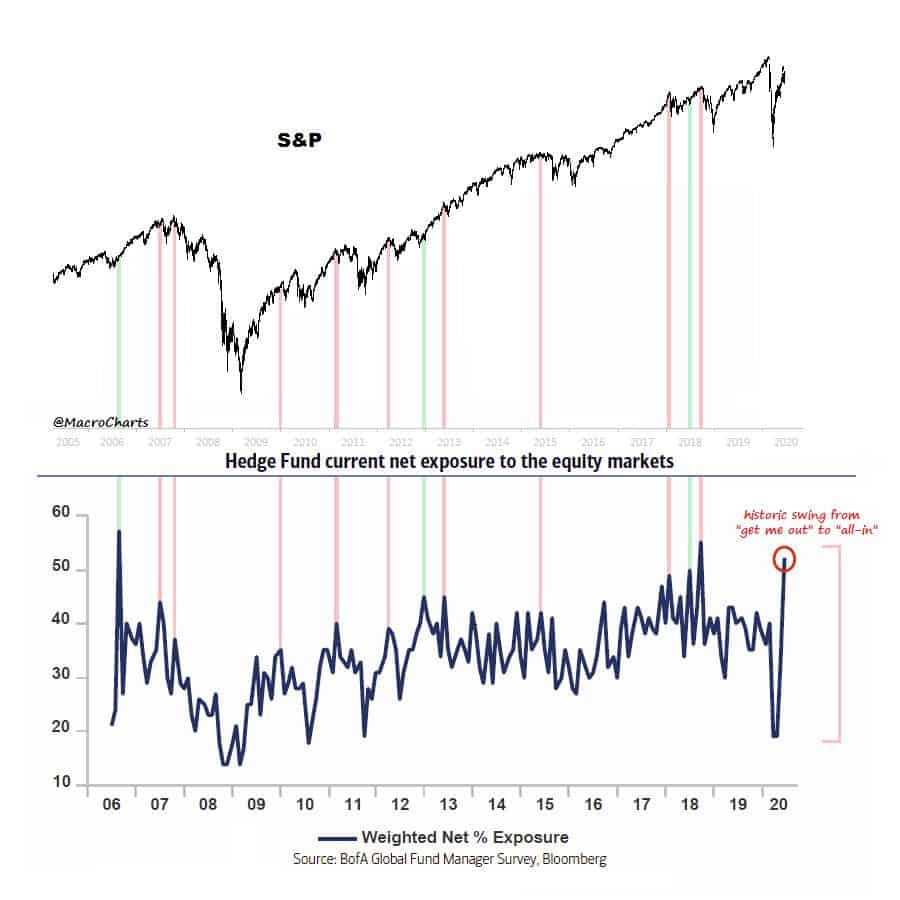
This chart put together by @MacroCharts shows the net exposure to equities of fund managers surveyed in BofA’s latest FMS. They’ve reversed from decade-low exposure to near-decade highs in the span of a month. Nothing like a change in price to drive a change in sentiment.
The hard positioning data paints a more mixed picture.
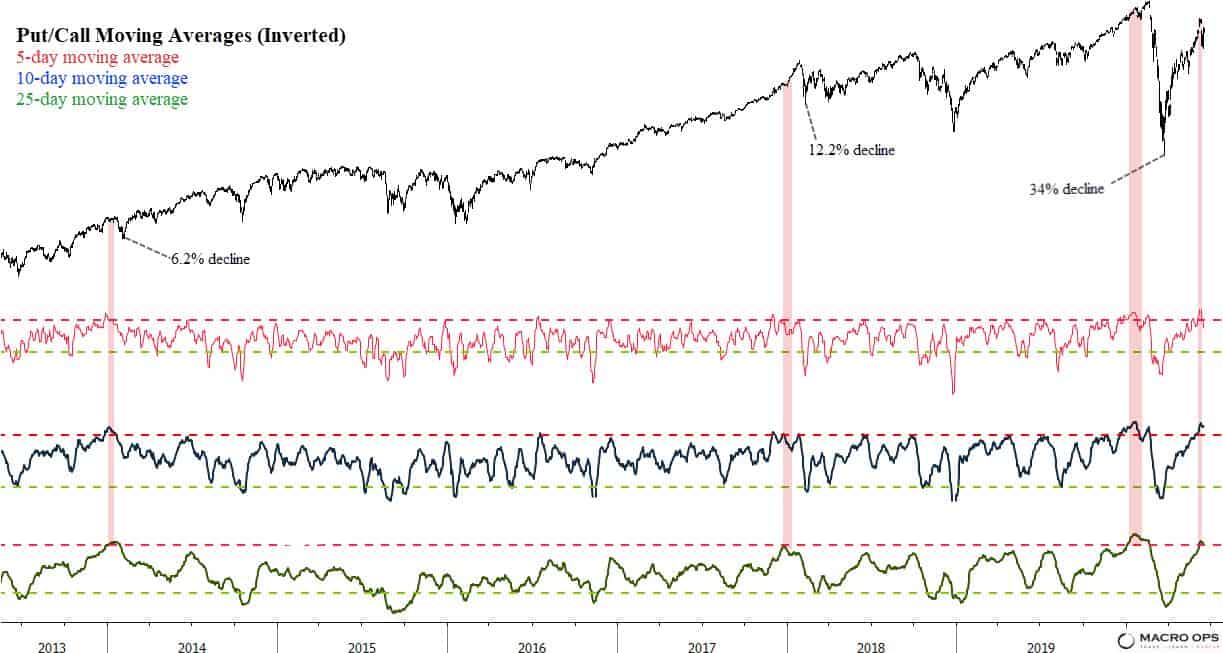
For example, Put/Call ratios are showing extreme complacency. The vertical red highlights below show the prior three times that both the 5, 10, and 25-day moving averages were this extended — note, put/calls are inverted in the chart below.
Last week’s selloff didn’t put a dent in this measure. It’s going to take more volatility and fear to wash out these weak hands.
It’s important to point out though, this isn’t an exact timing tool. Rather, you should think of put/call ratios as a measure of trend robustness/fragility. When the measure is this extreme, it means that the trend in the price is becoming more fragile, unstable, and prone to larger more violent washouts. Vice-versa when the ratio is reading the opposite.
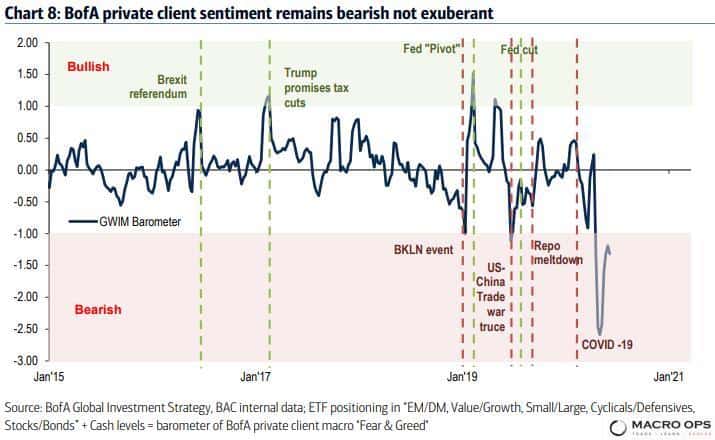
BofA’s Private Client Sentiment Indicator, which measures ETF positioning in “EM/DM, Value/Growth, Small/Large, Cyclicals/Defensives, Stocks/Bonds + cash levels” has bounced from its lows but is still at bearish levels. Speculative CoT data also shows something similar.
Market Breadth
Breadth, on the other hand, has been incredibly strong since the March 23rd bottom.
A good way to think of market breadth is like an advancing military force. Strong breadth is similar to an army with a deep and disciplined line (this is old school battle where fighters stood shoulder to shoulder). That line has strength and weight behind it. It can move and push through barriers.
On the other hand, when the line is thin and begins to fracture. It doesn’t take much from the opposing force to break it completely. This is how major trend changes happen. Each issue in an index is equivalent to a soldier standing on that line. And that is what various indicators of breadth aim to measure.
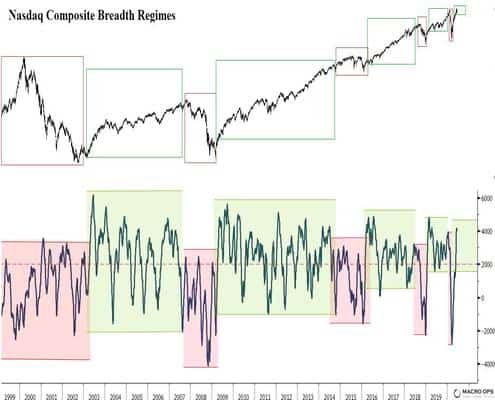
This chart showing oscillating Breadth Regimes in the Nasdaq over the last 20-years is a great example.
The red boxes mark weak breadth regimes where the majority of issues are moving down and the tape subsequently trades heavy. The green boxes show the opposite, where the majority of issues are spending more time trending upwards than downwards. In these regimes, the dips get bought and the market trends higher.
And unless market breadth dramatically deteriorates in the coming weeks and months — which is possible considering the schizo macro environment we’re in — this measure of longer-term breadth is promising for those in the bull camp.

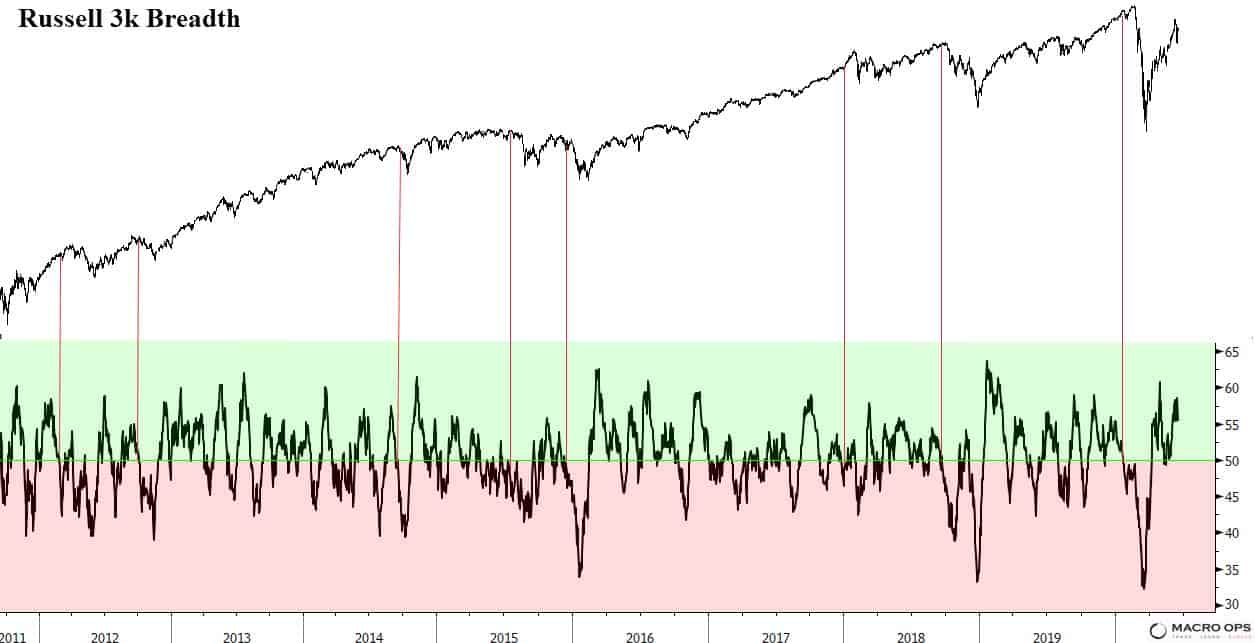
Here’s a short-term look at our breadth indicator for the Russell 3k. The higher this line is in the green, the stronger the underlying trend.
Notice that it’s still quite strong. This is one reason why this market is likely to become more overbought and overloved before a larger correction comes to wash out the weak hands that have built up.
Market Breadth Indicators
The red vertical highlights show how this indicator weakens and rolls over before a larger selloff occurs.
When looking at market trend, I like to pull back and look at monthly or higher timeframes.
In the SPX, the 10yr+ bullish trendline remains intact. The long-term path of least resistance remains up. However, the market has now traded sideways for 30-months. This means it could either be in the process of putting in a cyclical top (though breadth and liquidity measures would argue that’s unlikely at this point) or it’s forming a large base to launch its next major bull leg higher.
A monthly close above the 3,300 level in the SPX would be needed to confirm the latter.

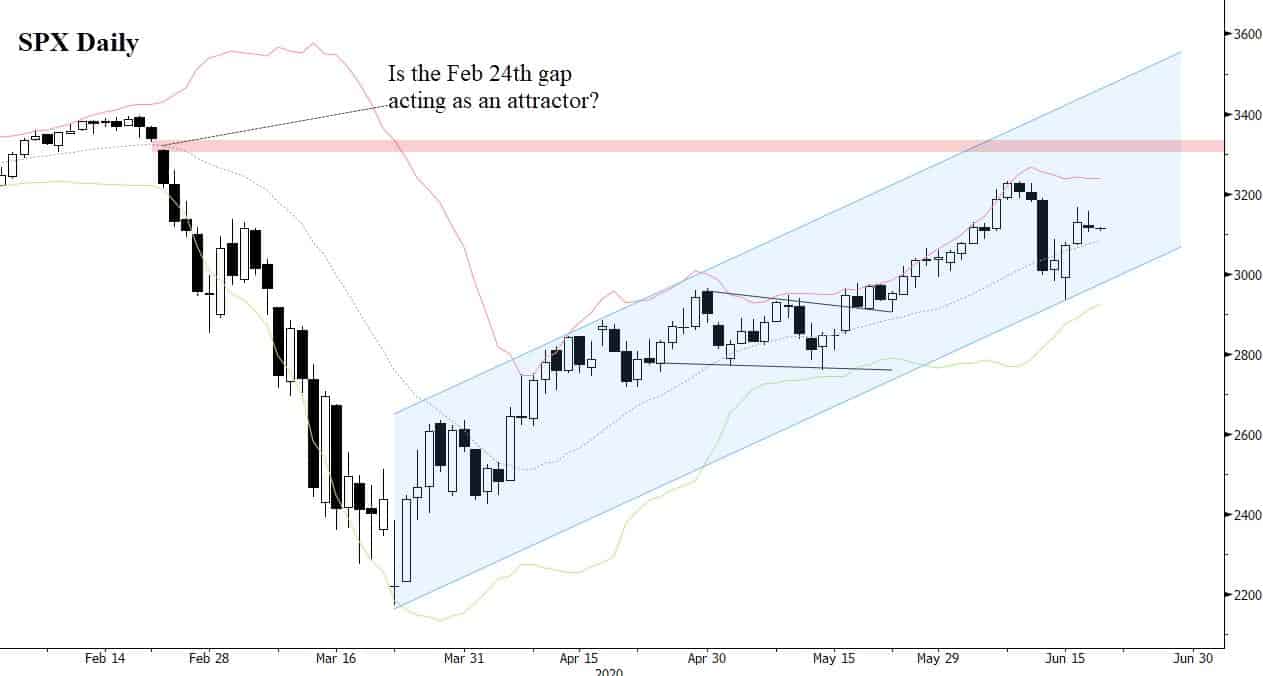
On a daily timeframe. The SPX is in a clear bull quiet regime where every good looking sell setup fails and every dip gets bought. The Feb 24th gap (red horizontal line) may be acting as an attractor.
So in totality, we have soft sentiment data giving neutral-to-bullish readings. Hard positioning data is more mixed. Put/calls are showing extreme complacency and hedge funds are back near record positioning in risk assets, while CoT and BofA Private Client data are still stuck in the mud.
Breadth is strong on both a long and short-term basis and isn’t showing any major signs of weakening, yet.
The long-term market trend remains up, though it needs to close above the 3,300 level to clear its current consolidation zone and confirm the start of a new bull trend.
The short-term tape is in a bull quiet regime, where the onus is on the market to signal a clear change in regime, from bull to bear. That hasn’t happened yet. The SPX looks like it may be forming another bull flag, similar to the one that formed in early May. In this case, we should expect some back and forth chop before the next leg up.
It’s likely that the Feb 24th gap in the SPX is acting as a price magnet. If the market were to quickly run-up to that level, it would suck in the last of the bears from the sidelines and then kick them in the shins by finally selling off to wash out the weak hands.
Strategic Investing in a Volatile Landscape
It’s a tough read, especially when we consider the tape-bomb risk, both negative and positive, inherent to COVID and fiscal/monetary policy at the moment (ie, when will the next CARES act be passed and will it be enough fiscal support? How bad will COVID get as economies reopen and how effective will the treatments we’re developing be? Etc…)
How you trade and invest in this very fluid environment should be determined by your particular approach, objectives, and risk preferences. However, what you should not do is engage in high conviction top calling or making any bold convictions whatsoever. This market will trample any who do.
There’s been a LOT of people on the sidelines of this recent bull move, whining about this or that and trying to call the top on every little daily blip. That’s not how you should play this game.
This is a much better environment to be a trader than an investor. A renter than an owner. And an oddsmaker than a predictor.
When it comes to trading macro, you cannot rely solely on fundamentals; you have to be a tape reader, which is something of a lost art form. ~ Paul Tudor Jones