“Fundamentalists who say they are not going to pay any attention to the charts are like a doctor who says he’s not going to take a patient’s temperature.” – Bruce Kovner
Bruce Kovner went from cab driver to Market Wizard.
How did he do it?
The short answer: Reading the charts and respecting risk. Check out our deep dive on Kovner here if you want a longer explanation.
Kovner leveraged both fundamentals and technicals to become a billionaire trader.
Yet today, both camps remain entrenched in their respective ideologies.
Fundamental Analysis vs Technical Analysis
Fundamental investors despise technical analysis (“TA”). To them, it’s another form of astrology. Why waste time studying a price chart if the fundamentals of the business drive long-term share price direction?
On the other hand, technical traders place zero value on a company’s fundamental competitive advantage, branding power, moat expansion, or network effects. None of that matters. To the technician, the price is the goldfinch.
There are countless blog posts outlining the value of fundamental analysis. However, few articles describe (in a simple way) the power of technical analysis for the fundamental investor.
The following article will show you the key differences between fundamental and technical analysis while teaching you how to choose the most suitable investment strategy to optimize your financial success.
Here’s the critical part: you don’t have to use technical analysis in your trading to benefit from it.
Technical Analysis Strategies
We’ll cover the barebone basics of technical analysis, nothing more. Specifically, we’ll discuss three key topics:
- Moving Averages
- Support and Resistance
- Classical Charting Patterns
We’ll finish the primer with Edge Stacking, a lesson combining the above three skills into one trade management protocol.
Before we dive into the piece, I want to make one thing absolutely clear.
Technical analysis is not a prediction tool.
Technical analysis does not tell you where the price will go.
Technical analysis merely helps a trader understand probabilities and aids in risk management. That’s it.
Are you ready to add another model to your latticework of tools?
Moving Averages
Let’s start with the most basic technical indicator ever coded, the moving average. Moving averages are simply the cumulative average of trailing stock prices.
There are a few favored versions of the moving average, notably:
- 20 Day
- 50 Day
- 100 Day
- 200 Day
Moving averages function on a spectrum from short-term trading to long-term investing. Shorter-term swing trades will use the 20 or 21D moving average.
The most important thing to remember is to match your moving average with your investment time horizon (i.e., higher days for longer horizons, etc.).
But why use moving averages in the first place?
Moving averages are excellent trend filters (both bull and bear). Here’s the fundamental lesson from moving averages:
- Stocks above their moving averages tend to continue higher
- Stocks below their moving averages tend to continue lower
For example, check out Costco (COST) weekly chart (Fundamental/compounder-bros relate to COST):
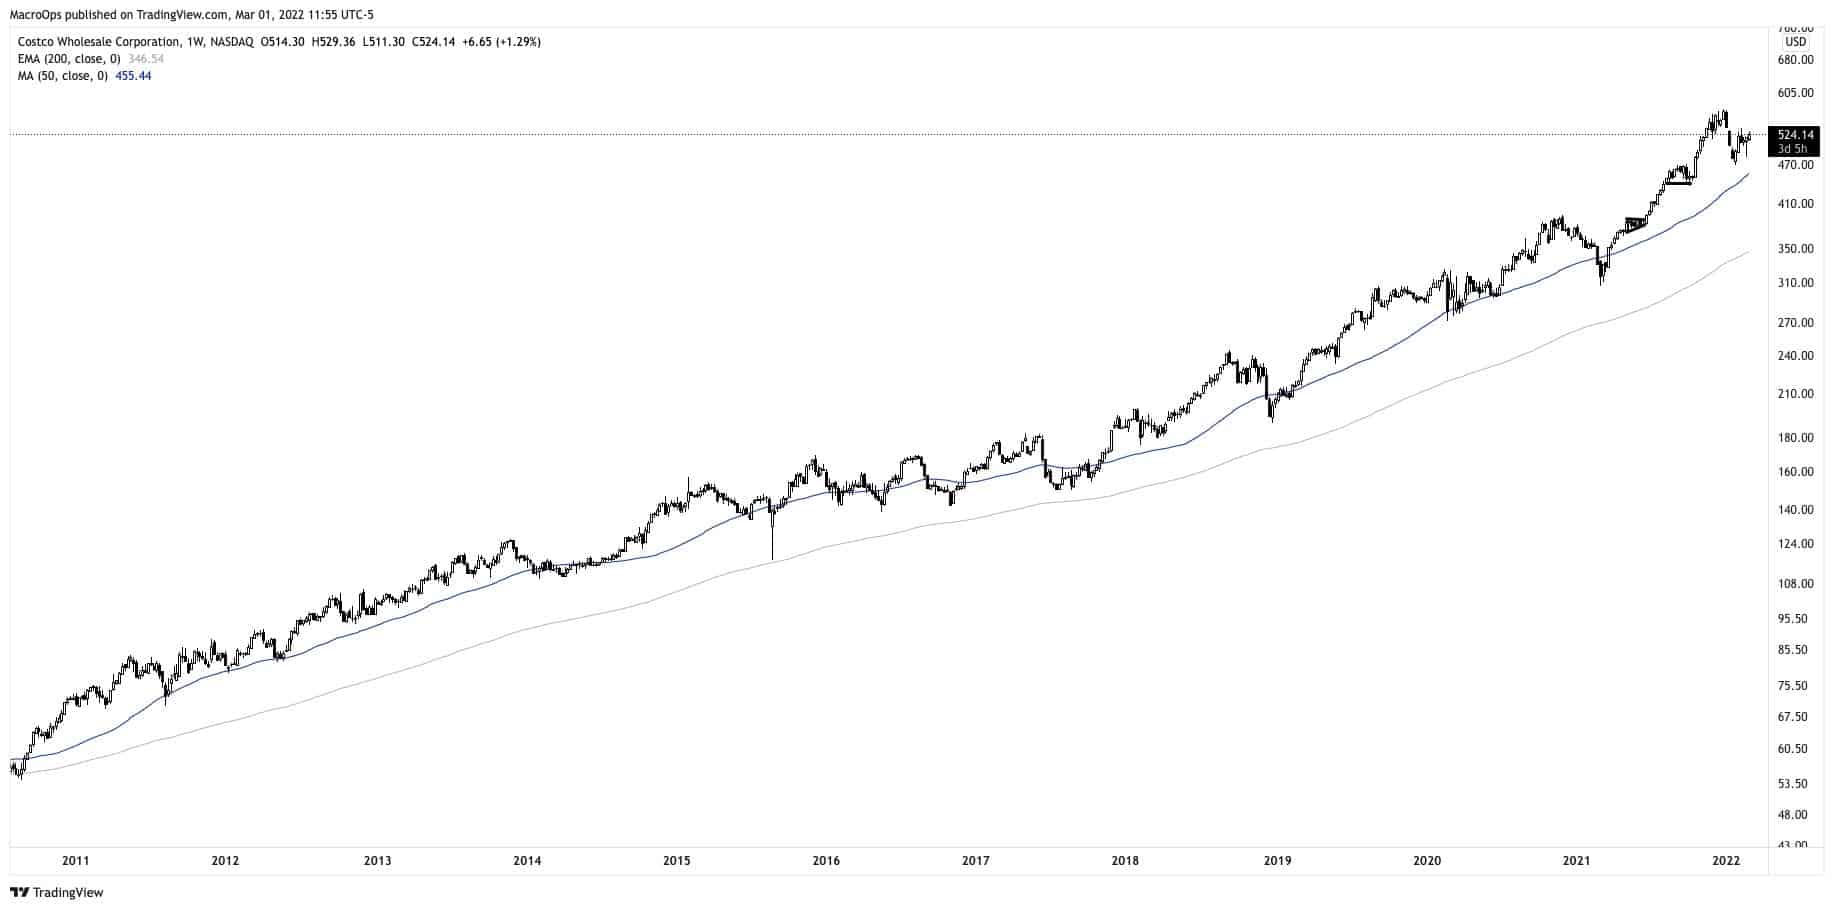
COST is a powerful example of marrying technicals with fundamentals.
A fundamental investor could analyze COST’s business model, moat, and competitive advantages. She realizes it’s an incredible business worth holding for the long term.
However, what if she added a simple technical rule: “I will only sell my COST shares if they print a weekly close below the 200D moving average.”
She would still be in the trade had she followed the above rule. Who said technical analysis is reserved for short-term traders?
Technical analysis enables the fundamental investor to reap more rewards than a strict value-based approach.
Said differently, how many value investors would’ve sold at some point along the 12-year run because “the stock was too expensive”?
Let’s use another example, Domino’s Pizza (DPZ), but this time on a longer-term time frame (monthly chart):
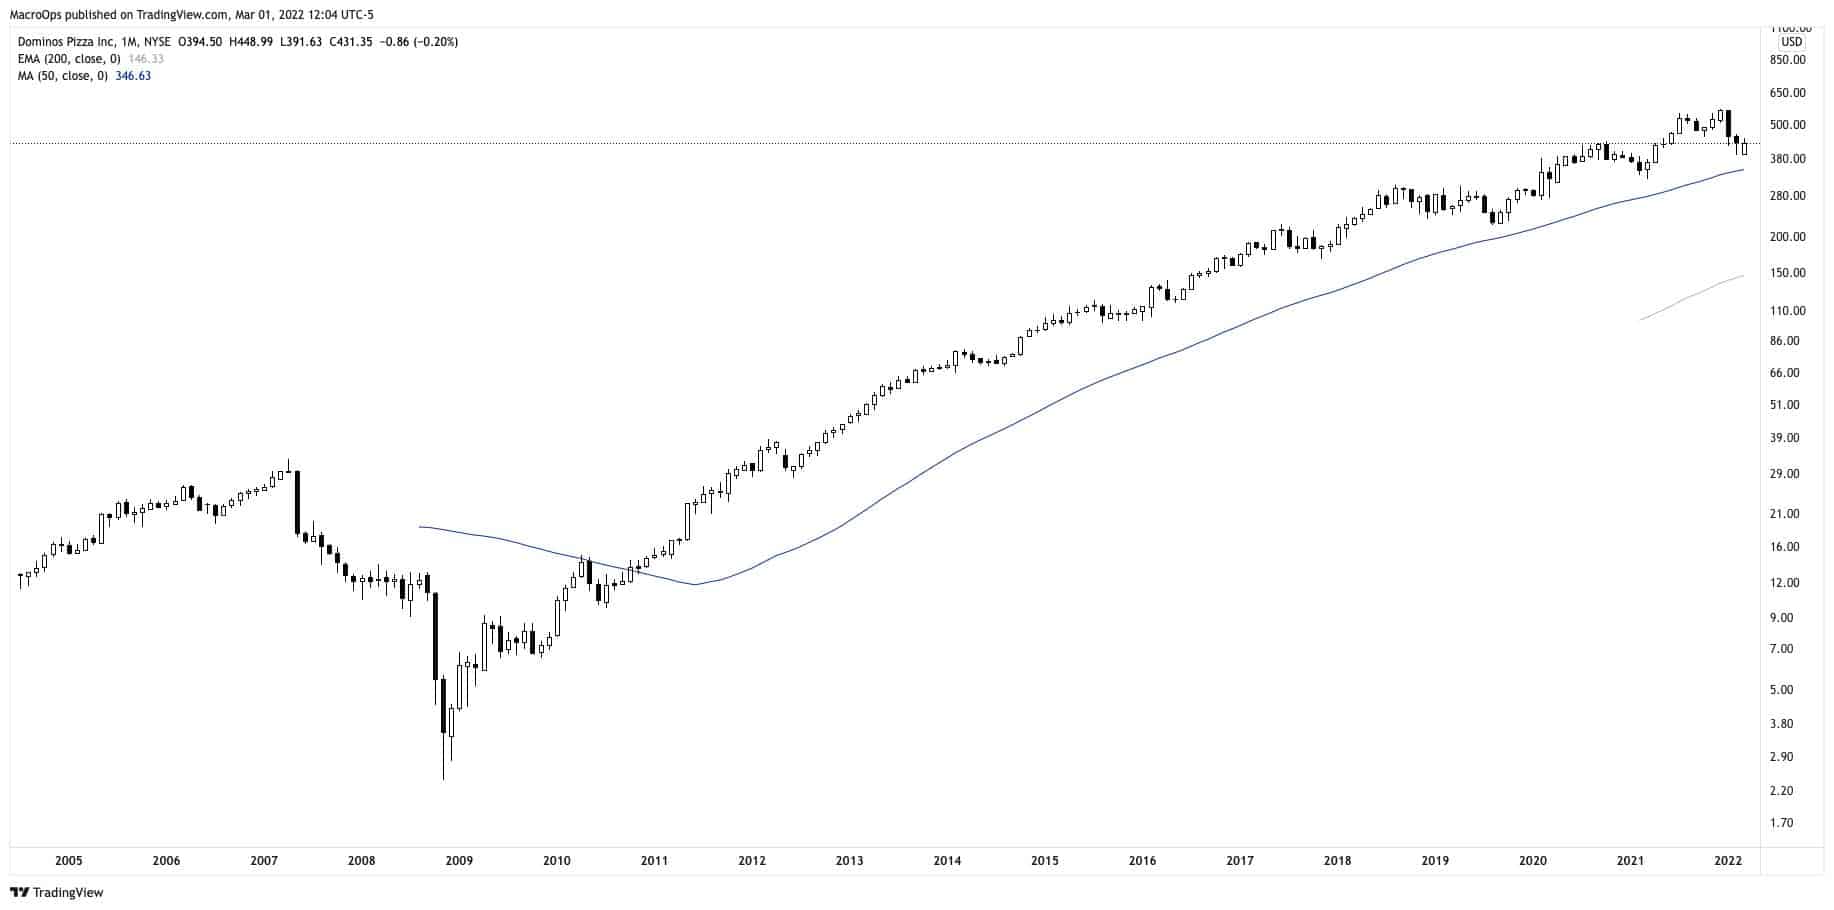
Fundamentalists say DPZ is a fantastic business with extraordinary ROICs. How can we incorporate a technical approach to trade management? Like COST, can we use TA to give us an edge when every Seth Klarman-inspired bone in our body yells “SELL!”?
Suppose we added one technical rule: Buy DPZ on a monthly breakout above the 50MA and only sell on a monthly close below the 50MA.
Again, that rule keeps you in the trade for the next 12 years as compounding works its magic.
Equally as important, let’s examine how moving averages can keep an investor out of trades and away from the falling knives.
Check out the Sea, Ltd (SE) weekly chart below:
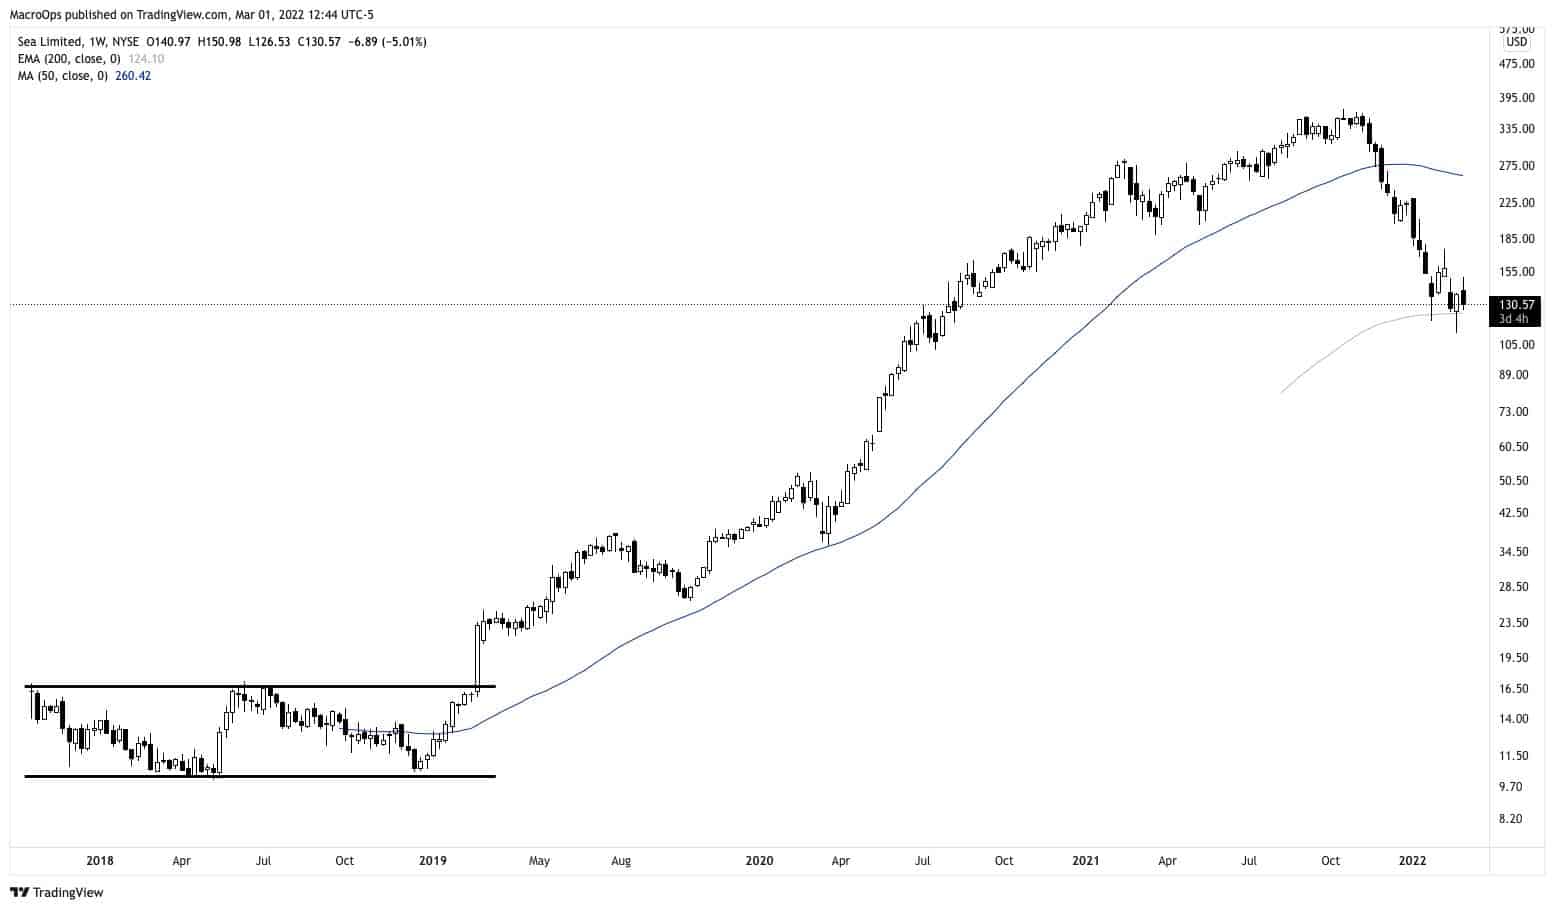
There are two ways a fundamental investor can leverage moving averages:
- Do not increase my long position if the stock is below its 50MA on the weekly time frame
- Exit the position if the stock prints a weekly close below the 50MA
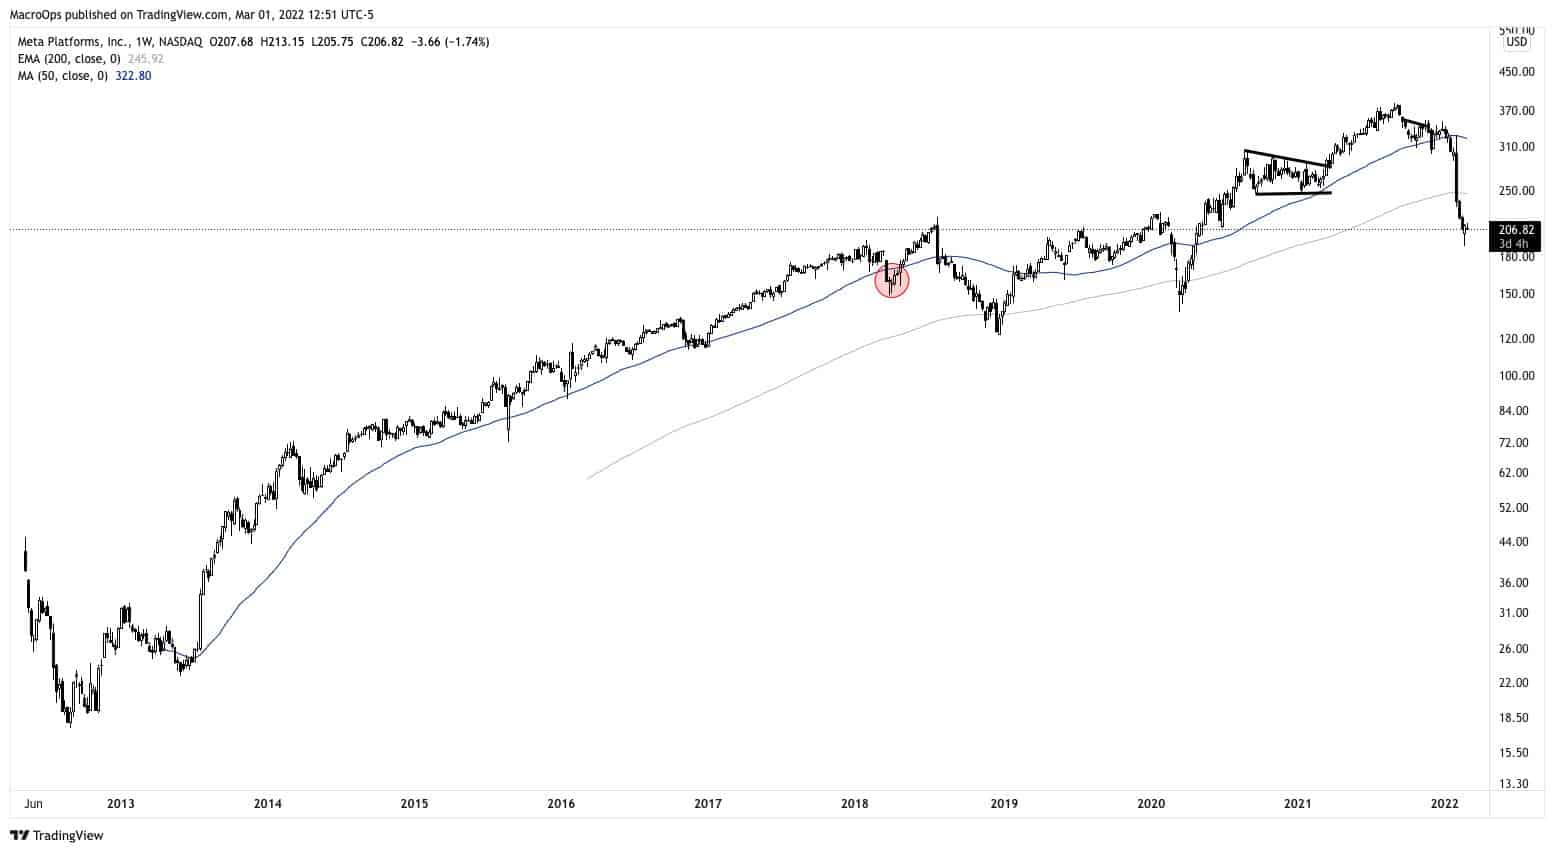
As we mentioned earlier, moving averages aren’t a panacea – no technical analysis ever is such a thing. FB is an excellent example of a weekly close below the 50MA, only to reverse higher (see below).
I want to make one final note before moving to Support and Resistance. Moving averages are an excellent tool for spotting “fake” dips.
ROKU is one example of this idea. Check out ROKU’s daily chart below.
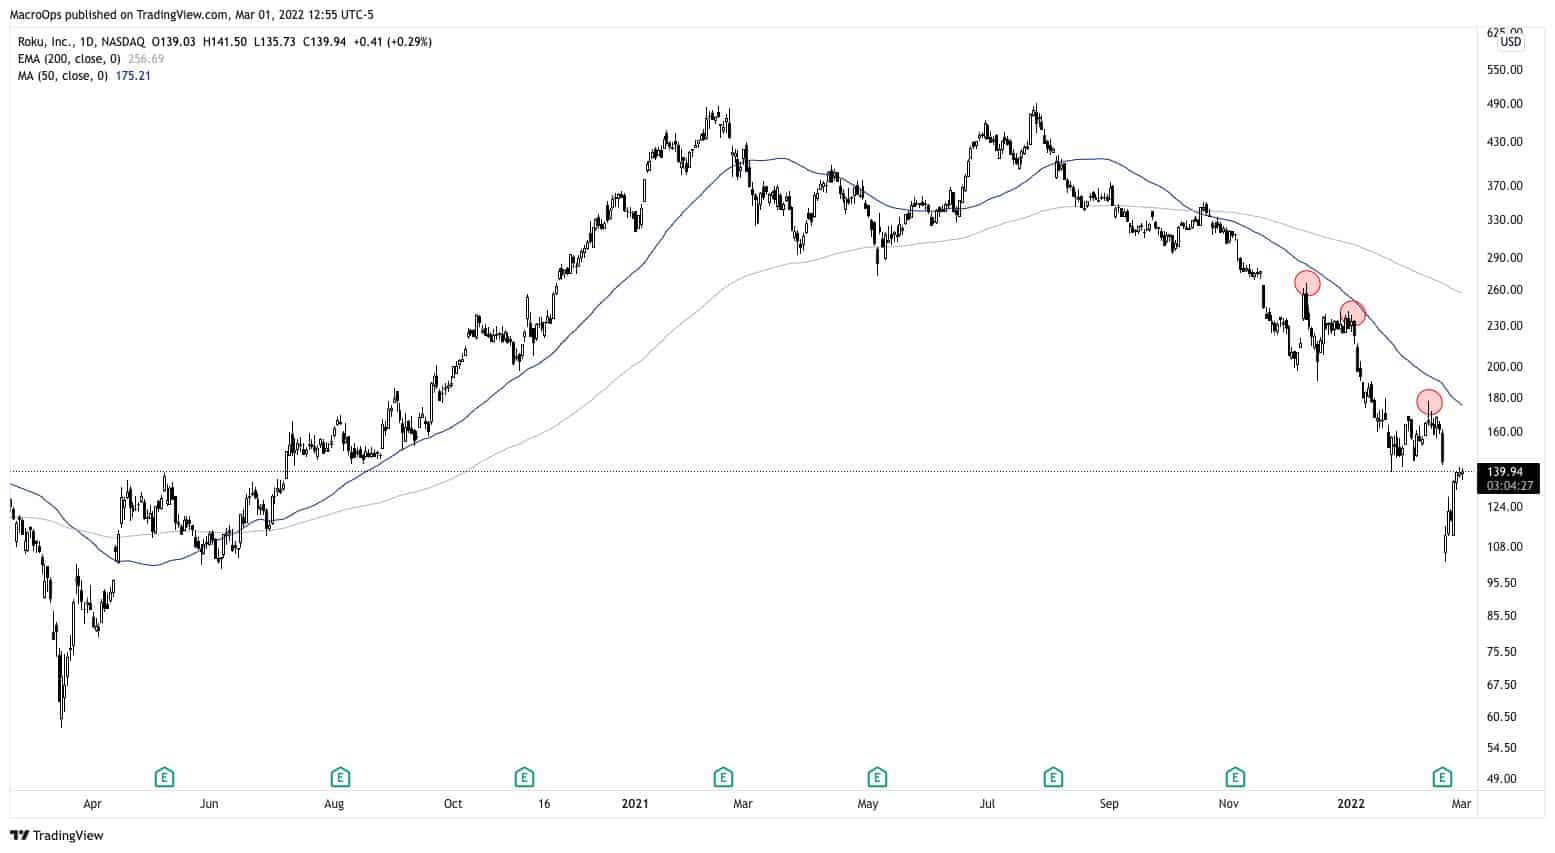
First, let’s run through our moving average checklist. The stock is below both the 50MA and 200MA. This should increase our probability of lower prices in the future (again, we can only use probabilities as TA isn’t a prediction tool!).
Notice how ROKU failed to recover the 50MA throughout its downtrend (red circles). Each time it failed, it traded lower. Hence the expression, “escalators up, elevators down.”
Next, let’s discuss Support and Resistance.
Support and Resistance
A stock chart is a visual representation of all market participants. It displays each person’s biases, psychology, strengths, and weaknesses.
Support and resistance are merely the reflections of all market participant’s biases towards specific price points.
There are two things to remember about support and resistance:
- Stocks that hold specific support (or resistance) levels offer solid risk/reward long bets (or shorts)
- Stocks that break specific support (or resistance) levels provide risk/reward shorts (or longs)
Let’s dive straight into the charts to see what I mean. First, check out the Highpoint Resources (HPR) daily chart below.
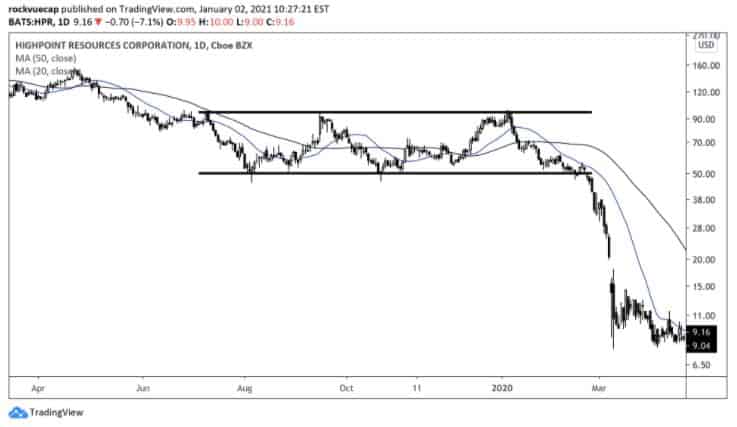
Notice how HPR traded in a range between support ($50/share) and resistance ($110/share) for months.
Suddenly, HPR broke its support at $50/share, signaling a potential change in the collective psychology of market participants.
The stock broke support below its 50MA and never looked back. In fact, HPR declared bankruptcy in March 2021.
Suppose HPR looked fundamentally cheap (traded at a low P/E, low P/B, etc.). Yet if a fundamental investor leveraged support and resistance, she would wait for either a breakout from that channel or not buy if it broke support.
Let’s use a Compounder-Bro example, like Autozone (AZO). Check out AZO’s weekly chart below.
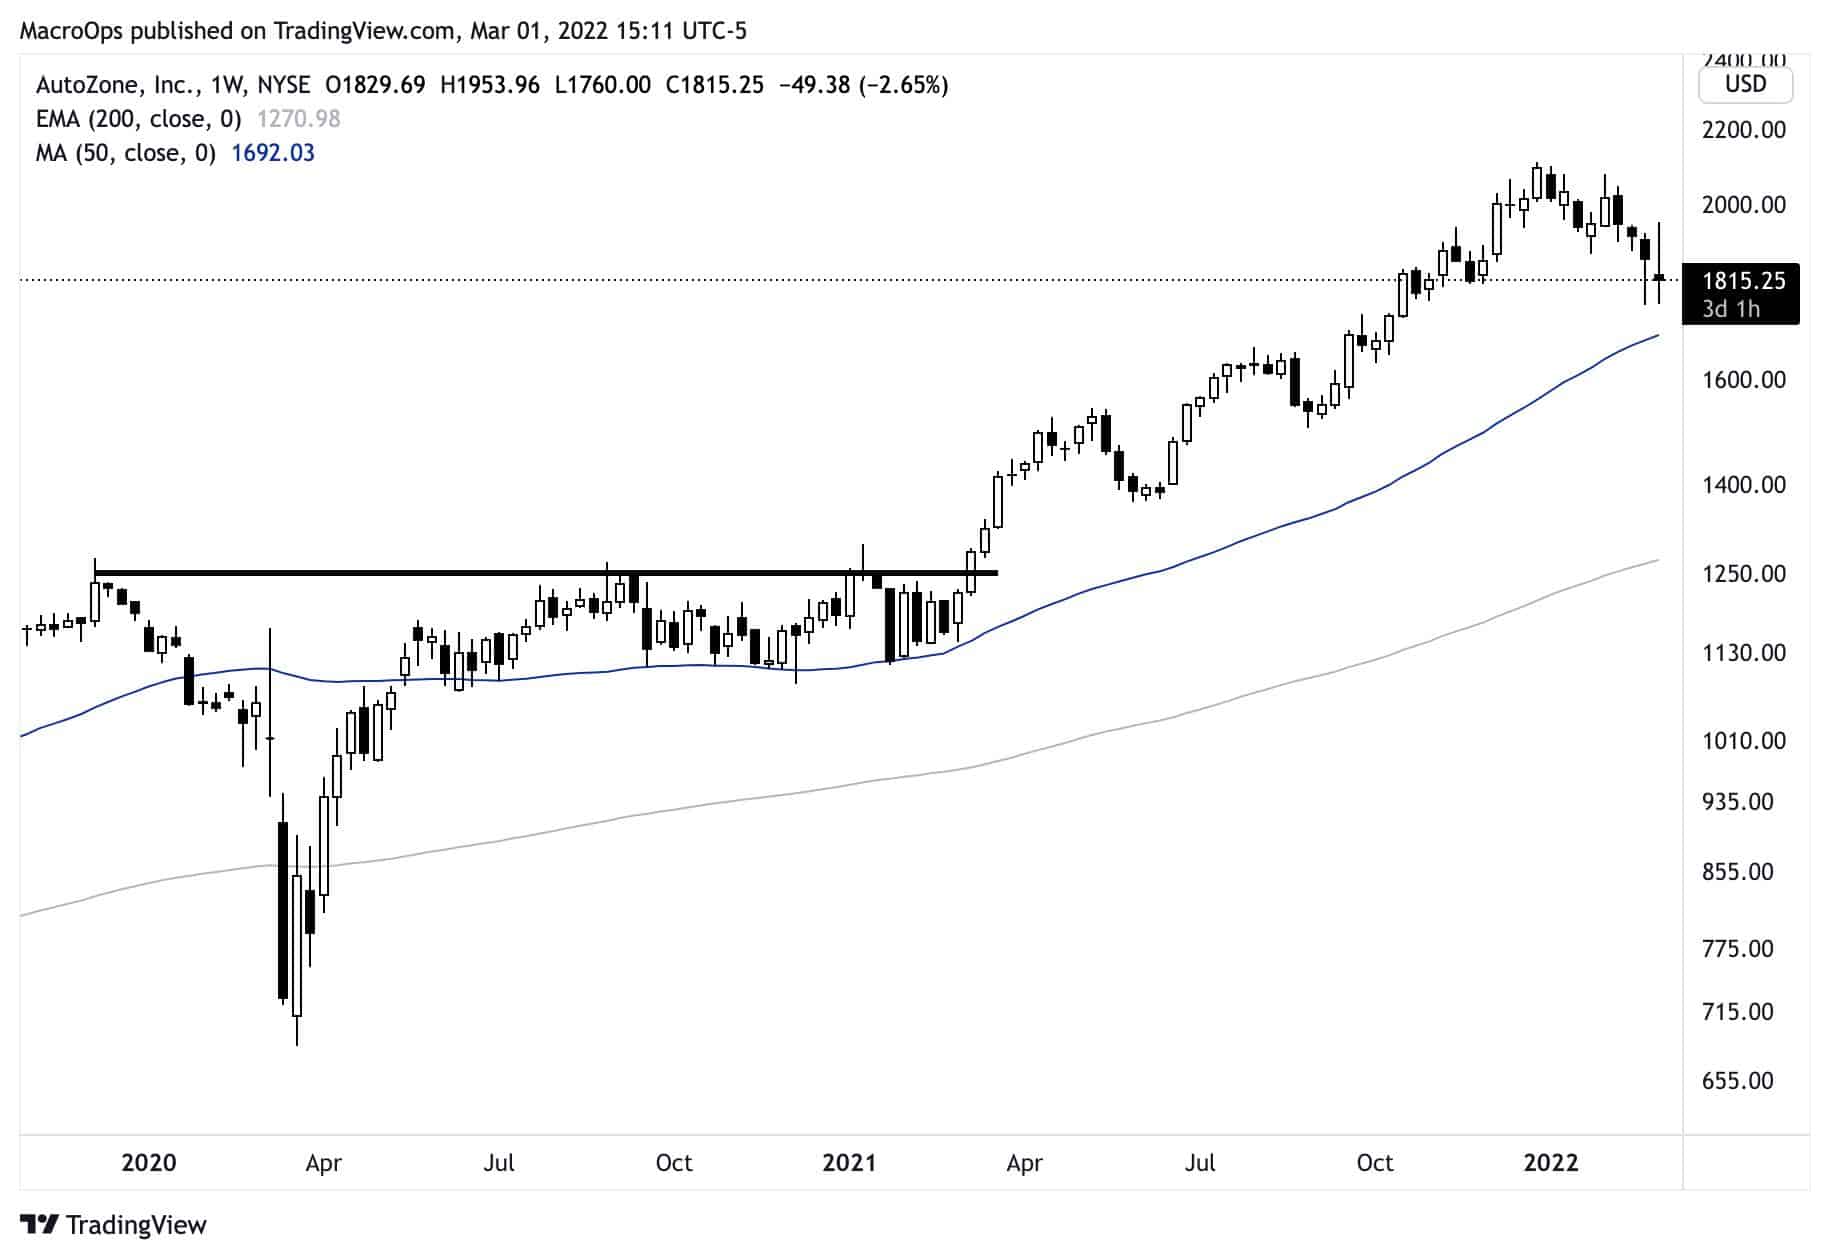
Look at the line I drew on the chart. What do you notice about it?
AZO did not print a weekly close above the ~$1,250/share line. That at no point is the point of resistance.
However, notice what happens when AZO does print a weekly close above that resistance line. The stock churns higher and never looks back.
Like the support example, there are two things a fundamental investor can do with this information:
- Buy (or add to) the AZO position
- Hold a current position despite fundamental “overvaluation.”
The technically-understanding value investor might think AZO is expensive when it breaks resistance … But they wouldn’t sell.
Why? Because breaking resistance gives more weight to the probability of higher prices in the future.
Let’s use POWW as a recent example of support and resistance (disc: fund(s) controlled by the author hold a long position in POWW as of writing).
Check out the daily chart below.
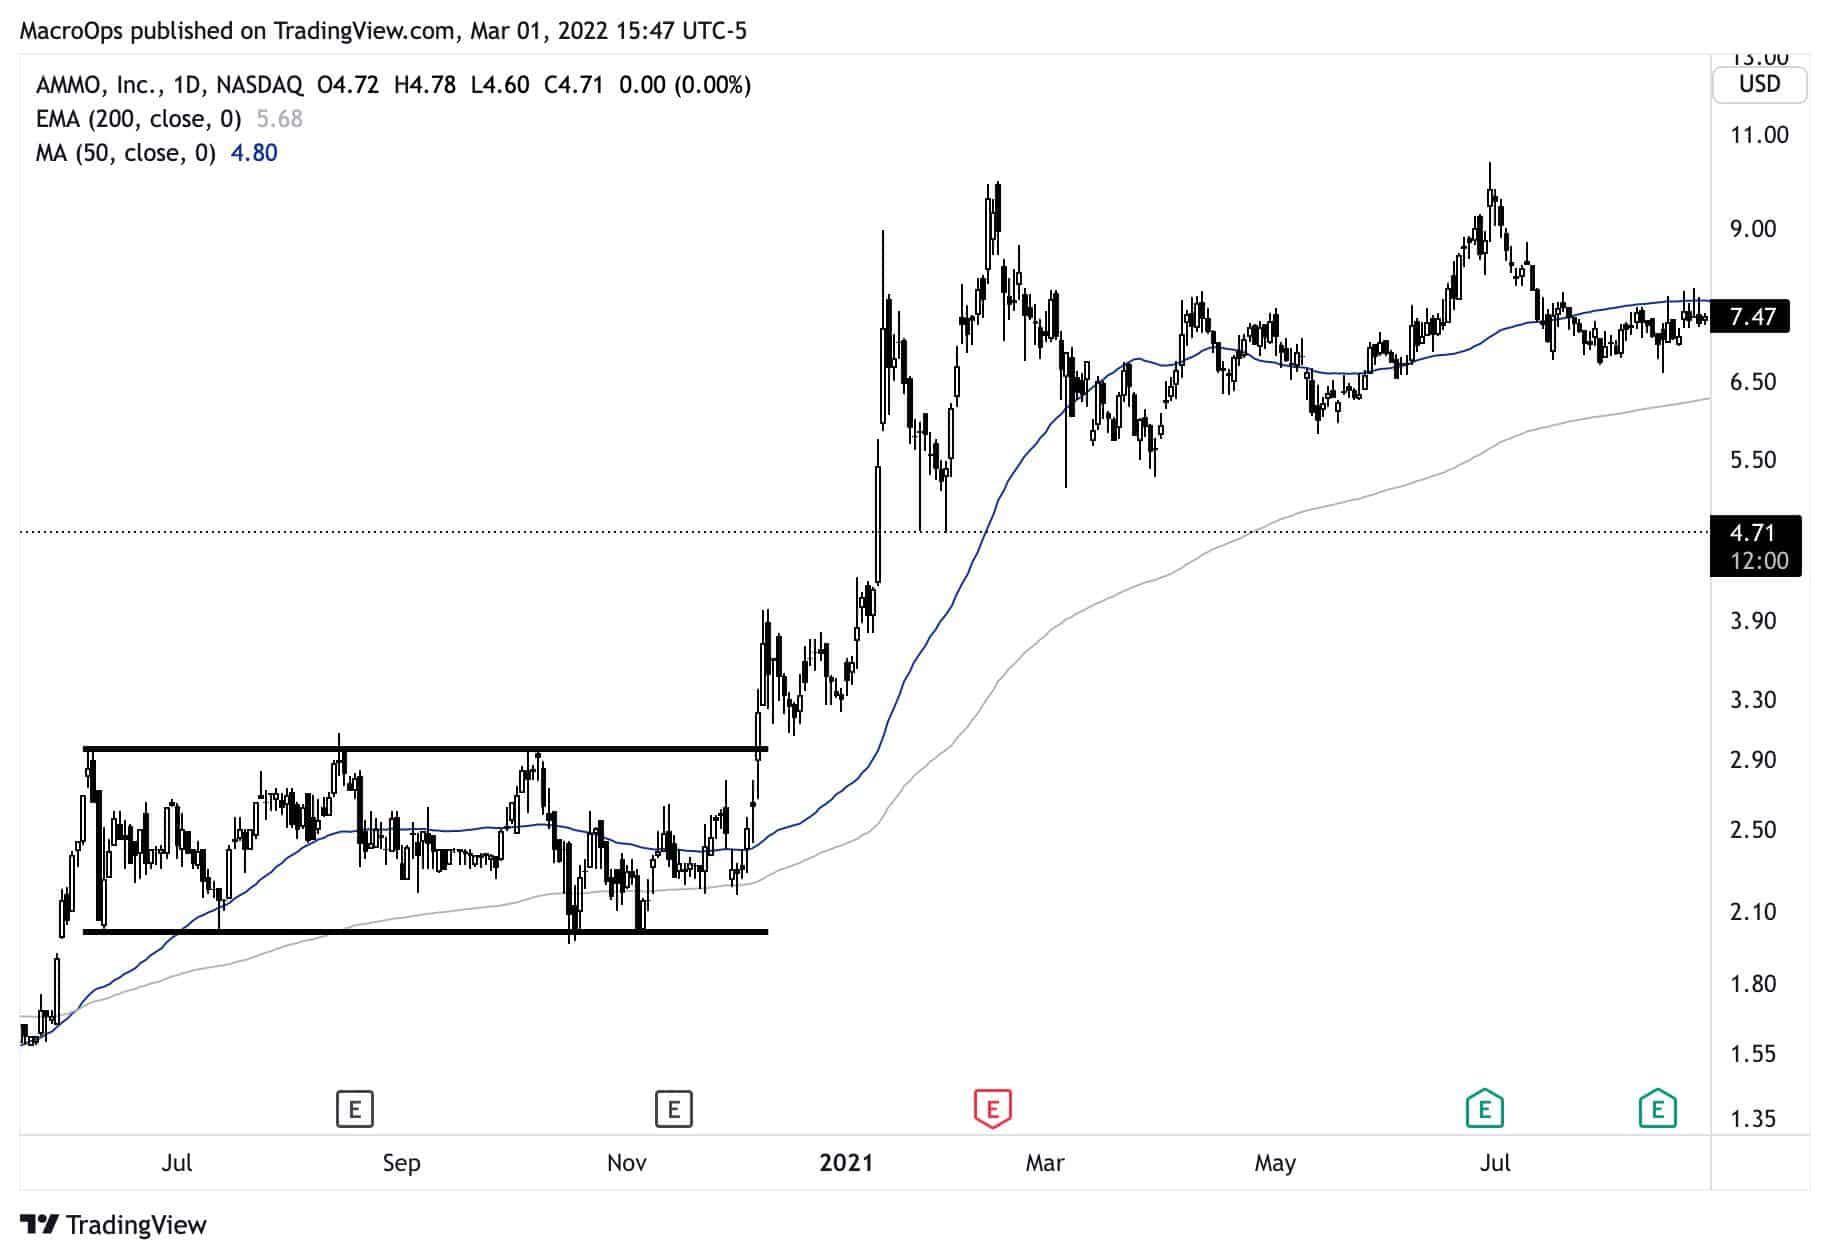
POWW spent 128 days trading between $2/share and $3/share. One day, it breaks its $3/share resistance level and screams higher on its way to $10/share.
That’s great and all … But how do you, a fundamental investor, leverage this knowledge? Again, there are things you could’ve done:
- Buy (or add to) POWW as it closed above its resistance point
- Held onto an existing long position
We can use this chart to explain how using technicals helps a fundamental short-seller. If I’m a short-seller and I see POWW break that $3/share resistance, I’m doing one of two things:
- Cutting any short position immediately
- Waiting for a short entry on a breakdown of support at a higher price point (better Risk/Reward)
Remember, technical analysis like support and resistance DOES NOT need to be complex. The simpler, the better.
Finally, let’s break down my favorite form of technical analysis, Classical Charting.
Classical Chart Patterns
Classical charting leverages geometric patterns that identify support and resistance points on a stock chart to structure trades (entries and exits).
Since we’re keeping this primer basic, there are only four “patterns” you need to know:
- Rectangle
- Cup and Handle
- Head & Shoulders (Inverse)
- Triangles (Ascending/Descending)
I’ve written extensively about the above patterns, which you can read here and here.
The critical thing to remember here is that classical charting helps you see support and resistance points more clearly. Which will allow you to spot those points on a chart more easily over time.
Scroll up to the POWW chart again. That’s a rectangle pattern. The AZO chart? That’s a cup and handle.
The names don’t matter. What matters is that they allow the trader to assign probabilities on how price action might unfold.
Here’s how I would trade both POWW and AZO as a classical chartist:
- POWW: I’d buy the breakout candle above the $3/share resistance line. I would then place a stop-loss below the low of that day’s candle.
- AZO: I would buy the weekly close (Friday) above its resistance level and put a stop-loss below the low of that week’s candle or the week before.
Most importantly, classical charting allows the fundamental trader to Edge Stack technical knowledge onto a chart to create the most transparent picture of potential price action.
Here’s what I mean.
Edge Stacking: Bringing It All Together
Edge Stacking incorporates each of the three TA lessons we’ve learned in this primer. Here’s the workflow:
1. Start With The Moving Average
You want to know two things about a stock at this stage:
- What time frame am I viewing this chart? Daily, Weekly, or Monthly?
- Is the stock price above or below my critical moving average (20D, 50D, 200D)?
This is crucial in the workflow because it should dictate the bias you assign to potential future price action.
Remember, a stock below its key moving averages tends to continue lower. A stock above its key moving average tends to move higher.
2. Identify Support and Resistance Points
Again, you want to identify three things about a chart at this stage:
- Where is the support line (or price)?
- Where is the resistance line (or price)?
- Which point is the stock price headed towards, support or resistance?
This is where we can Edge Stack our TA knowledge. If a stock is trading below its key moving average, we should look for prices reaching support levels for either a reversal buy or a sell if it breaks that point.
On the other hand, if the stock is above its moving average, we should look for prices reaching key resistance points for new buys (or adds) or exit any short positions.
3. Use Classical Patterns To Structure A Trade
Finally, structure the trade (either long or short) via a classical charting pattern. This could be a rectangle, head and shoulders, or cup and handle.
Remember, the point of classical patterns is to identify entry and exit positions to create a profitable risk/reward setup.
Conclusion: Building On This Foundation
We only scratched the surface of technical analysis in this primer. But that was the point. If you’re a fundamentally-driven investor, you don’t need to learn everything about TA.
Remember, a stock chart is just a visual representation of millions of market participants’ emotions, desires, and psychologies.
How is that not a valuable piece of information?