Most of you reading this know I love finding great businesses trading at great prices. You know, the “classic” fundamental investor type stuff.
However, another passion of mine is trading classical chart patterns. And I know, charts and fundamentals are like angry uncles that won’t pay up for an old gambling debt against one another. They don’t jive.
I disagree. Classical charting is another tool in the toolkit we can use to analyze markets, sentiment, and human psychology.
With that said, let’s see how the strategy performed this year.
The Classical Charting Breakout Strategy trades — you guessed it — classical charting patterns. We’re talking rectangles, triangles, Head and Shoulders, and Cup and Handles.
That means we trade breakouts, not reversions. We want to catch the right side of the trend and ride it towards a predetermined profit target.
The following trades were featured in our Macro Ops Collective private Slack channel #classical-charting throughout 2021.
We make two decisions as classical traders:
- When to buy
- When to sell
Let’s start with the first decision. Buy signals are a function of a stock’s breakout from its pre-determined pattern boundary line. For example, a stock traded between $8-$10 for weeks only to escape beyond $12.
There are two ways to approach our purchase decision. On the one hand, we could buy the breakout as soon as it trades through our pre-determined pattern boundary line. The above example would mean placing a buy stop order at $12 and letting the stock pull us into the trade.
On the other hand, we could take a more textbook approach and wait for at least a 2-3% breakout from the chart pattern boundary line before entering the trade. You see this rule in Edwards & McGee textbooks and Aksel Kibar’s TechCharts service.
Then there’s the sell decision. Classical breakout traders have two sell decisions:
- Where to place the initial stop-loss
- Where to set the profit target
Let’s focus on the initial stop-loss. There are two places for our initial stop-loss:
- A tick below the lows of the current day’s candle
- A tick below the lows of the previous day’s candle
That’s it. Usually, this falls between 2% – 5% from our entry price.
Now that we have the basics out of the way let’s dive into the 2021 data.
Overview of The 2021 Classical Charting Trading Protocol
We started tracking the Protocol’s trades in August of 2021. While it is not a full calendar year’s worth of transactions, we have over 150 documented trades.
For example, we logged 155 trades during the year. Thirteen (8.3%) of the 155 trade alerts remain outstanding (i.e., haven’t reached profit targets nor initial stop loss target).
So how did we do? Here are the quick stats (on closed trades only):
- Total R Return: +49.12R
- Total Winning Trades: 37
- Total Losing Trades: 105
- Win Rate: 26.06%
Non-traders won’t recognize “R Multiple,” so let’s define it quickly. “R” is simply the amount you risk of your trading capital per trade.
For example, “1R” means you risk 1% of your trading capital per trade. Our Trading Protocol assumes a 1R risk per trade. That means the above result indicates a 49.12% cumulative R return for the Trading Protocol (49.12 *1R).
Quick aside — there are different ways to use R multiples. Peter Brandt says that he risks between 25-30bps per trade. In Peter’s case, 1R might mean 30bps of actual risk. Using the above results as an example, if 1R = 50bps, the Protocol would generate a 24.56% return (49.12 * 0.5).
There are a couple apparent revelations from the above data. First, the strategy has a meager win rate. This means we rely on a fraction of our trades to make our bottom line. This is the Pareto Principle at work, where (literally) 26% of our trades combine to get us our 49.12% return.
How can we do that? Two ways:
- Low losses (capped at 1R if possible)
- High R multiple profitable trades thanks to a tight initial stop-loss
The data backs up the above claims:
- Average Stop-Loss % Distance From Entry: -2.52%
- Average Initial R Multiple: 4.41
- Average R Multiple Per Win: 4.47
- Average R Multiple Per Loss: -1.09
Let’s highlight a couple of things. First, we placed our initial stop-loss 2.52% below our entry on average. That is a tight stop-loss and explains our low win rate.
However, an initial stop-loss close to our entry allows us to capture big wins when the chart works in our favor. We see this from our average R multiple on winning trades of 4.47 (or 4.47x our initial risk).
How could one tweak the above strategy to achieve different results? You could widen the initial stop-loss. This would reduce the number of losing trades (raising the win rate) and decrease the average R multiple on winning trades.
Most traders won’t discuss one aspect of these strategies: win and loss streaks. Our Trading Protocol had its share of stripes.
For example, the Protocol experienced 4 instances of a 4-trade losing streak. Then there were the 3 instances of a 5-trade losing streak. Not to mention the 7-trade and 10-trade losing streaks throughout the year.
It’s easy to document these streaks in hindsight — knowing the end result was +49.12R — but it’s impossible to translate the emotional toil a streak like that takes on a trader’s mental psyche.
Next, we’ll highlight a few “outlier” trades during the year – trades that resulted in both massive upside and downside.
The Outlier Trades: Pareto At Work
Remember, the average R multiple on winning trades was 4.44R. The average multiple for losing trades -is 1.05R. Three trades bucked the averages big-time. They were:
- August 23 Long Bill.com (BILL): +14.19R
- August 27 Long Yandex (YNDX): +9.54R
- August 30 Long Tesla (TSLA): +8.90R
And here is the outlier short trade:
- August 23 Short MiMedx (MDXG) GroupL -10R
For context, the profitable outlier trades were ~2.44x more profitable than the average winner. However, the outlier loss was 10x more significant than the average loss.
Let’s unpack the outlier winning trades. First, each outlier had very tight stop-losses.
The average distance from entry to stop-loss was -1.87%. Of course we had good luck, too. BILL, for example, gapped up on strong earnings, allowing us to book the +14R gain. However, the knife cuts both ways. MDXG gapped down to give us the 10R loss.
Check out the YNDX trade below.
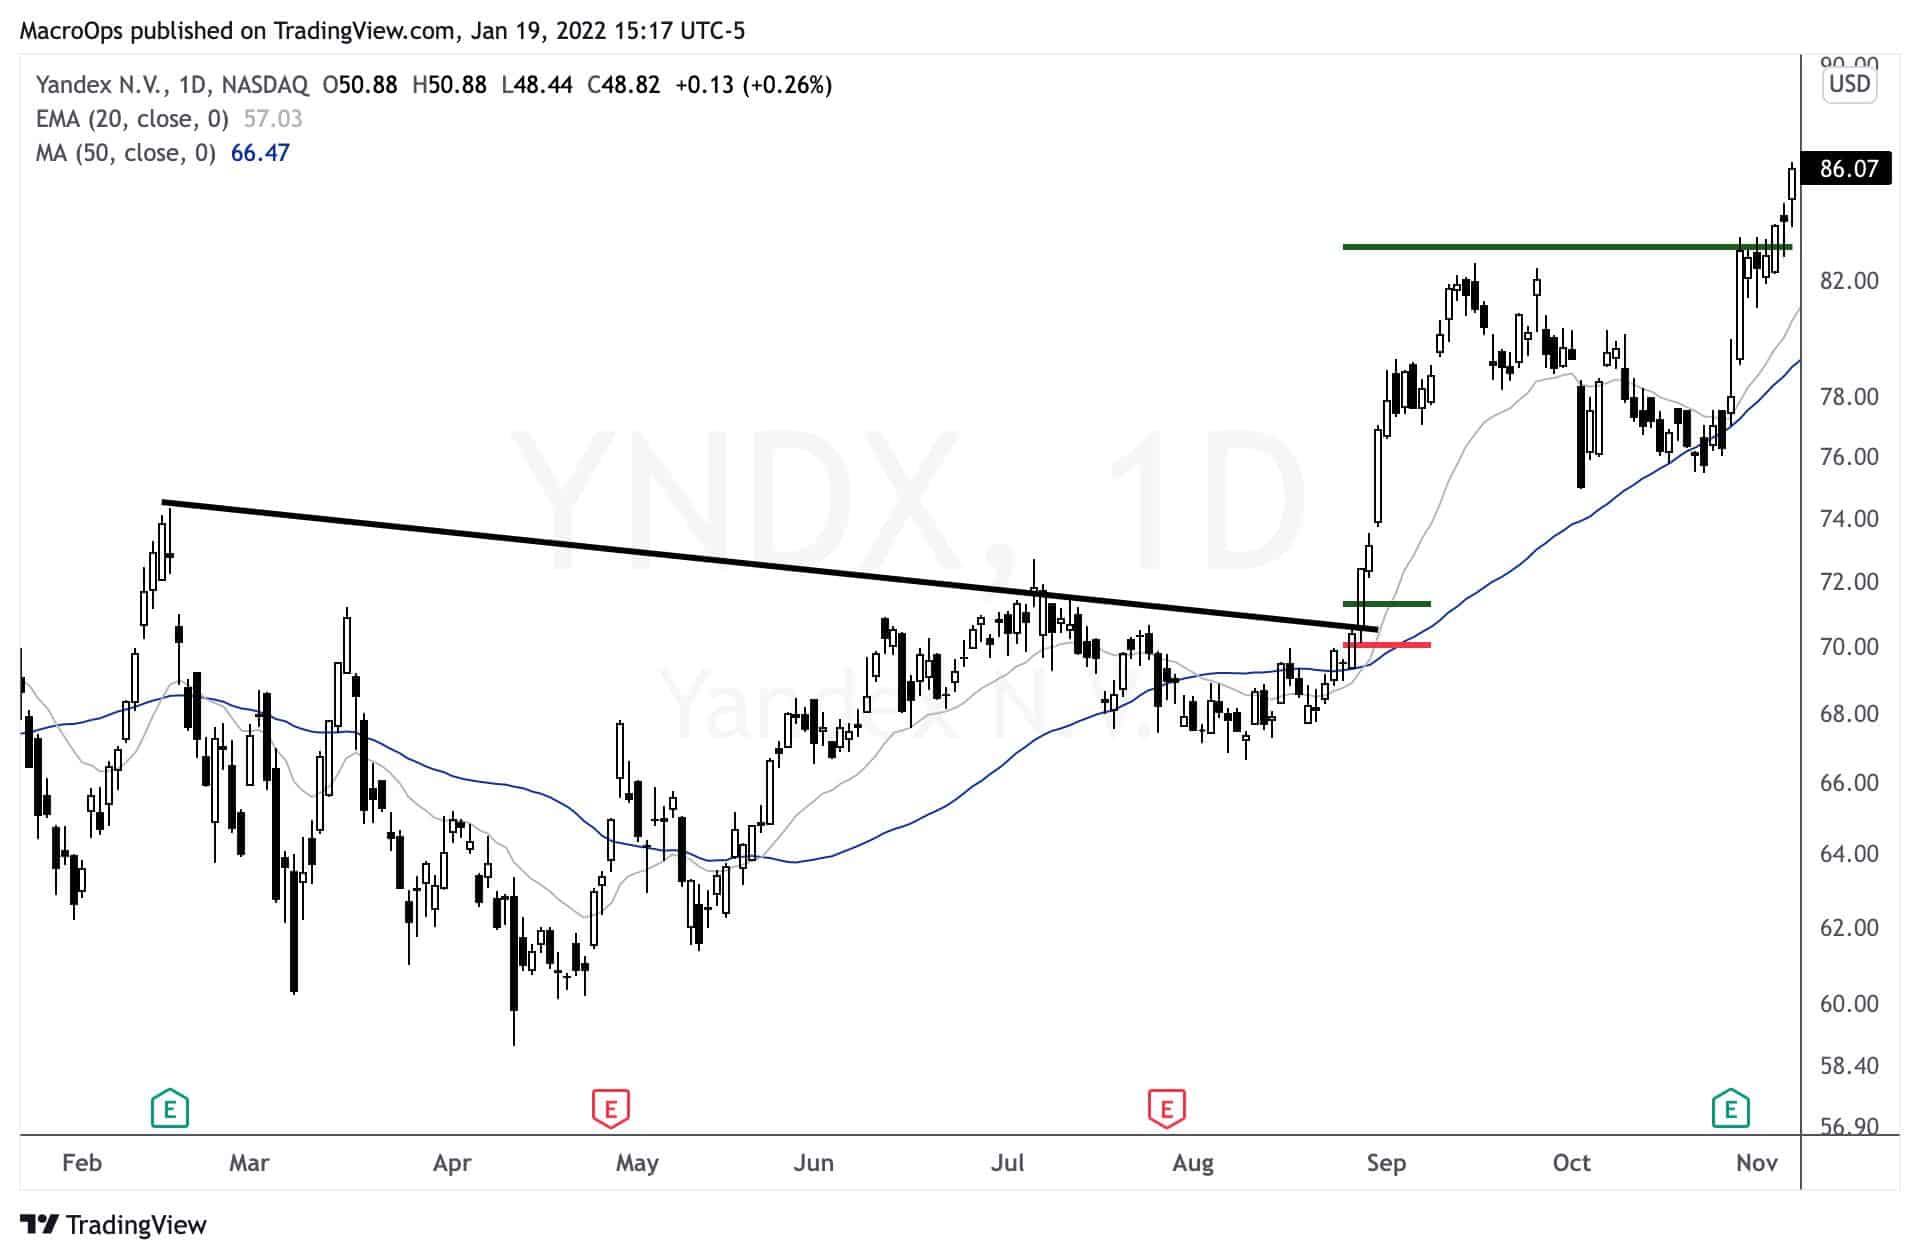
Note how close we had our initial stop compared to our profit target location. In essence, we’re risking $1.25/share for a potential $11.92/share gain. That’s the power of this trading strategy. When it works, you can bag big gains.
Let’s examine another profitable trade, Penske Auto (PAG), which you can see below.
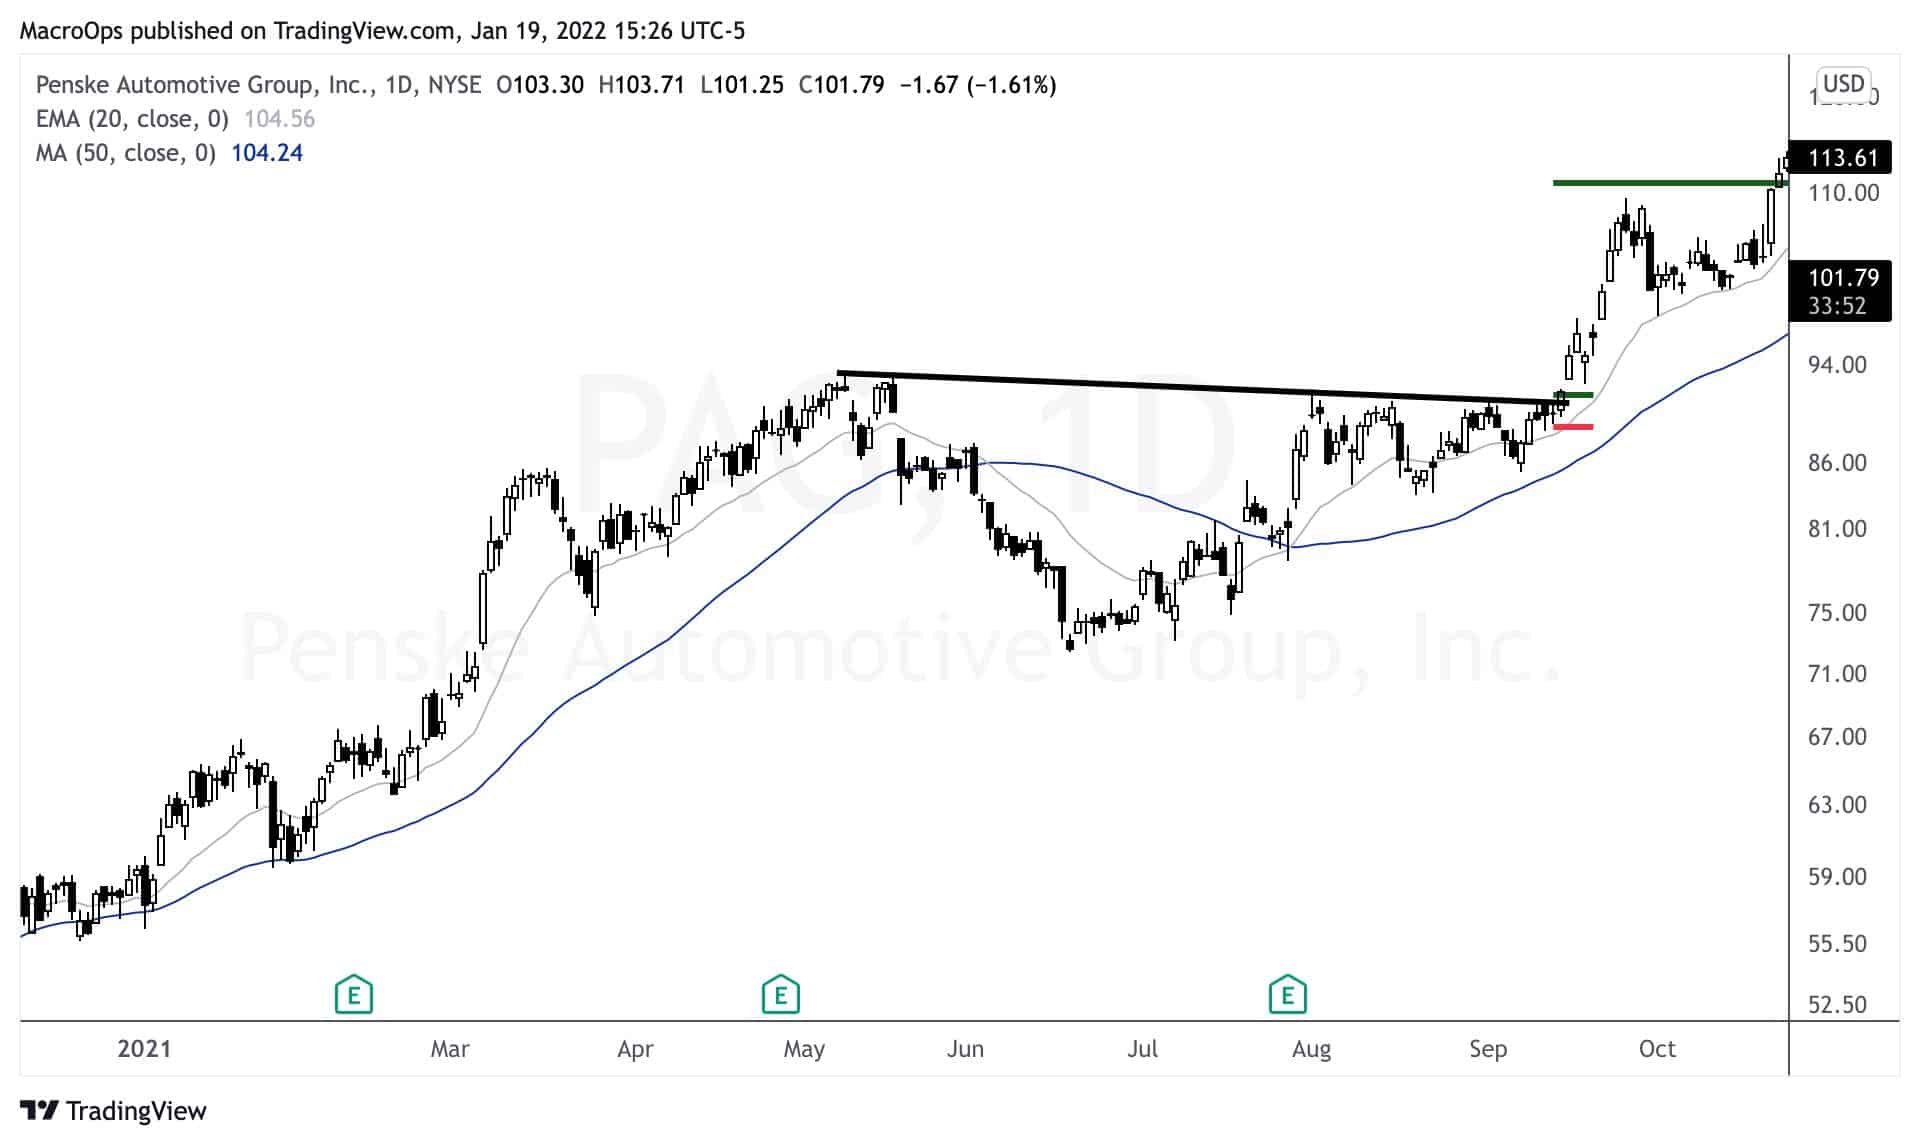
PAG was a +7.51R winner.
Notice how both YNDX and PAG were cup-and-handle pattern winners. Which begs the question, what were the results of each classical charting pattern? Let’s find out.
What Were The Best Patterns From The Protocol?
We trade classical charting patterns like rectangles, Head and Shoulders, Cup and Handles, etc. Here are our five most popular patterns (based on frequency):
- Symmetrical Triangle: 22.31%
- Inverse Cup and Handle: 22.31%
- Cup and Handle: 14.62%
- Rectangle: 7.69%
- Ascending Triangle / Head and Shoulders Top: 6.92%
I’m surprised by the frequency of symmetrical triangle trades. In theory, I prefer patterns with horizontal boundary lines. Horizontal boundaries provide cleaner entries while making identifying support and resistance levels easier.
Anyways, let’s see how each pattern did during the year. Here are the three top performers and three bottom performers (based on average R return):
- Rectangle: +2.36R
- Bull Wedge: +1.24R
- Cup & Handle: +0.74R
- Wedge: -1R
- Ascending Triangle: -0.94R
- Head & Shoulders Top: -0.14R
We can also bucket our returns based on the stock’s market regime. We classify regimes as either:
- Bull Quiet
- Bull Volatile
- Neutral
- Bear Quiet
- Bear Volatile
Steve, one of our MO HQ team members, ran the numbers. First, check out the distribution of total trade returns based on market regime:
![]()
We took most of our trades in Market Neutral/Bull Quiet regimes, which makes sense. However, I’m surprised to see the number of trades (28) we took in Bear Volatile regimes — and the fact that those returns skew positive. While we only took 3 trades in Bull Volatile regimes, they skew negative.
Next, Steve broke down the Protocol’s trades by long or short. Here are the data from the long trades:
![]()
There are a couple of insights we can extract from the data.
Predictably, long trades in bull market regimes (whether blended bull or bull quiet) did better than long trades in bear market regimes. This makes sense as we’re swimming with the tide, not against it.
Then there are the short trades:
![]()
The most exciting part of the above data is that short trades did better in market Neutral regimes, not bear volatile or bear quiet.
One hypothesis is that we shorted at the intersection between Market Neutral and Bear Quiet regimes. In other words, we are short at the point where the market shifts from Neutral to Bear.
Of course, we’d book this trade as a short in a Market Neutral, potentially muddying the underlying data.
Concluding Thoughts & 2022 Protocol
Though a shortened trading year, the Classical Charting Protocol performed well.
That brings us to 2022. We’re excited to have a full year of trading data in a different market. One that — so far — appears more challenging for classical chartists than the prior year. We have no expectations for the Protocol’s performance.
Remember, the only thing we can control is our process: our entries and stop-loss placements. That’s it. We know that this strategy works despite a low win rate. The data we captured in 2021 allows us to endure blood-curdling losing streaks we’ll inevitably face in 2022.
There are a few tweaks I’m going to make in my trade alerts. First, I’ll choose patterns with breakouts closer to the 20MA on the daily time frame. This will prevent buying overextension – which plauged most of our losers.
Second, I’ll lean into the market regime and let that guide the trade alert. For example, I won’t post a trade about a potential short setup in a Bull Quiet regime.
That’s the best part about classical trading. You can mold it, make it your own.
I hope this blog post expanded your horizons on the different ways traders/investors can make money in markets. Consider adding basic classical charting principles to your toolbox if you’re a fundamental investor.
Until next year!