We hosted Siblings Thanksgiving tonight because visit different extended family on the actual day. I had a blast, ate great food, and didn’t think about NVDA once.
Then everyone left, I opened Twitter, and BAM … it’s NVDA earnings everywhere. I can’t scroll more than one thumb length without seeing something about NVDA’s earnings report. The Qs are up, of course. Maybe I get stopped out on my short overnight, we’ll see.
Before I continue, I want to mention that I don’t care about NVDA at all. I’ve spent the past two years diving deep into the metals and mining space. I am the farthest thing from an NVDA/chips/AI/data center expert.
But I do care about cash flows, accounting, and learning why not all growth is cash flow positive (read: shareholder accretive).
In 2020, I wrote a two-part series called Cash Flow: It’s All That Matters (read part 1 and 2). The series explored the Georgia Institute of Technology’s famous (and invaluable) paper Cash Flow Analysis
Modified UCA Cash Flow Format.
In part 1, I argued that we should focus more on the cash flow statement and less on the income statement. And by going through each case study, we could spot the differences a cash flow approach can make on analyzing a business’ true cash-generating capabilities.
In part 2, I introduced two key frameworks from the paper: Operating Cushion and Core Operating Growth Profile.
Operating Cushion is the percentage difference between your Gross Margin % and your SG&A %. In English, it’s the contribution of a $1 increase in revenues to operating profits. Core Operating Growth Profile is then the Operating Cushion less Working Capital Requirements (represented as a % of revenue).
I won’t rehash the details here. Just go read parts 1 and 2 and come back.
Here’s how all of this relates to NVDA’s latest earnings. After everyone left, I opened my phone to this tweet.
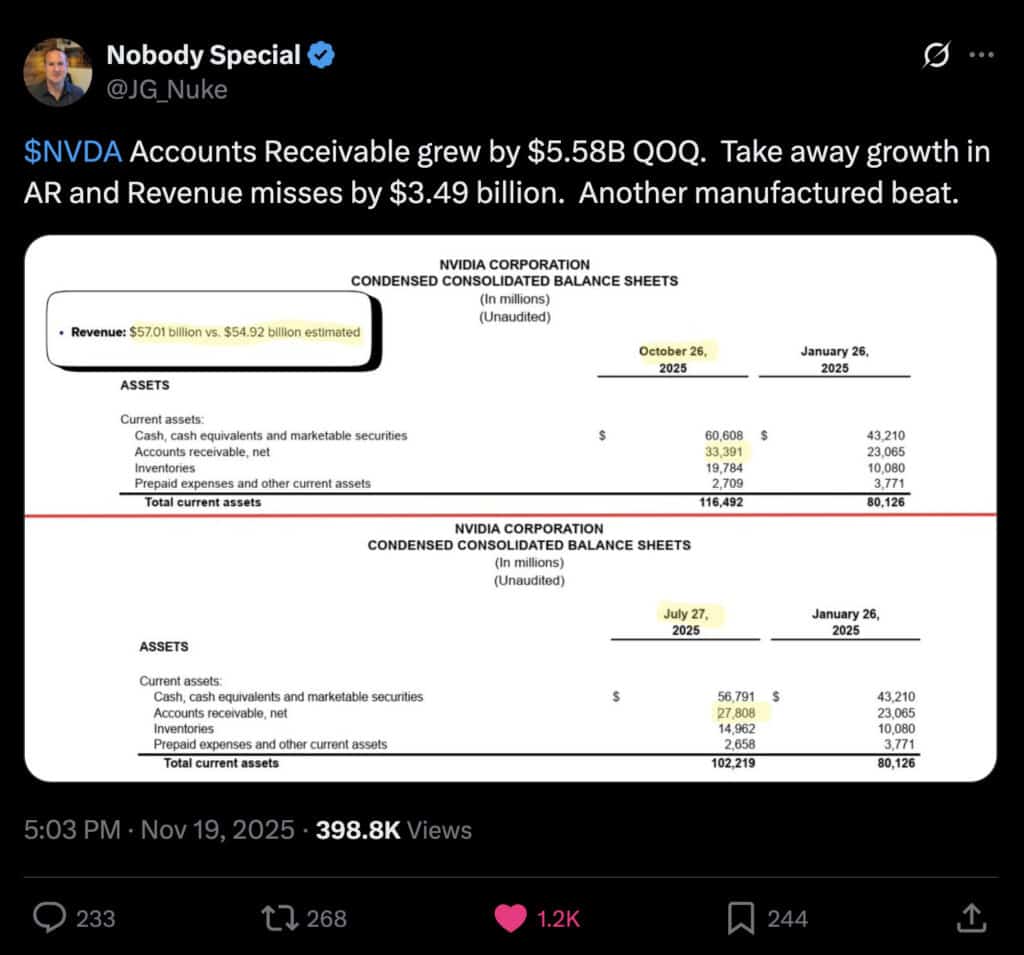
It has 1K+ likes, ~400K impressions, and hundreds of comments confirming or denying whichever NVDA bias you entered the tweet with.
I love this tweet. Not because I 100% agree with it or because I’m an NVDA bear (I’ve already told you I don’t care, remember). But because it offers me a chance to put my Cash Flow Variance Analysis to work!
NVDA’s Q3 2025 Cash Flow Variance Analysis (QoQ)
Normally I’d perform CFV Analysis on a YoY basis, but it still works with @JG_Nuke’s QoQ timeframe.
The first step in CFV Analysis is to calculate Operating Cushion (see below).
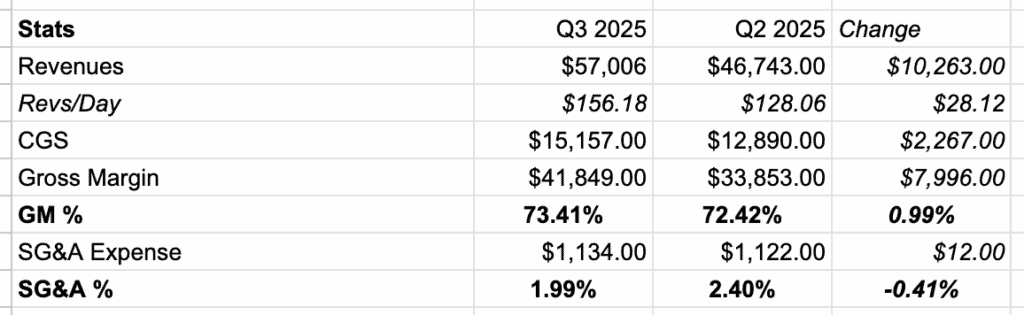

That’s a fantastic operating cushion margin. In fact, we could stop there and declare, “Of course NVDA is worth two Canadas, one Brazil, and three Kim Kardashian startups combined!”
But that’s not the entire picture. We need to transform Operating Cushion % into Core Operating Growth Profile (or COPG).
This is where @JG_Nuke gets all hot and bothered because we account for things like A/R, A/P, and inventory growth (or shrinkage). We’re measuring two things here:
- Rate of change in absolute dollar values.
- Rate of change on a “Days” basis.
Check out the Balance Sheet/Working Capital data below.
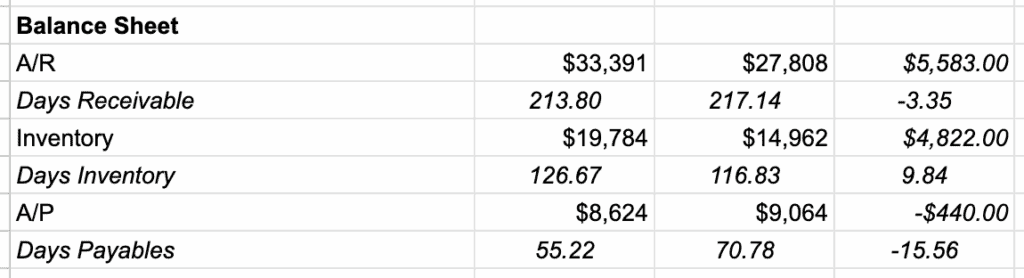
There’s the $5.58B increase in AR from the viral tweet. But wait, we also see a reduction in Days Receivables from 217 to 214. Granted, a 3 day reduction from 217 days is still not good! But it at least provides a more complete picture than simply stating “AR up $5.58B = bad.”
We can break down the $5.58B AR cash outflow impact into two categories:
- Cash Impact from Revenue Growth
- Cash Impact from Days Receivable Change
Here are the results.
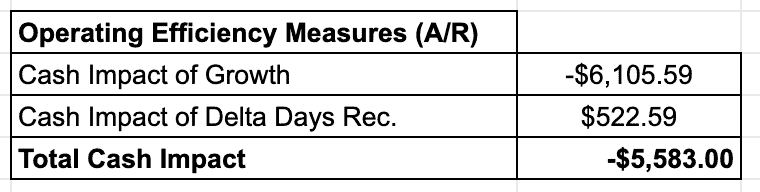
The ~3 day reduction in AR saved $522M, but NVDA’s revenue growth still resulted in a $6B negative cash impact (i.e., cash outflow).
We run the same exercise for inventory and AP (see below).

Inventory saw negative cash impacts from revenue growth and increased Days Inventory, fueling more flames on the “NVDA is channel stuffing” theory.
The final step is turning all the working capital measurements into percentages of revenue, which I’ve done below. Now we have our Core Operating Growth Profile Margin %. This tells us how much cash a company will keep (or lose) for every $1 of incremental revenue growth.
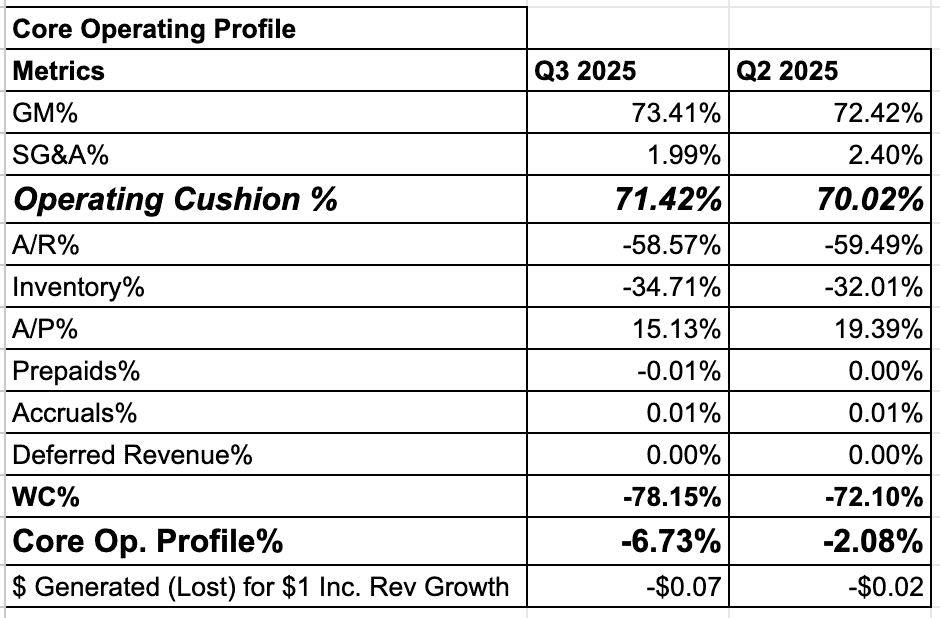
This is where things get interesting. Sure, the company has a 71% operating cushion. But that cushion is more than 100% consumed by its working capital requirements, leaving no room for cash generation.
Putting It All Together: Total Cash Impact of Growth + Change
The final step in our Cash Flow Variance Analysis is analyzing the Total Cash Impact of Growth and Change. In other words, what levers drove the greatest positive/negative cash impact?
There are two main buckets: Profitability Measures and Operating Efficiency. Both of which bifurcate into two more buckets: Growth and Change (or delta).
Here are the Profitability Measures.
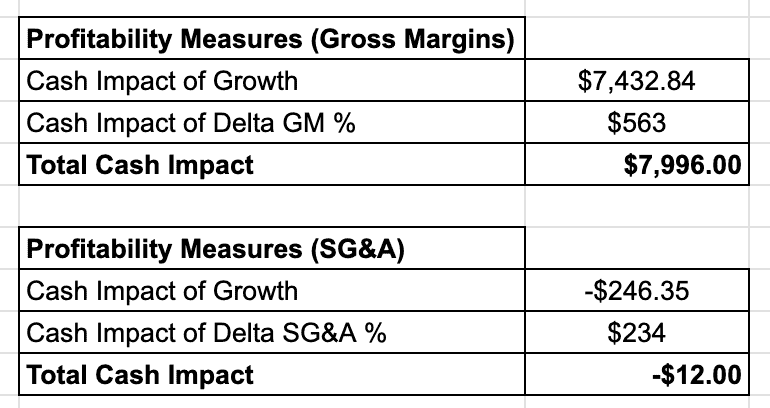
Growth generated $7.2B in positive cash impact and Change generated $798M in positive cash impact. All good things!
But remember, the balance sheet is where things get rough. Check out the Operating Efficiency Metrics.
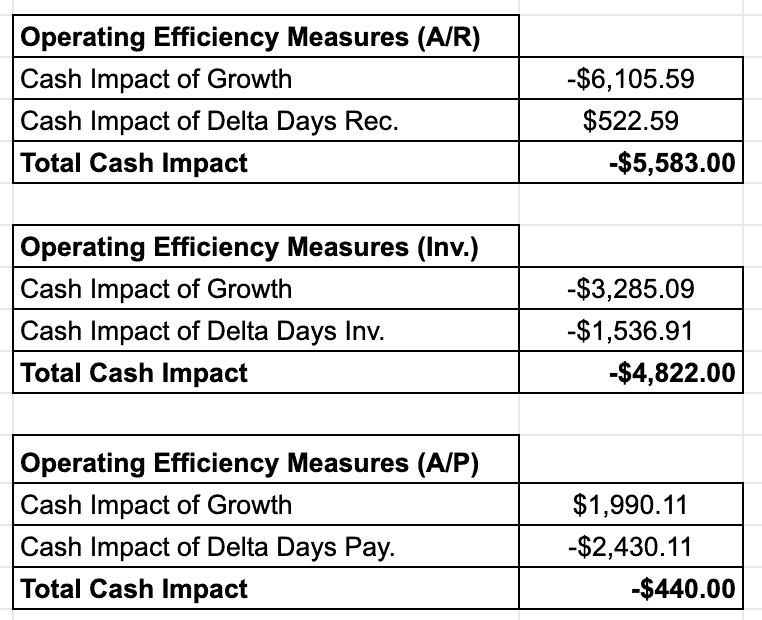
Growth resulted in a -$7.4B cash impact with -$9.3B in AR and inventory, offset by ~$2B in AP growth. NVDA picked up $522M in cash impact from reducing AR days, but that was more than offset by the increase in Inventory Days of $1.54B and a reduction in days payable for -$2.4B.
Putting this all together and you get the Total Cash Impact of Growth + Change on a QoQ basis (see below).
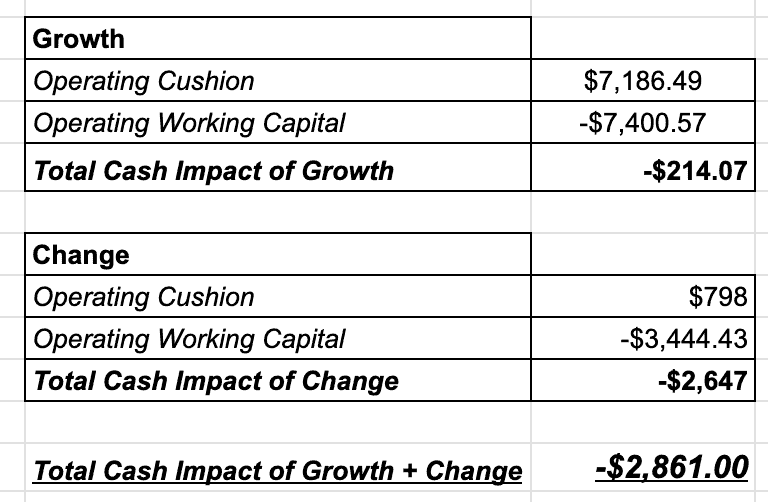
In other words, working capital matters.
Here’s another way to put it. NVDA grew revenues by $10.26B but consumed $2.9B to do it.
The Lesson: Apply Cash Flow Variance Analysis
The takeaway isn’t to short, sell, buy or do anything with NVDA. I don’t care about the stock, and it will probably rip tomorrow.
The goal is to show you how to use Cash Flow Variance Analysis to determine how much cash a rapidly growing company consumes (or generates) via it’s growth.
Maybe this is part of NVDA’s end game … sell enough chips, build enough inventory, give their customers longer credit, in hopes that they dominate their market and use their leadership position to slowly become a cash cow that actually generates cash as it grows, albeit more slowly.
High-growth companies need cash, and there’s often a long period of working capital investment required to satisfy those growth objectives. Just be careful if that growth keeps sucking cash out of the business. Companies are like hot air balloons and cash is like oxygen. Run out of oxygen and you can’t keep the fire burning to keep the balloon flying.
I hope you guys enjoyed this piece.