There’s no asset class too much money won’t spoil. ~Barton Biggs via A Hedge Fund Tale of Reach and Grasp
Good morning!
In this week’s Dirty Dozen [CHART PACK] we look at the latest Global Fund Manager Survey, talk some more about ALL the cash that large funds are sitting on and why that’s bullish for stocks, and then make the case for why rising free-cash flows will drive a reacceleration of stock buybacks in the coming quarters. Plus, we discuss some really interesting charts showing demographic splits and what they could mean for the equity risk premia, plus a whole lot more…
Let’s dive in.
***click charts to enlarge***
- The September BofA Global Fund Manager Survey came out last week. Below is the summary with key takeaways highlighted by me.
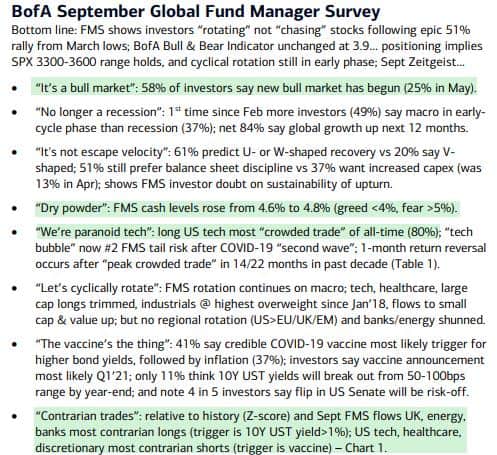
- The UK, energy, banks, staples, and Japan are the contrarian longs.

- Markets are a pendulum swinging from one extreme to another…
- The last few weeks I’ve been noting the wide dispersion in extreme positioning amongst players in this market. Retail and small funds are extremely long while large institutions/hedge funds have missed out on the incredible rally off the March lows and are subsequently sitting on significant piles of cash (as noted in the most recent BofA FMS).
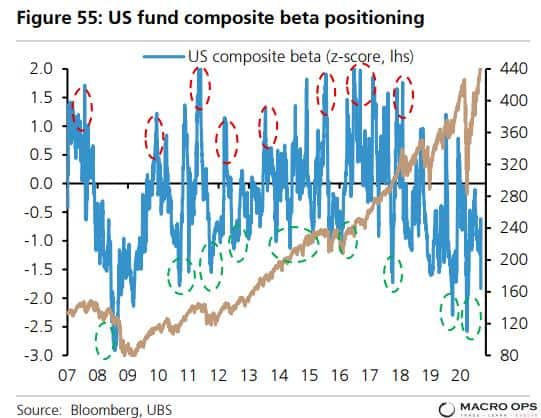
Well, here’s another chart confirming the large piles of cash. UBS writes “US active fund positioning is 1.8stdev below average… Cash levels are still elevated. Institutional money market flows tend to follow the Fed rate with a 1yr lag, and the cut to zero earlier this year should mean more cash flows to equities over coming months. Cash levels are supportive at levels as a % of equity plus bond market cap not seen since 2012.”
This is one of many reasons why the downside in equity markets is likely limited over the short-term and the longer-term path of least resistance remains up.
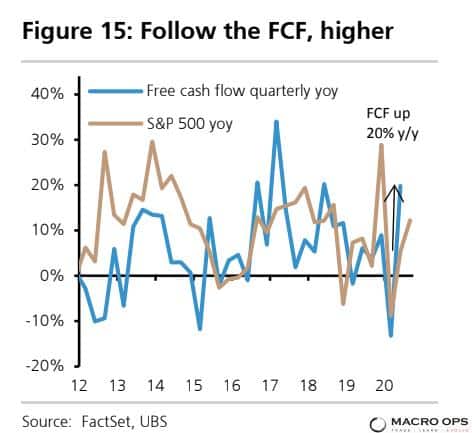
- Buybacks are a key part of our macro equity framework. Buybacks are supported by free cash flows and cheap debt. This is why the below chart is so important. Buybacks have been anemic year-to-date, but with aggregate SPX FCF up 20% YoY we should see that trend start to reverse over the next two quarters (chart from UBS).
- These are very interesting charts from UBS. The chart on the left shows the population growth by cohort (35-55 and 65+) on a YoY basis. As you can see, the 35-55 age group is inflecting higher while retiree growth has peaked and is set to rapidly slow. This is important because the younger cohort tends to own more equities as a % of investment versus the 65+ group which is more heavily weighted towards less risky assets.
The chart on the right shows the correlation between the growth difference of the two cohorts (gold line) and the equity risk premium (blue). If this correlation continues to hold then we should see the equity risk premium — which is currently well above its long-term average — narrow significantly. And since the Fed is unlikely to let yields rise, that means higher equity valuations are in order.

- The last two months I’ve been making the bull case for small-cap outperformance. Here’s a chart from UBS showing the connection between relative small-cap/SPX dividend yields and performance… If history is any guide, we should see small-caps step on the gas soon.
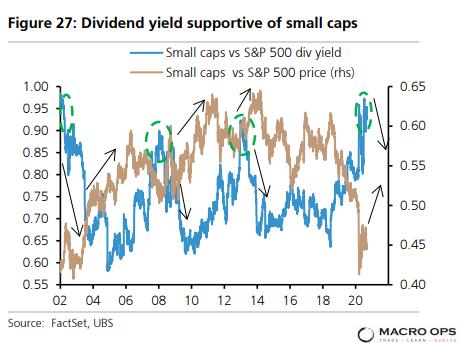
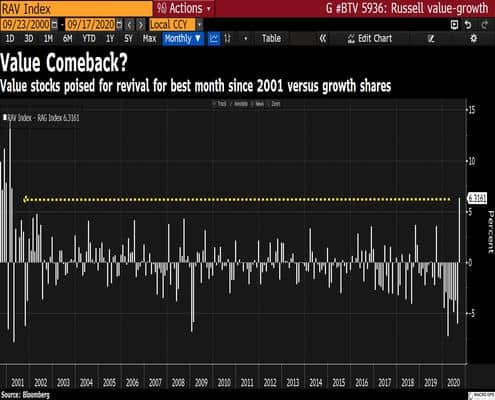
- Small-cap value is my favorite place to look for names right now as both factors should continue to materially outperform over the coming quarters.
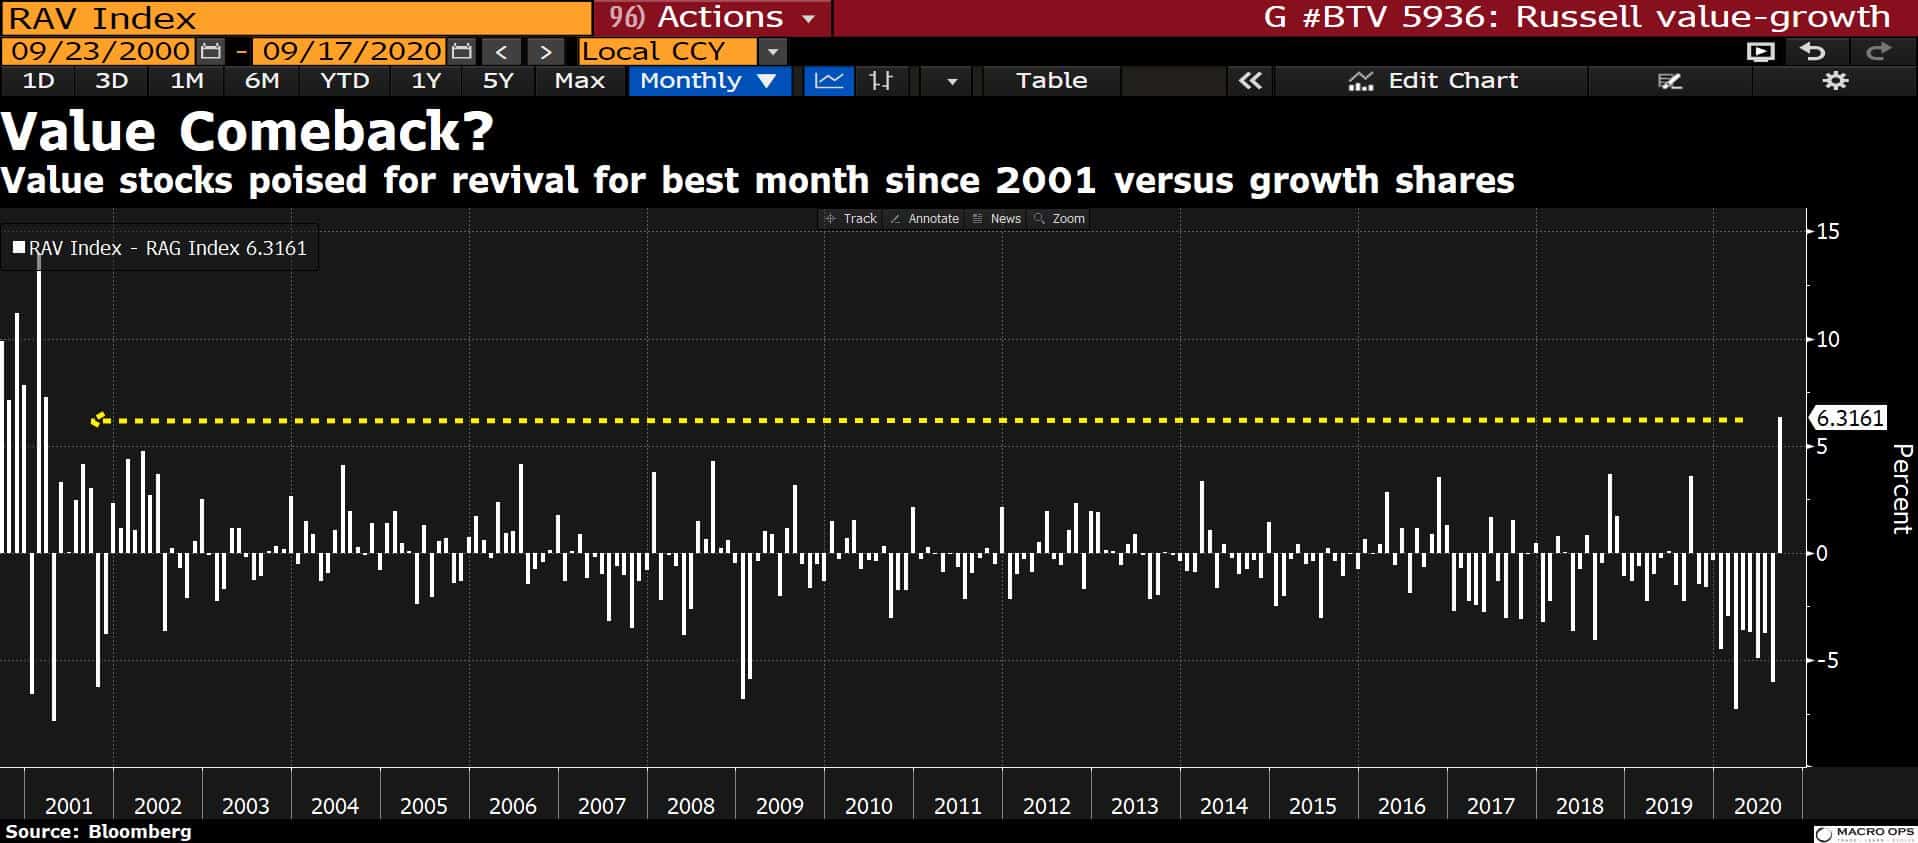
- I’m not convinced that we’re going to see a secular turning point in relative performance though. That would require a sustainable jump in inflation and a steepening of the curve. But we should at the least see a tradeable multi-month reversion play.

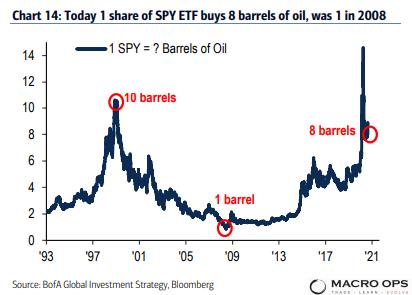
- A lot of value plays are dependent on rising commodity prices. And commodity prices are dependent on the US dollar, which I expect to trade lower over the coming year(s) — although, I’m still looking for that tradeable bounce!
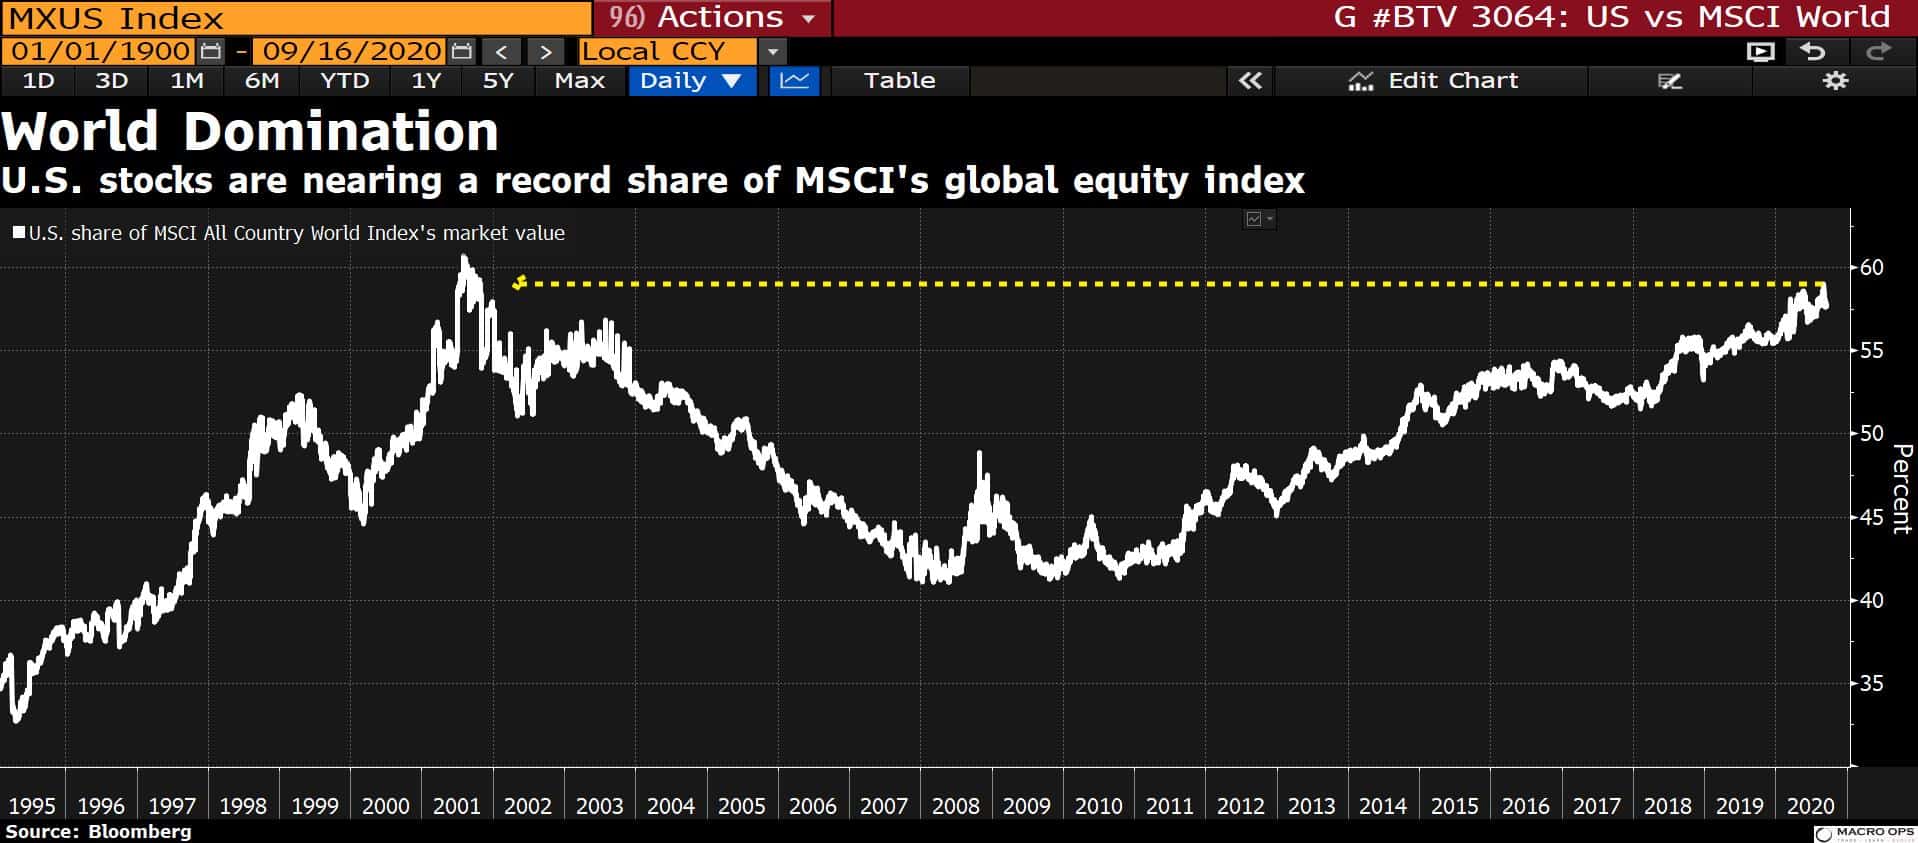
A big part of my dollar bear thesis is the end of Core Domination and a reversion in capital flows from the highly crowded US equity market, back out to the periphery. The chart below shows that US stocks are near an all-time record high as a share of the MSCI global index.
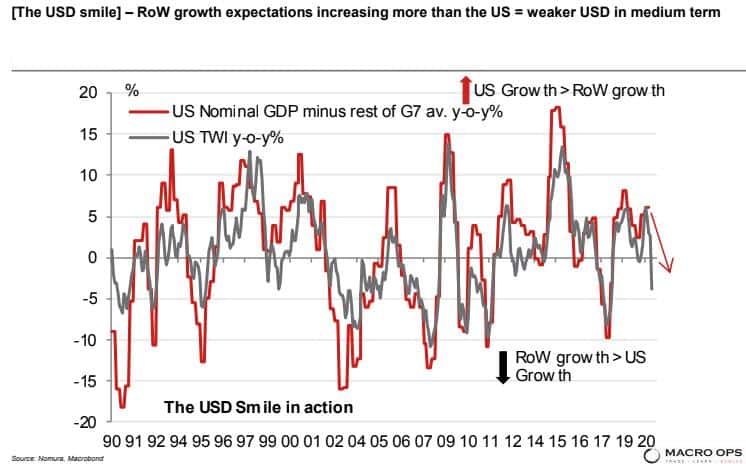
- The USD bear thesis is broadly supported by the relative growth outlook as well. (chart via Nomura).
- But I wonder if relative COVID trends begin to affect the FX majors at all. If you watch the mainstream media, you wouldn’t know it but the relative trends in daily cases are much worse in Europe than they are in the US as of late.
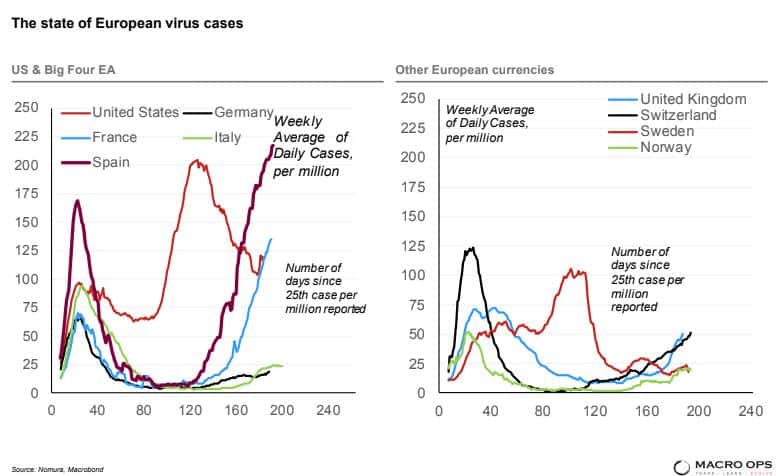
Stay safe out there and keep your head on a swivel.