“There are very few people who can develop the skills to get the edge, and far fewer still who can withstand the losses emotionally and still stick with the system. Probably only one in five hundred people has the necessary discipline to be successful.” ~ Blair Hull
In this week’s Dirty Dozen [CHART PACK] we update the market picture (it’s mixed but the bull trend is still intact), reiterate our bullish USD call, and look at what’s going on with precious metals, plus more…
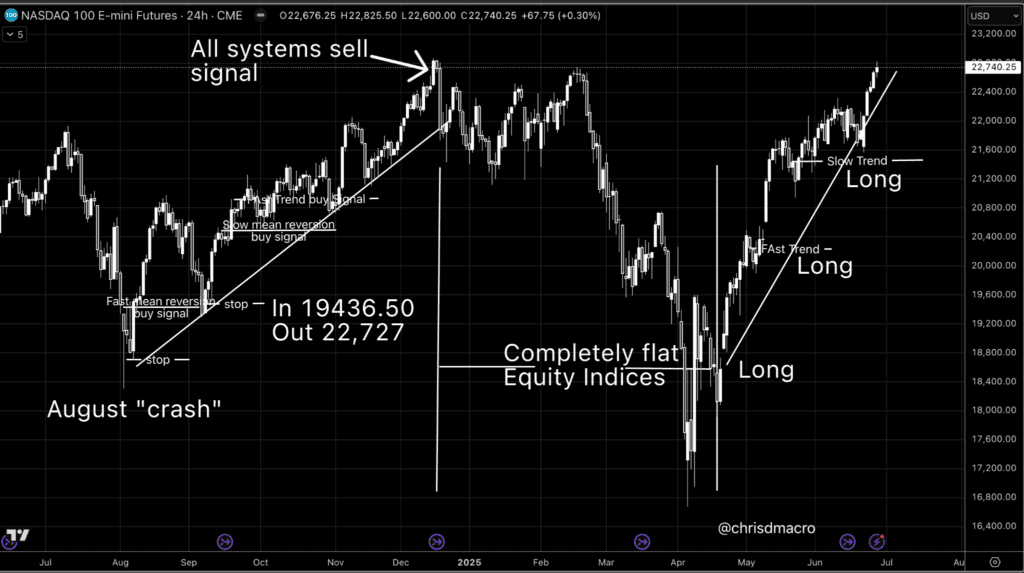
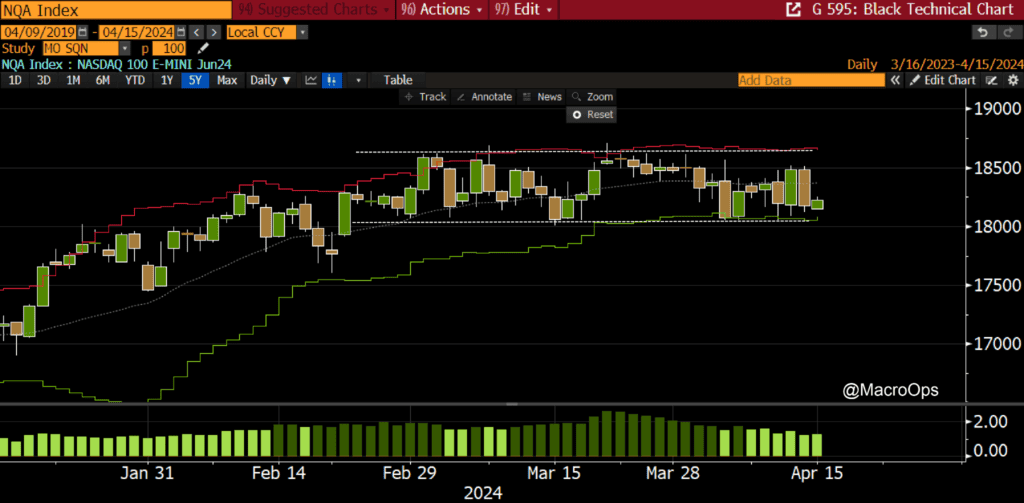
1. The Qs continue trading in their 1 ½ month sideways range. There’s lots of noise right now but just pay attention to the key levels. If the market closes below this range then maybe lighten up on risk. If it breaks above then stay long and add. No need to make this game complicated.
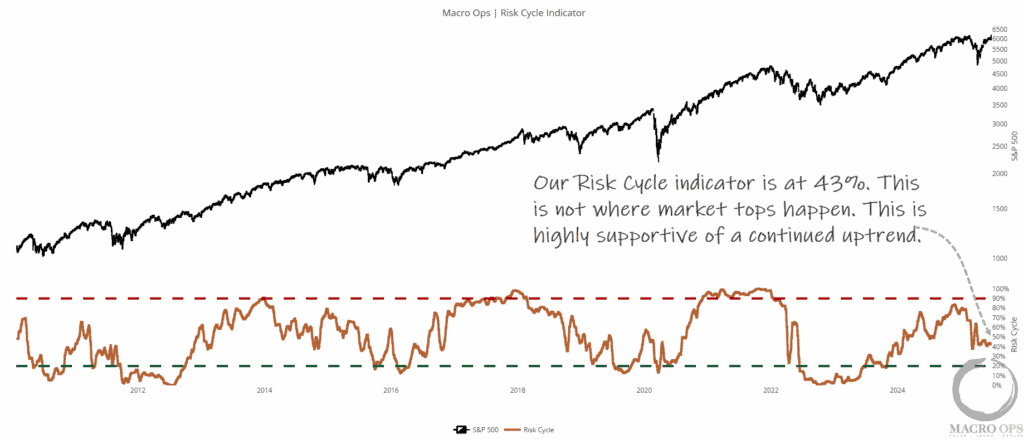
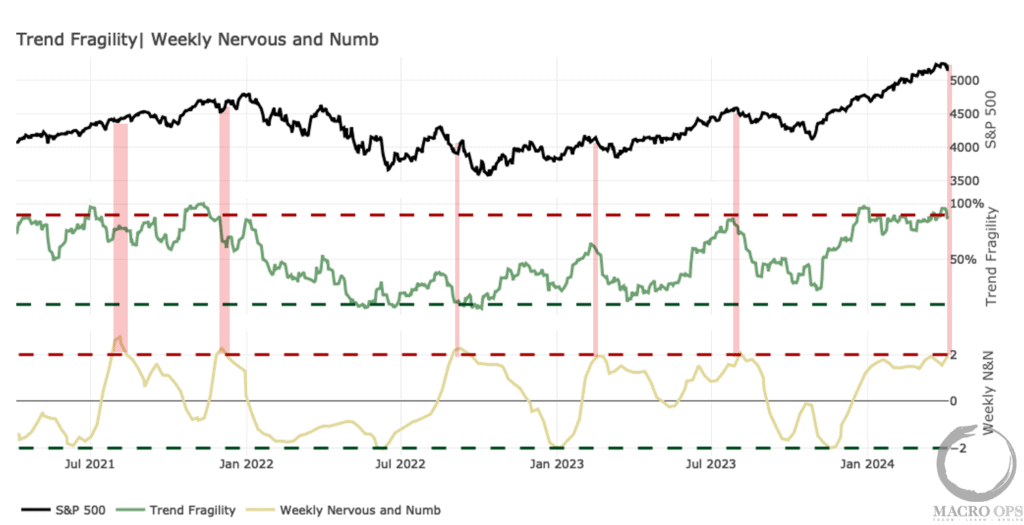
2. Our Weekly Nervous & Numb indicator (yellow line) triggered its first sell signal since the previous one last seen on August 3rd, 2023 which preceded the two-month correction in the indices. Trend Fragility (green line) is also elevated (around 90).
Neither indicate an immediate top in the market but they do collectively signal heightened risk and downside vulnerability. This means we want to closely watch internals and the rate-of-change in yields to look for increasing bearish pressure on risk assets and respect any failed support levels in the tape.
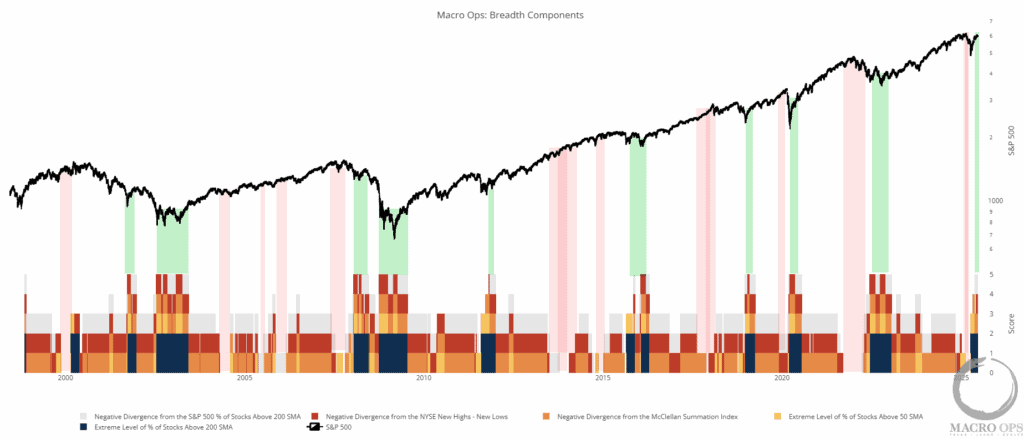
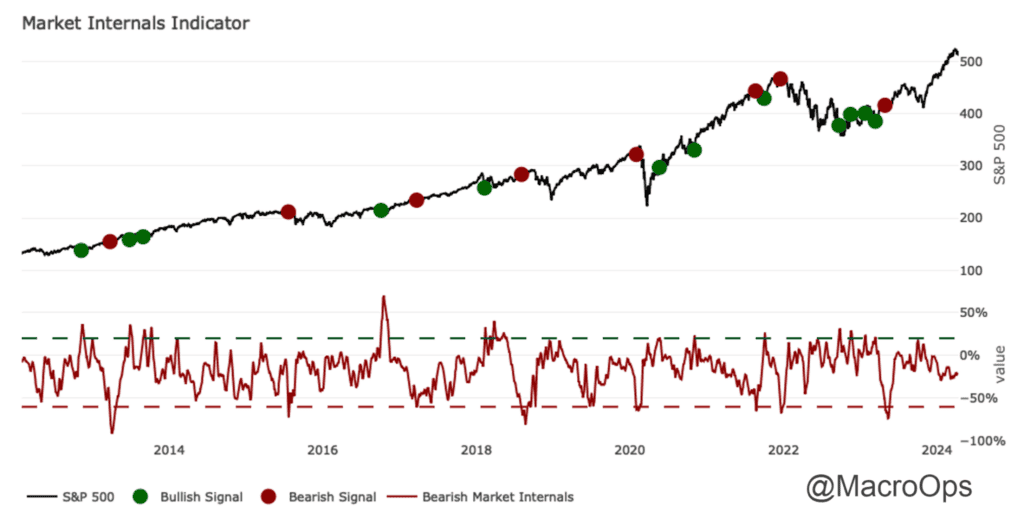
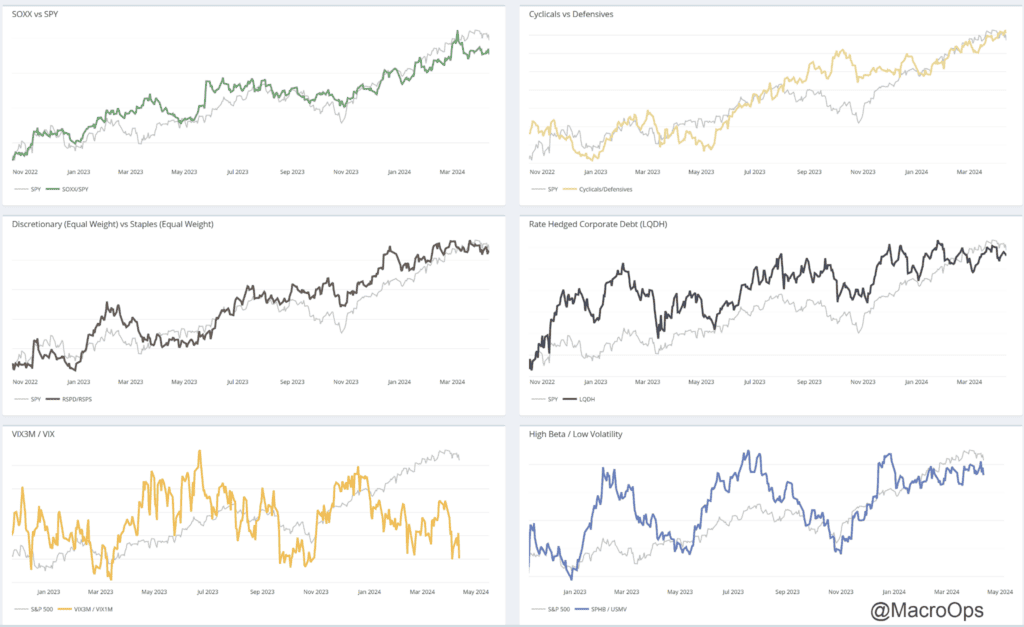
3. Our Inernals aggregator remains in neutral territory. And while we’re seeing some growing negative divergences in the sub-internals (ie, vix curve, QQQ/SPY), it’s not to the point where we should be overly concerned, yet.
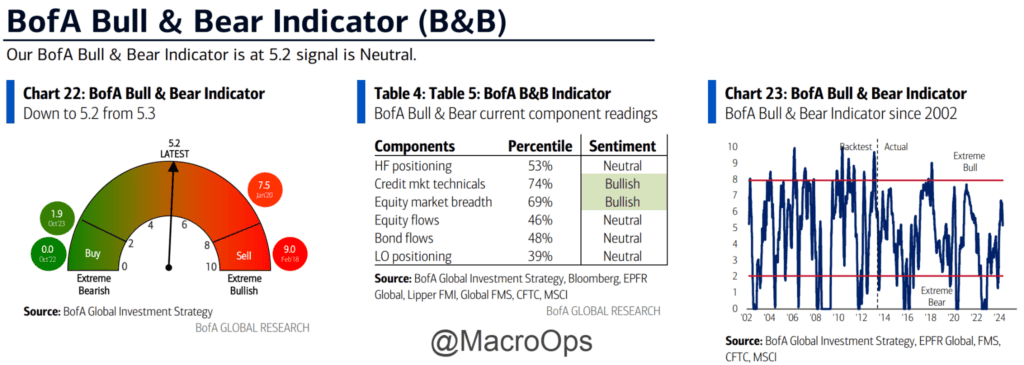
4. BofA’s Bull & Bear indicator (which offers a longer-term look at positioning /sentiment) remains squarely in neutral territory.
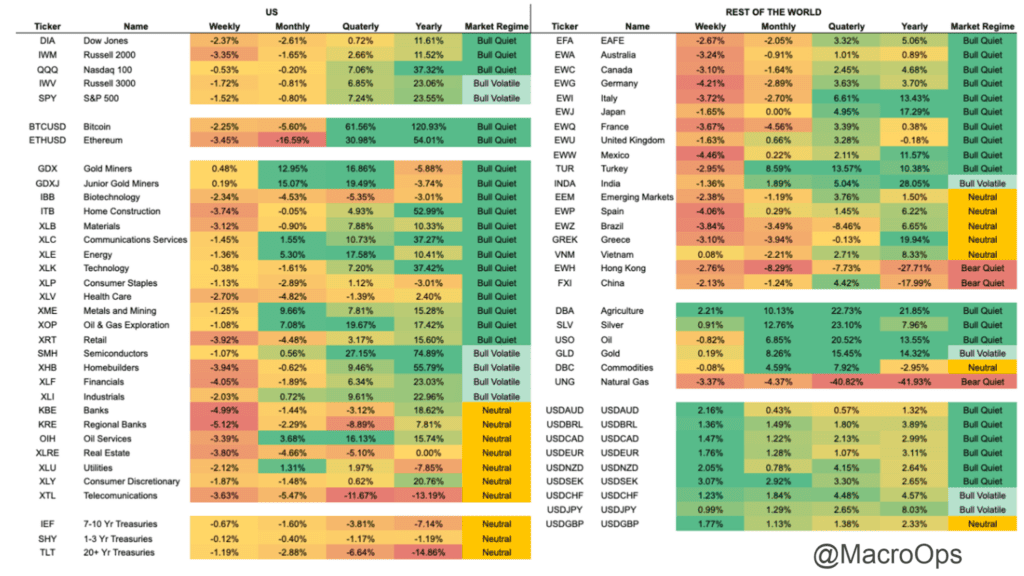
5. Here’s the latest market performance heatmap. Lots of red last week with banks, retail, and home construction seeing the largest drop.
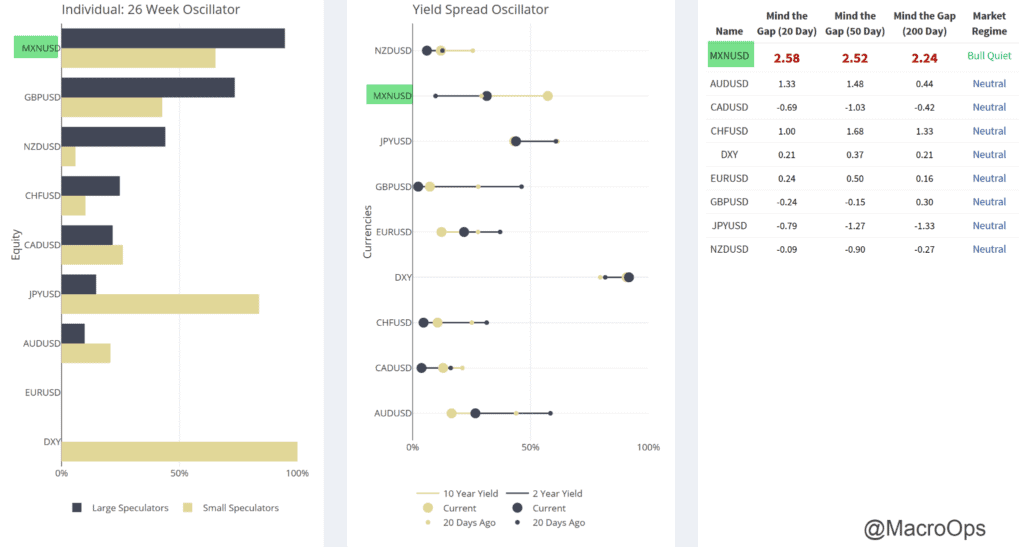
6. We’ve been pitching the long US dollar trade these past few weeks. Here’s the aggregator section of our FX dashboard. The Mexican Peso has the most crowded long positioning amongst large and small specs and is over 2std overbought across multiple timeframes.
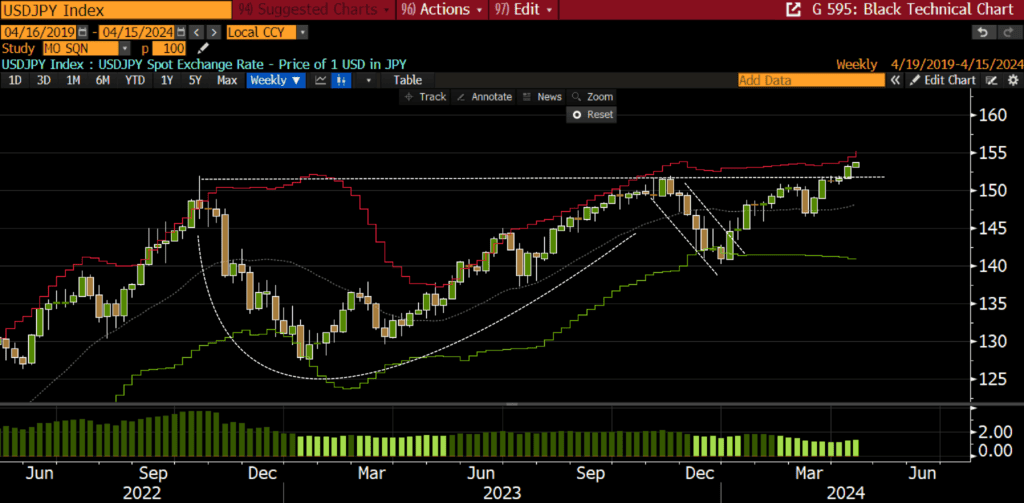
7. USDJPY also punched through a key level last week and moved to new highs. This completes an 18-month cup-n-handle pattern (chart below is a weekly).
8. Last week we talked about GBPUSD and a likely downside breakout. We got the bearish confirmation on Friday and got short (chart below is daily).
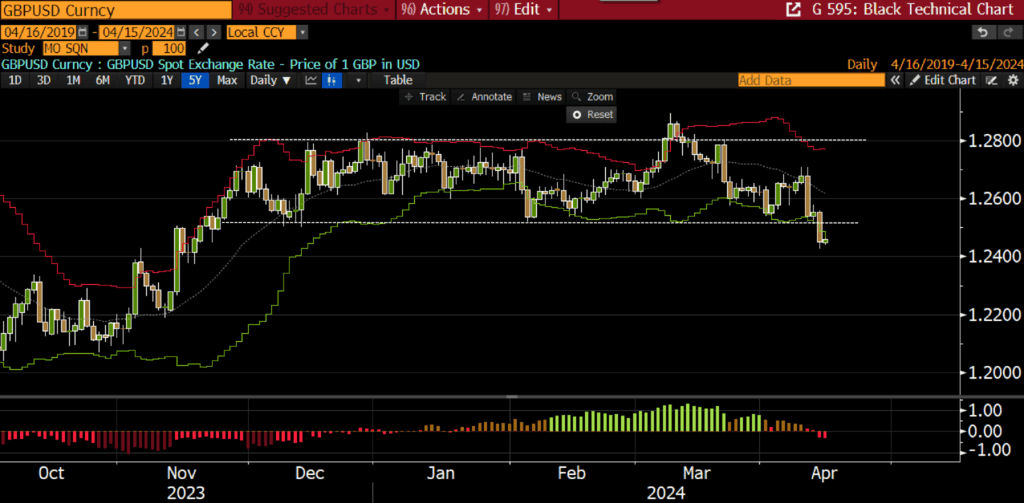
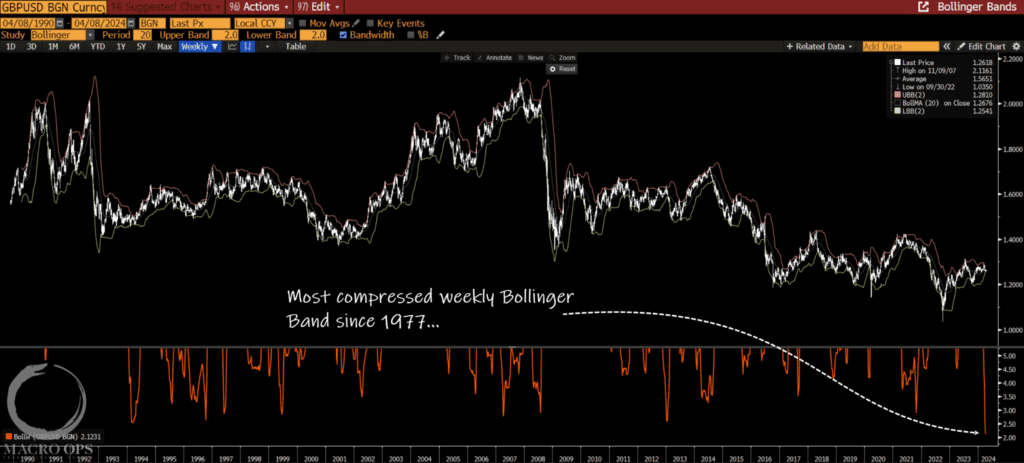
9. As we said last week, GBPUSD’s weekly Bollinger Band width is at its most compressed point since 1977. Major compression regimes lead to major expansion regimes (ie, big trends). So this could be a big move.
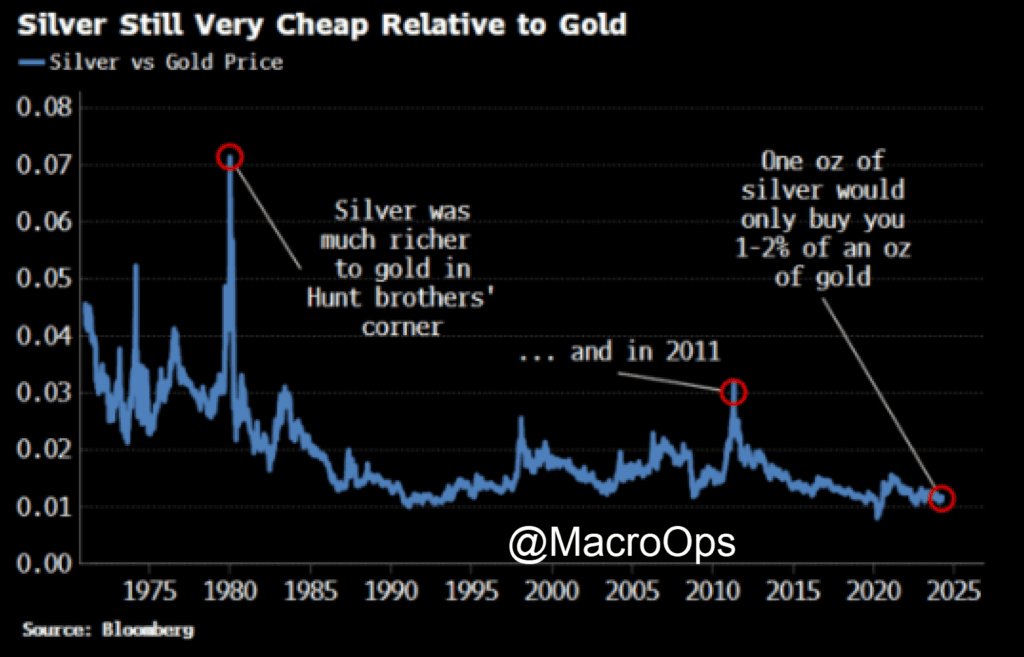
10. We’ve been big precious metal bulls all year and reman long both gold and silver (futures and equities). This chart from BBG’s Simon White shows that silver is still very cheap relative to gold.
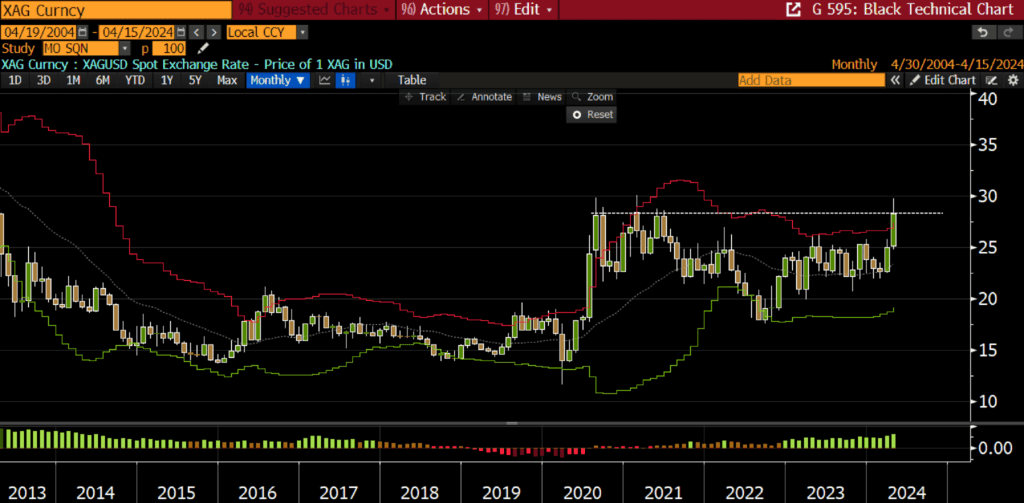
11. This monthly chart of silver shows that it’s wrestling with its previous highs from 2020/21.
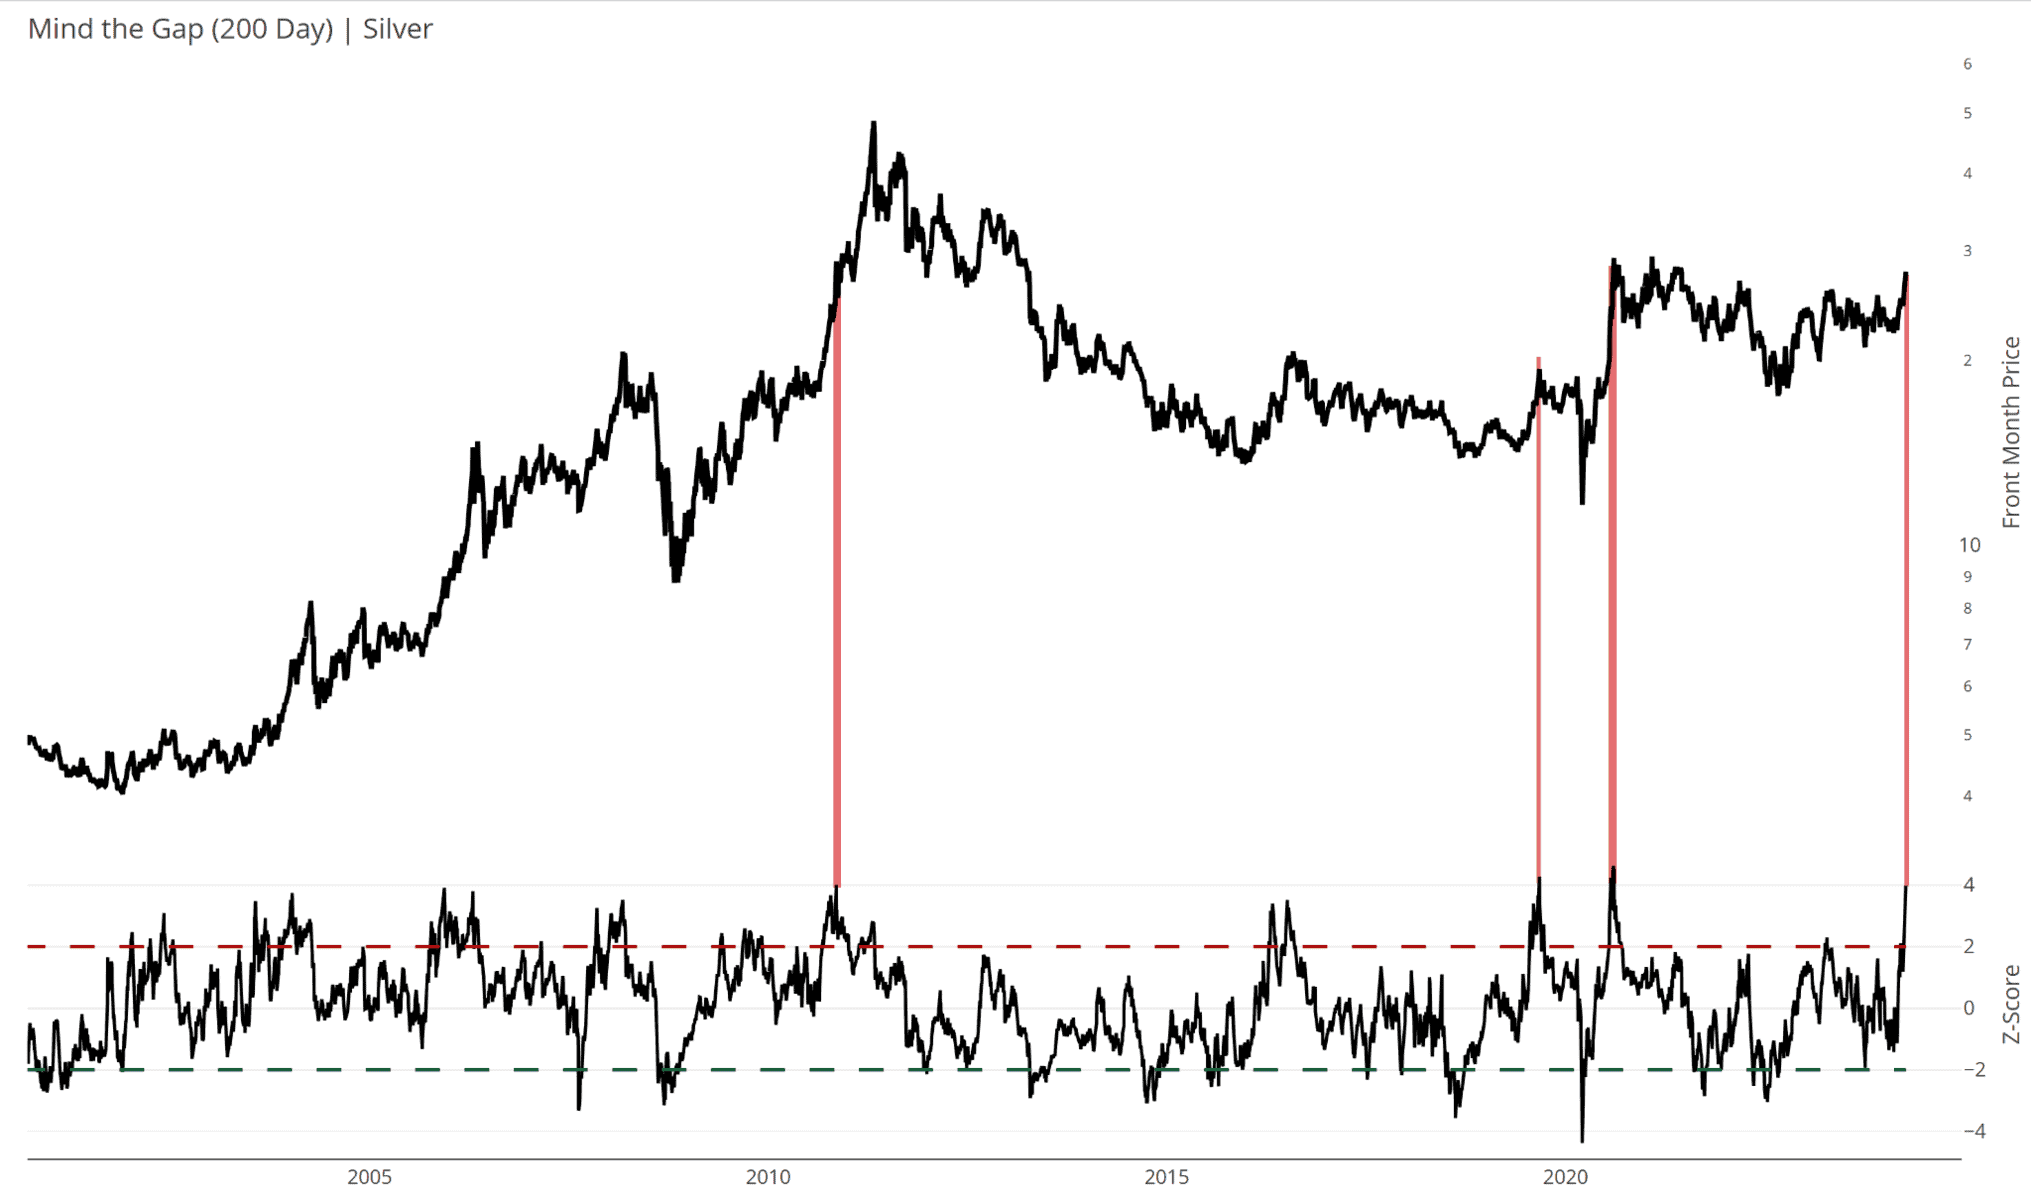
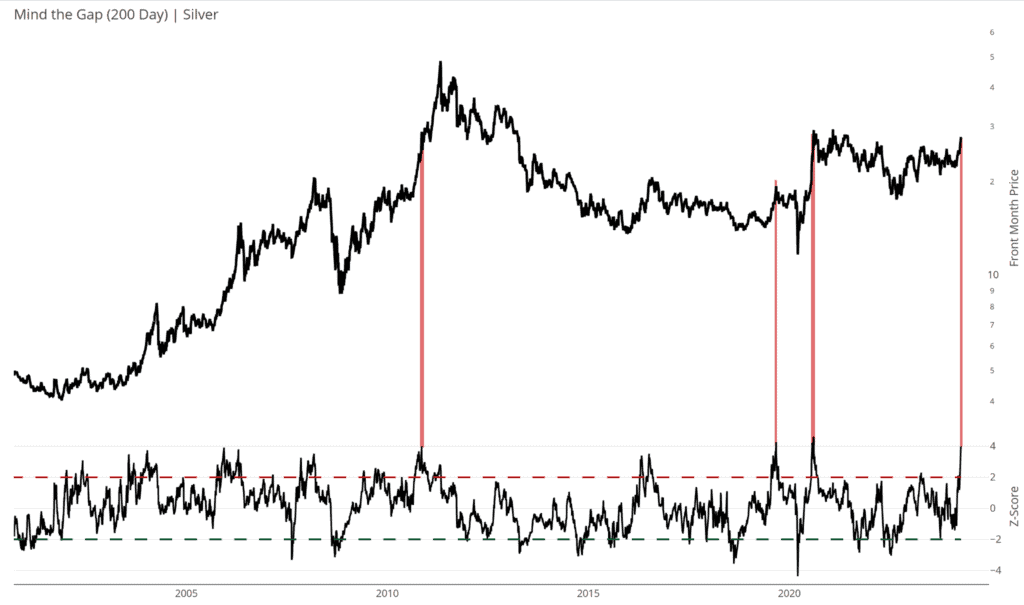
12. It’s true that silver is very overbought on a technical basis. The chart below shows that it’s trading 4std above its 200-day moving average. Red vertical lines show the three prior instances. The past three times preceded a period of either consolidation or intermediate top. We think we’ll likely see the former but have high conviction the long-term PM bull is just getting started.
Thanks for reading.