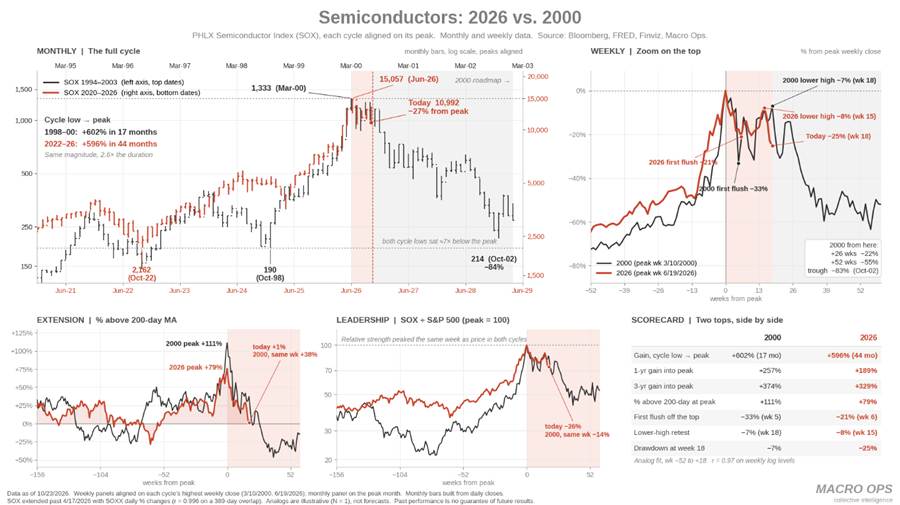
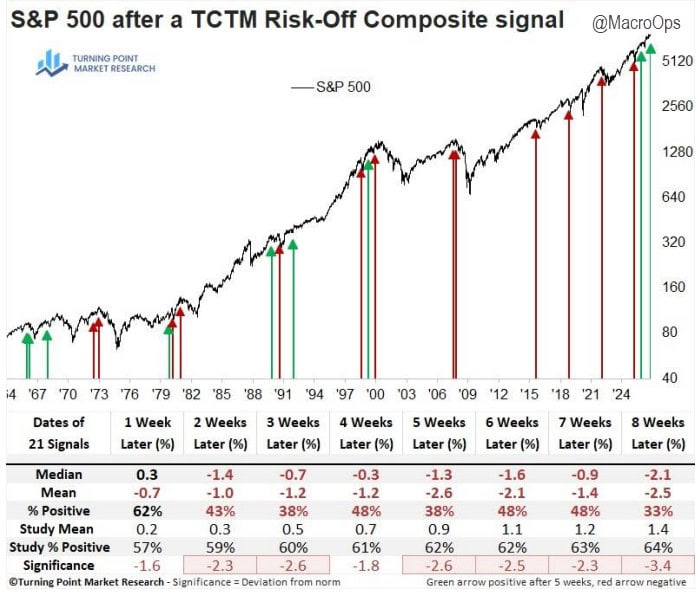
Summary: The evidence still points to the pain trade being higher, but risks and trend fragility keep climbing as yields stay elevated and the ex-AI divergence persists… In this week’s DD we walk through the unusual nature of this market and lay out why it’s actually typical Late Cycle behavior (which we’re in). We discuss what that means for forward returns and what we need to keep a close watch on. We then end with somewhat surprisingly bearish positioning and sentiment, and pitch two trade setups that should benefit in this single-narrative market, plus more…
*** Housekeeping note: As some of you know, the MO team recently joined an established asset management firm to manage capital utilizing the MacroOps investment process — if you are a qualified purchaser (please see attached description) and are interested in learning more, please let us know.
We’ve also recently expanded the team — bringing Dean Christians on board — and are in the process of merging our companies.
In November, MacroOps will relaunch with a new brand, website, and interactive quantitative dashboard featuring our models and proprietary historical datasets.
With these changes, we’ll be roughly doubling Collective pricing at the relaunch to preserve the size and quality of our community. We’re running an enrollment this week, which will likely be the last chance to lock in current pricing. If you’ve been on the fence, now is a good time to try it and see if it’s a fit.***
MO Portfolio & Trades
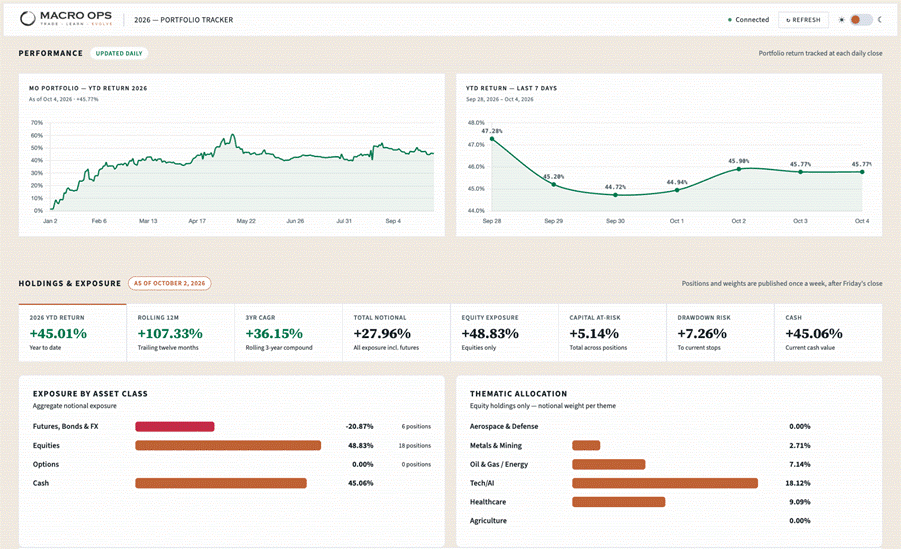
1. The portfolio fell -219bps last week, leaving us +45.01% on the year, below our ytd high-water mark of +61%. We’re long the Nasdaq, ETHUSD, semis, crypto miners, commodities index, US dollar, and some select biotech plays.
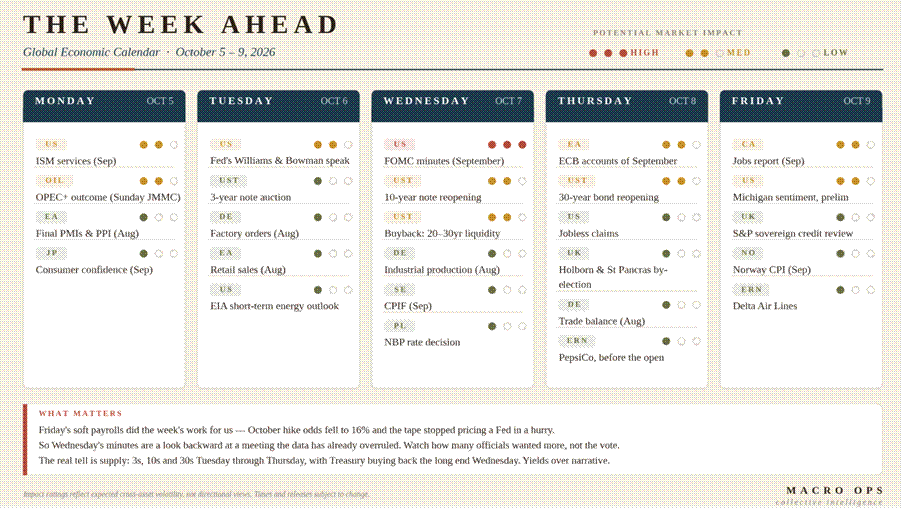
2. The week ahead in data. Friday’s soft payrolls dropped October hike odds to 16%. So Wednesday’s minutes are a bit stale.
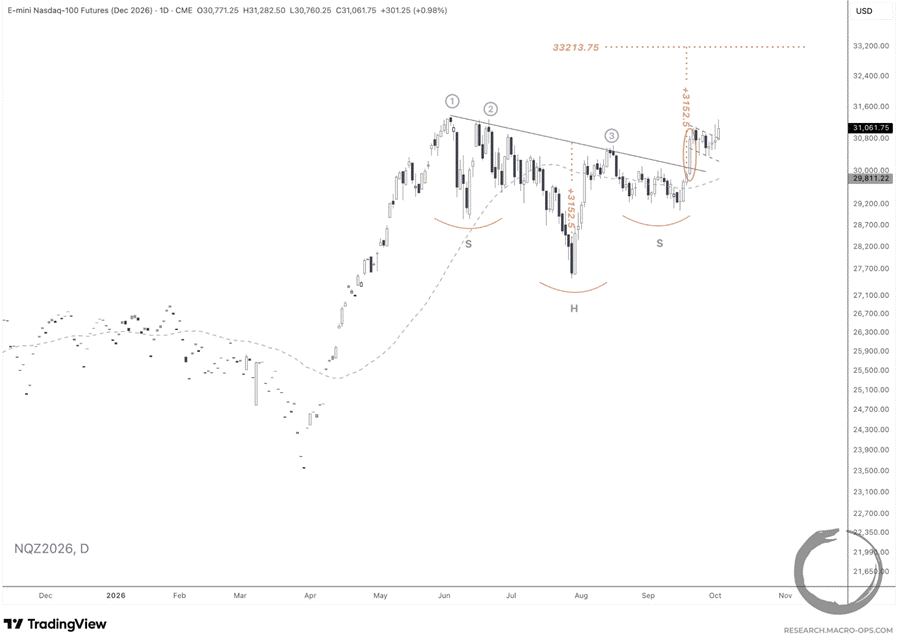
3. Nasdaq futures put in a new all-time weekly closing high on Friday, which many wouldn’t expect given the feel of this market. The active contract now has to clear the June highs, which it’s bumping up against. Our read is that it punches through and moves higher.
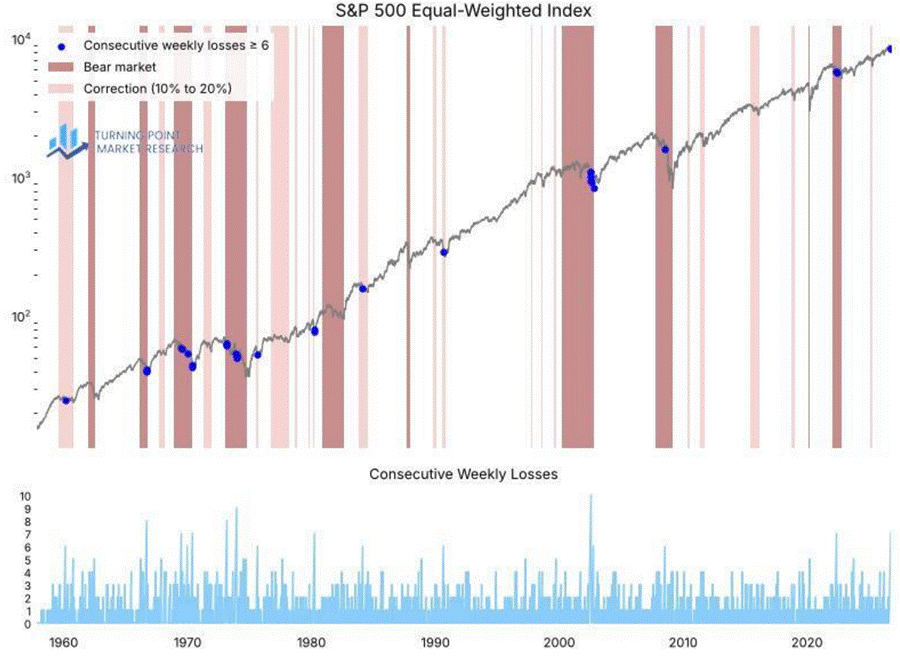
4. My teammate Dean Christian put out a killer note over the weekend. One of the studies in the report looks at the unusual nature of this market and what it likely means. Dean notes that “the equal-weighted S&P 500 is on track to close lower for a seventh consecutive week, a streak last seen during the 2022 bear market. The chart below puts this move into historical context, with a blue dot marking each instance when a losing streak reached six consecutive weeks…
“As the chart illustrates, six-week losing streaks have historically occurred during corrections or bear markets. With the S&P 500 less than 2% below its record high, the current market backdrop is unprecedented. Weak relative trends are not inherently concerning and often result from mega-cap leadership, but outright price deterioration is harder to dismiss, and that is increasingly evident now.”
If you’d like access to his report, click here and sign up.
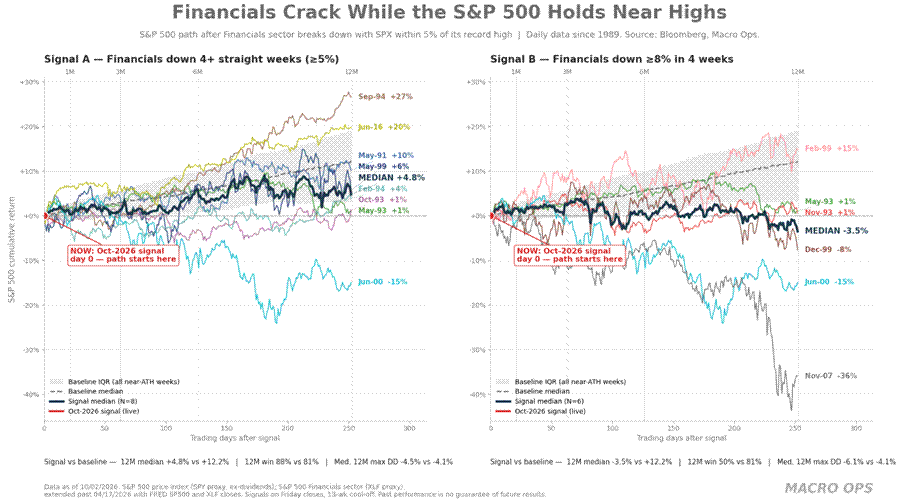
5. We’re seeing all kinds of unusual action… Another example, among many, is the breakdown in Financials (XLF) while the SPX continues to trade within a few % of all-time highs.
The forward returns chart shows each time XLF has fallen four straight weeks and/or is down over 8% while the SPX remains near its highs. This has happened only 12 times since 1989, and only twice before in its strongest form (sharp and sustained together): May 1993 and June 2000.
Historically, the next 3m for the SPX has looked normal, but the following year has lagged badly.
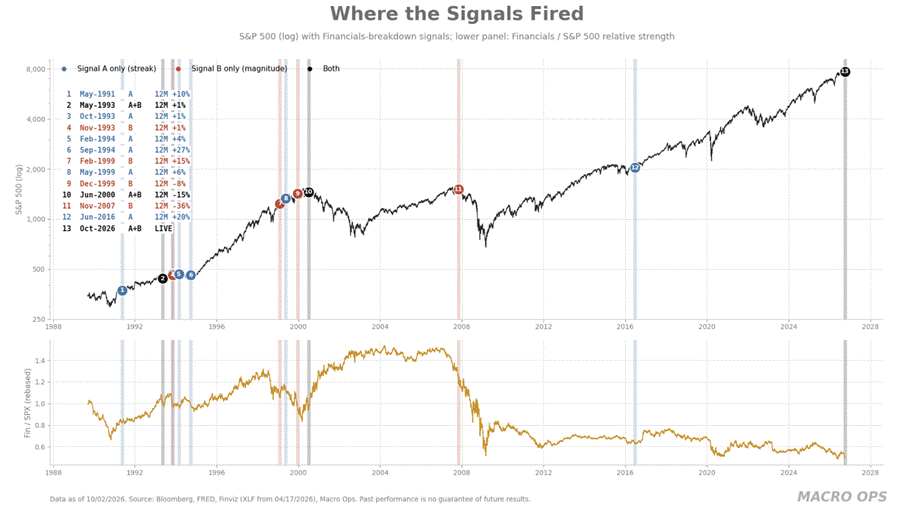
6. Here’s the same study overlaid on a historical chart. It’s rare to see this weakness in financials, and even rarer to see it both sharp and sustained. These episodes tend to cluster around market tops or extended stretches of sideways action (May ’93). More reason to keep a close eye on any continued widening in credit spreads.
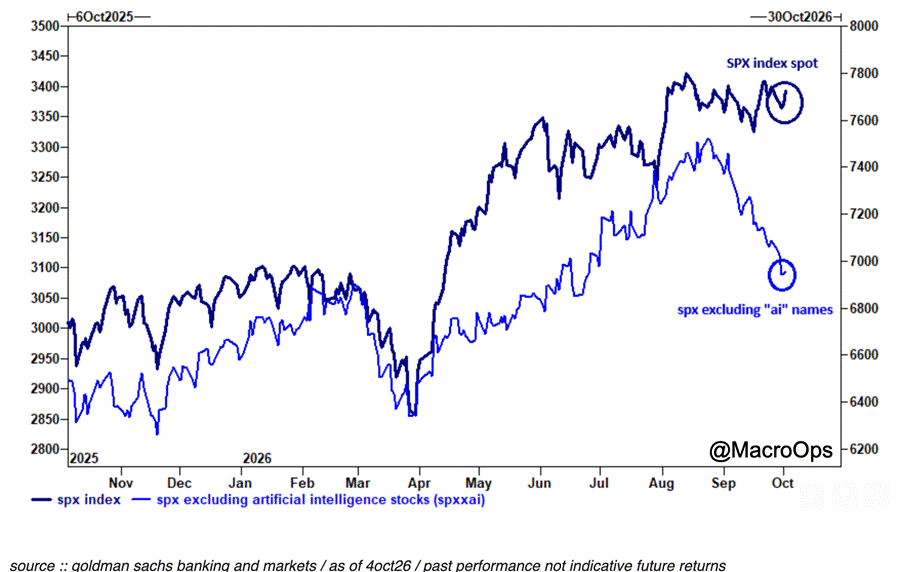
7. The backdrop is that the market is increasingly a single driver/narrative market. There’s the AI trade and then everything else, as shown in the GS chart below. This is why we’re seeing things like the 3m correlation between the SPX and the equal-weight index at all-time lows.
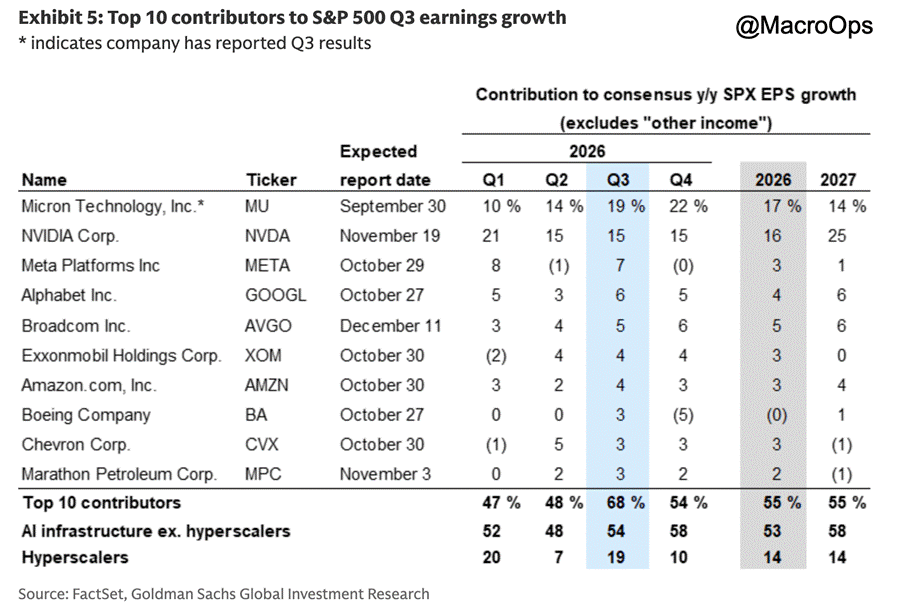
8. The market is simply reflecting earnings. As GS notes, “At the stock level, AI infrastructure stocks are expected to drive more than half of S&P 500 EPS growth in Q3. The top 10 contributing stocks are expected to account for over two-thirds of aggregate S&P 500 earnings growth this quarter, with Micron (MU) and Nvidia (NVDA) together accounting for more than 1/3 of index growth.”
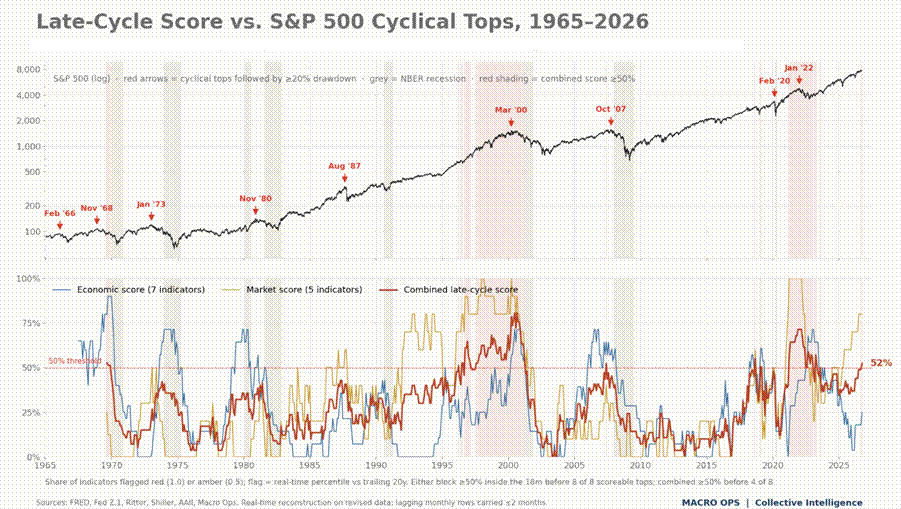
9. But as MO readers know, this isn’t all that unusual when put into the broader context of where we are in the secular and cyclical economic and market regimes. This is simply Late Cycle action within a larger Core-driven regime. We should expect this narrowing and concentration to continue until something breaks, which will show up first in credit spreads and then get confirmed by the labor market.
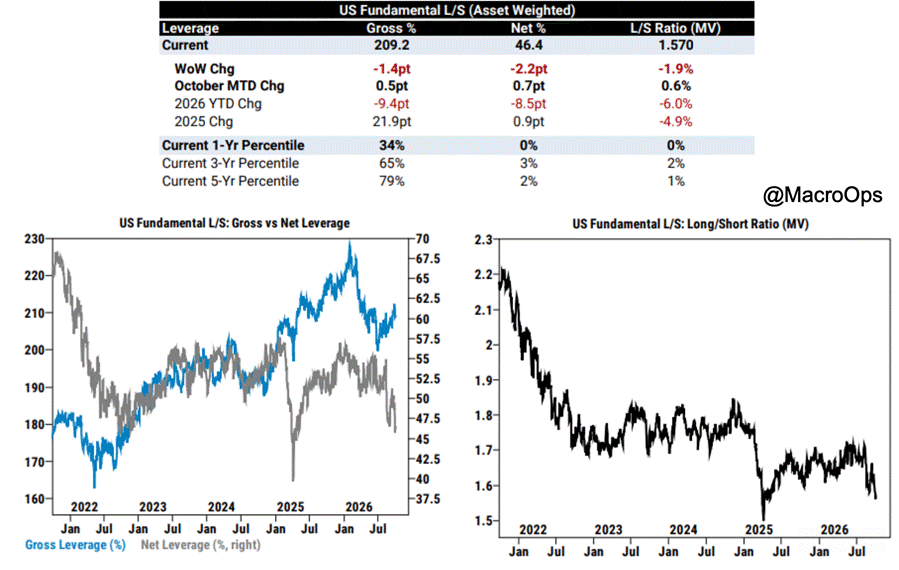
10. GS prime book data notes that positioning is still defensive beneath the highs. Leveraged funds are at record net-short Russell 2000 exposure, and most equity sectors saw net selling despite strong indices. AI and semis remain the clear exception, with flows concentrated in mega-cap growth. Net L/S positioning has fallen to the 0th, 3rd, and 2nd percentiles on 1, 3, and 5-year lookbacks, respectively.
The best contrarian pockets are cyclicals and energy. Industrials, materials, transports, and data-center names sit near relative lows, while energy has been heavily shorted even with oil elevated. Meanwhile, $1.5trn+ has flowed into U.S.-listed ETFs year-to-date, cushioning headline indices.
In short: “constructive on earnings, cautious on the market.” Light positioning leaves room for an upside squeeze if yields can halt their rise, but breadth likely stays weak unless participation moves beyond AI.
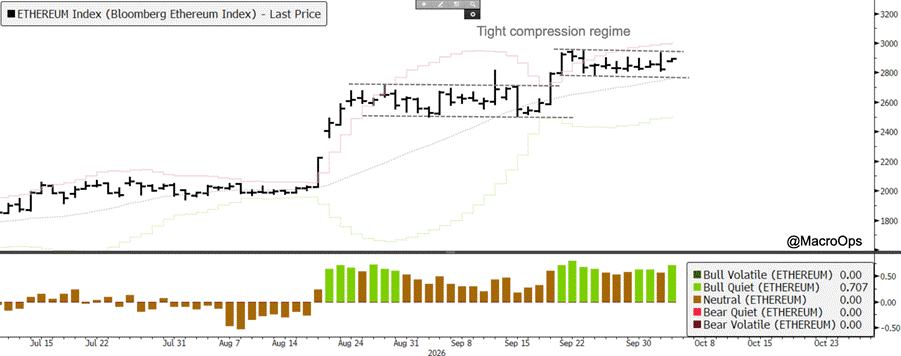
11. We still like crypto here… BTC, ETH, and SOL are all in very tight daily compression regimes. We’ll be adding this week on follow-through.
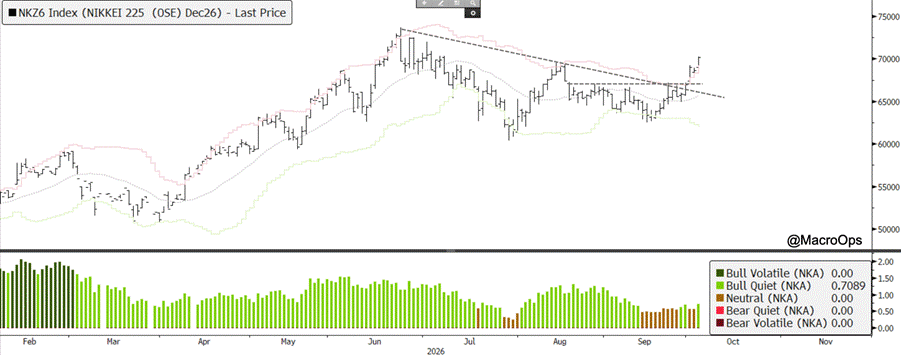
12. The Nikkei 225 has broken out of a 10-month corrective pattern. Positioning has largely reset. We’re buyers here.
Thanks for reading.