
“I will be first to admit that charts do NOT forecast price – they show path of least resistance and provide excellent risk management tool.” – Peter Brandt
If you’re like most market participants, you’re probably worrying about navigating today’s turbulent environment.
Maybe you’ve placed a few profitable trades, only to see most (if not all) of those profits vanish on a quick market reversal.
And as Q1 comes to a close, you’re left exhausted with decision fatigue, wondering where your future trade ideas will come from.
Enter the Macro Ops Collective.
The Macro Ops Collective is where the world’s best traders and investors sharpen their iron, improve their trading, and have a great time with like-minded individuals.
From CEOs to founders to former Market Wizards themselves, there truly is something for every type of trader.
The Collective shines in today’s market environment, and here’s why. We have a go-anywhere approach that allows us to profit in any market under any condition.
We’re not bound by arbitrary style buckets or value-based apologetics.
In other words, we can buy corn futures as readily as our next significant fundamental/buy-and-hold investment!
It’s one of the reasons why we’re up 20% this year (as of this writing), while the rest of the market remains underwater.
However, what if I told you one of our trading systems was up a blistering 33% YTD?
That’s what I’m showing you today.
This quarter, the Classical Charting Trading Protocol (or CCTP) is up 33R. This is on the heels of a +49R return last year!
Remember, as a Collective tribe member, you get this access to this system for free. It’s just another way we differentiate ourselves from the masses.
We only have 15 spots left in this enrollment period, and I know they’ll fill up fast.
So, what are you waiting for? Another profitless quarter to pass you by?
Join the Collective today!
JOIN THE MACRO OPS COLLECTIVE NOW
Now, onto today’s piece.
I published the Macro Ops Classical Charting Trading Protocol 2021 Review in January. The Protocol uses classical charting principles to trade in markets.
That means we trade rectangles, cup-and-handles, head and shoulders, etc. We usually trade on daily or weekly charts.
We logged 155 trades last year. You can check out the full report here and the highlights below:
- Total R Return: +49.12R
- Total Winning Trades: 37
- Total Losing Trades: 105
- Win Rate: 26.06%
The Protocol crushed it last year, albeit on a smaller five-month sample size. Luckily, we’ll log a full year of trading in 2022.
This post examines the Protocol’s Q1 Trading Results, which generated 72 trading signals during the quarter.
Let’s dive in!
Q1 2022 Trading Protocol Overview
Here are the headline stats from Q1:
- Total R Return: +33.74
- Total Winning Trades: 19
- Total Losing Trades: 37
- Win Rate: 33.93%
- Expectancy: +0.26
There are a couple key insights from the above data. First, I’d expect our win rate to average around last year’s figure (~25-27%). A ~34% win rate looks excellent but is likely not sustainable over the next few quarters.
Second, we generated a +0.26 Expectancy Ratio. The Expectancy Formula is:
(Average R Multiple on Winning Trades * Win Rate %) – Average R Multiple Per Loss.
In English, the Expectancy Ratio shows the average return profile of each trade in a given data set. For example, in Q1, each trade in the Protocol returned 0.26x the size of the losing trades.
The higher the Expectancy Ratio, the better.
We can increase our Expectancy Ratio by doing one (or more) of the following:
- Increase Average R Multiple on winning trades
- Decrease Average R Multiple on losing trades
- Increase Win Rate
We’ll continue to monitor the Protocol’s ratio throughout the year. Let’s shift to non-headline statistics.
Our average stop loss placement was 2.61% below our entry, only 10bps lower than last year’s average. This makes sense as we generally place stops below the current day’s lows (or highs when shorting).
Other Interesting Stats
Let’s review a few more interesting stats from Q1.
The Protocol generated 10.71R on the long side and 23.03R on the short side. This is highly unusual as we develop most of our annual returns from long trades. Thanks, NFLX!
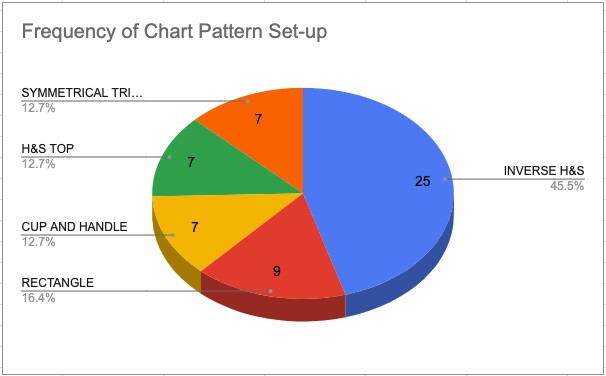
Let’s talk about chart pattern-specific data. The Protocol generated 13.71R from H&S top patterns during Q1. Here are the following three closest patterns:
- Rectangle: 9.21R
- Descending Triangle: 7.19R
- Bull Wedge: 8.56R
Regarding chart patterns, check out the pie chart below showcasing the five most popular set-ups traded during the quarter.
There were also a few nagging technical questions I answered, like:
- What is the average stop loss % from entry price for trades that reached their price target? -1.62%
- What is the average stop loss % from entry price for trades that did not reach their price target? -2.41%
I can’t wait to track the evolution of these data points over the coming quarters. Finally, let’s review how Market Regimes impacted chart pattern success rates.
Regime-Specific Data
A key component to our investment philosophy is recognizing varying Market Regimes, and trading those regimes according to regime-specific rules. The Trading Protocol is no different.
We closed 47 trades on the long side during Q1. The regime breakdown looked like this:
- 47% bought during Bull Quiet
- 40% bought during Market Neutral
- 11% bought during Bear Volatile
- 2% bought during Bull Volatile
Market Neutral regimes produced the best long trades with an average return of 0.79%. Unsurprisingly, Bull Quiet regimes also generated positive trades, with an average return of 0.1%.
Bear Volatile generated an average return of -7.38%, the worst in the group. You can see the distribution below.
![]()
Then there are the short trades. We took 18 short signals during Q1, with the results below:
- 44% triggered during Bear Volatile
- 33% triggered during Bear Quiet
- 22% triggered during Market Neutral
It makes sense that we didn’t take any shorts during Bull Quiet/Bull Volatile. Short signals trigger when stocks are already below key moving averages (like the 50D or 200D), coinciding with a bear trend.
Bear Volatile produced the best results, generating an average 9.59% return per trade. Market Neutral regimes came in second, producing an average 7.66% return.
Our short results benefited from outlier trades, which we’ll discuss next.
![]()
Pareto Strikes Again
The Protocol’s Q1 results benefited immensely from the Pareto Principle. For example, three winning trades generated 91% of the total returns. Let’s break down these big winners.
Netflix (NFLX) H&S Top Short
On 01/05, everyone’s favorite video streaming service, Netflix (NFLX), triggered a Head and Shoulders Top short trade. The chart below showcases the sell signal bar during a Market Neutral regime.
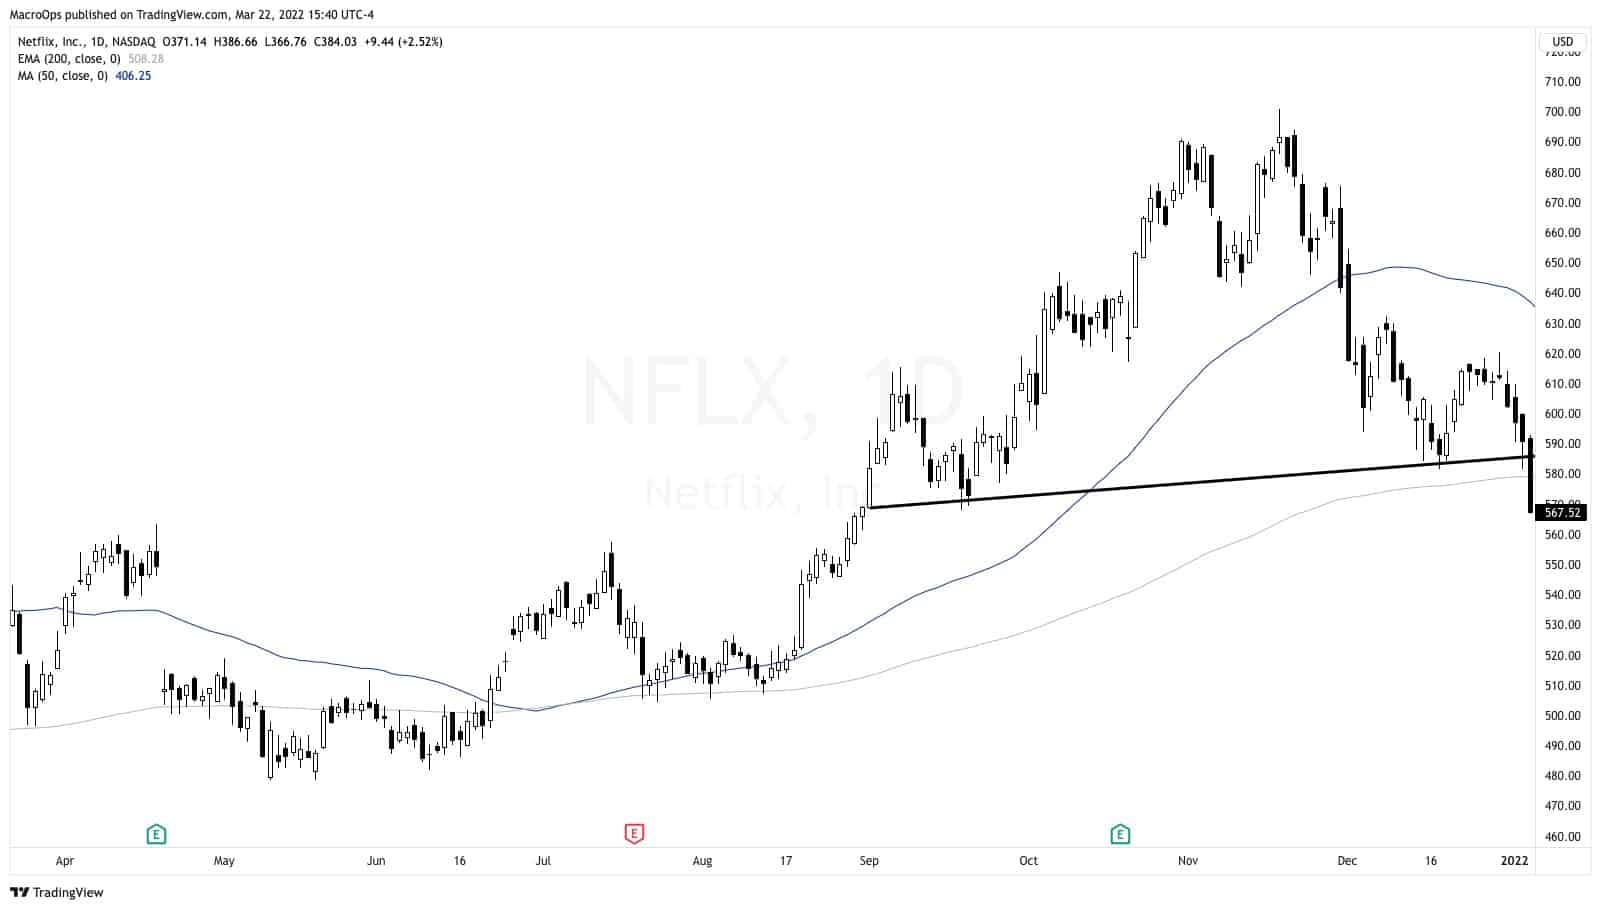
The Protocol alerted members as NFLX broke the previous day’s (01/04) lows of $580.59. We risked $12.83/share with a stop at the daily highs.
Risking $12.83 to gain $91.55 gave us a 7.14R multiple should the price hit our profit target. Not bad.
But sometimes you get lucky … really lucky.
NFLX reported earnings on 01/20. The stock closed at ~$508/share the day prior, only $19/share from our profit target.
The next day, NFLX gapped down ~22%. Our original profit target of $489/share suddenly morphed into $401/share.
We booked a +14.25R profit on NFLX. That was double our initial profit target and nearly 4x higher than our average R multiple for winning trades.
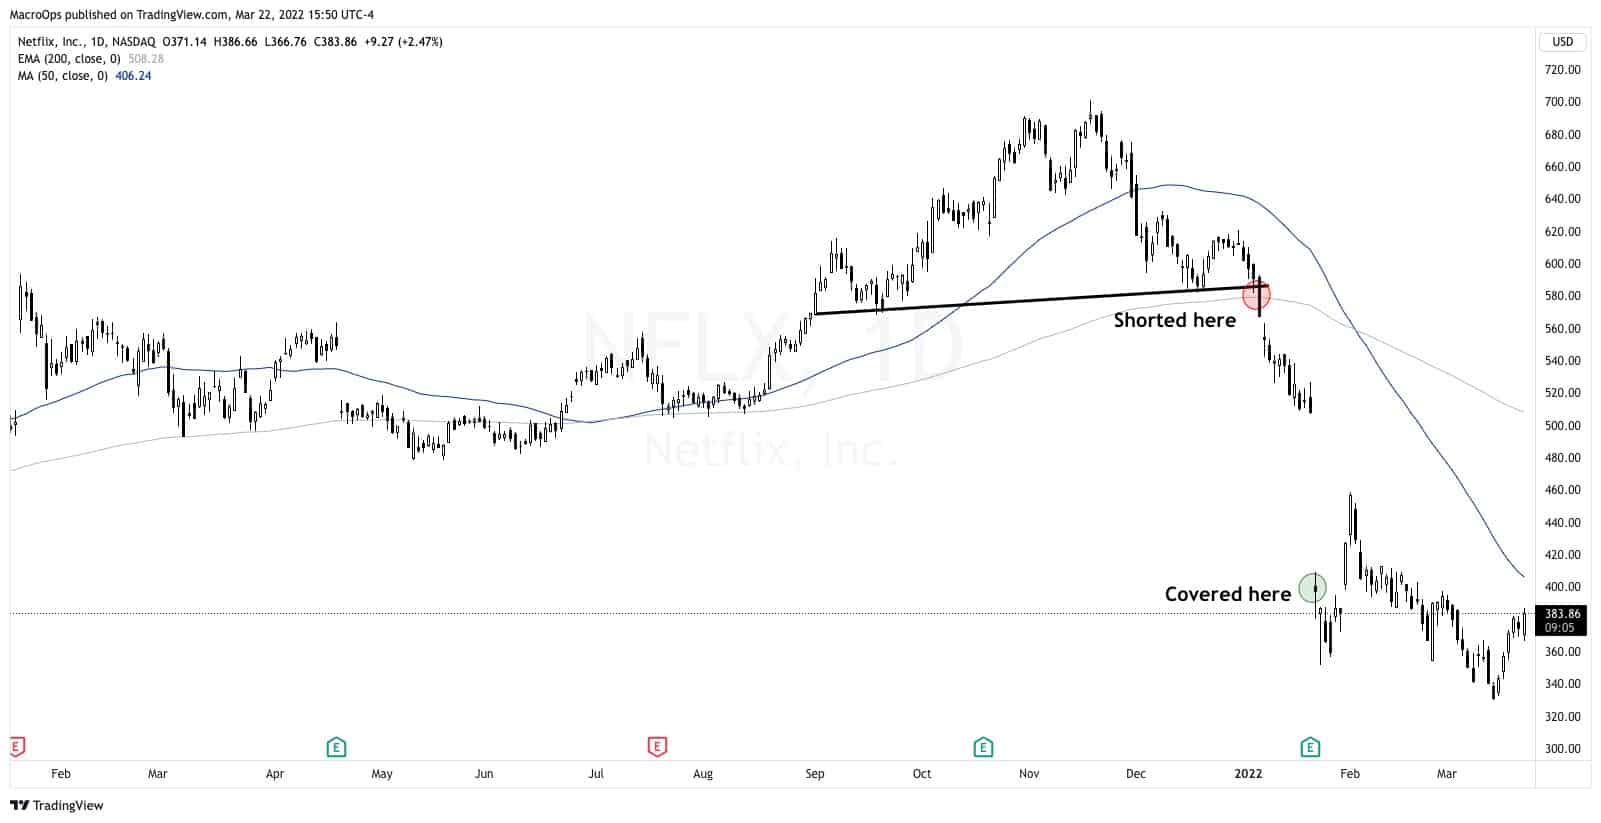
It’s impossible to plan for trades like the one above. That’s why it’s essential to take every signal the system generates. You never know which trade will become your Pareto Trade.
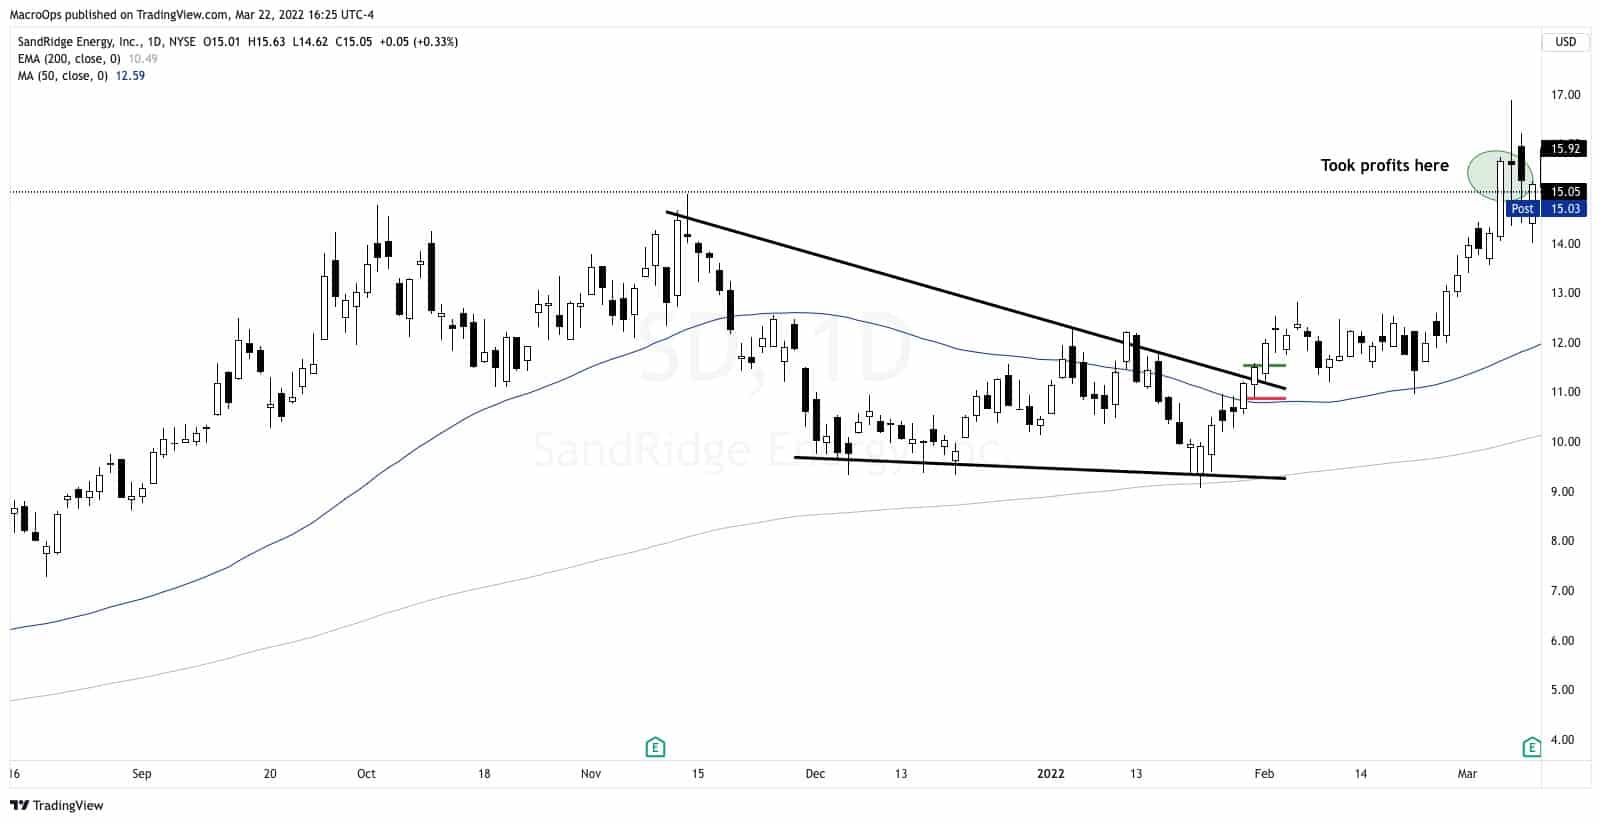
Sandridge (SD) Bull Wedge
The Protocol jumped on the energy trend in February with a buy signal triggered in the natural gas player, Sandridge (SD).
SD broke out of its bull wedge on 01/31 in a Market Neutral regime. Check out the breakout below.
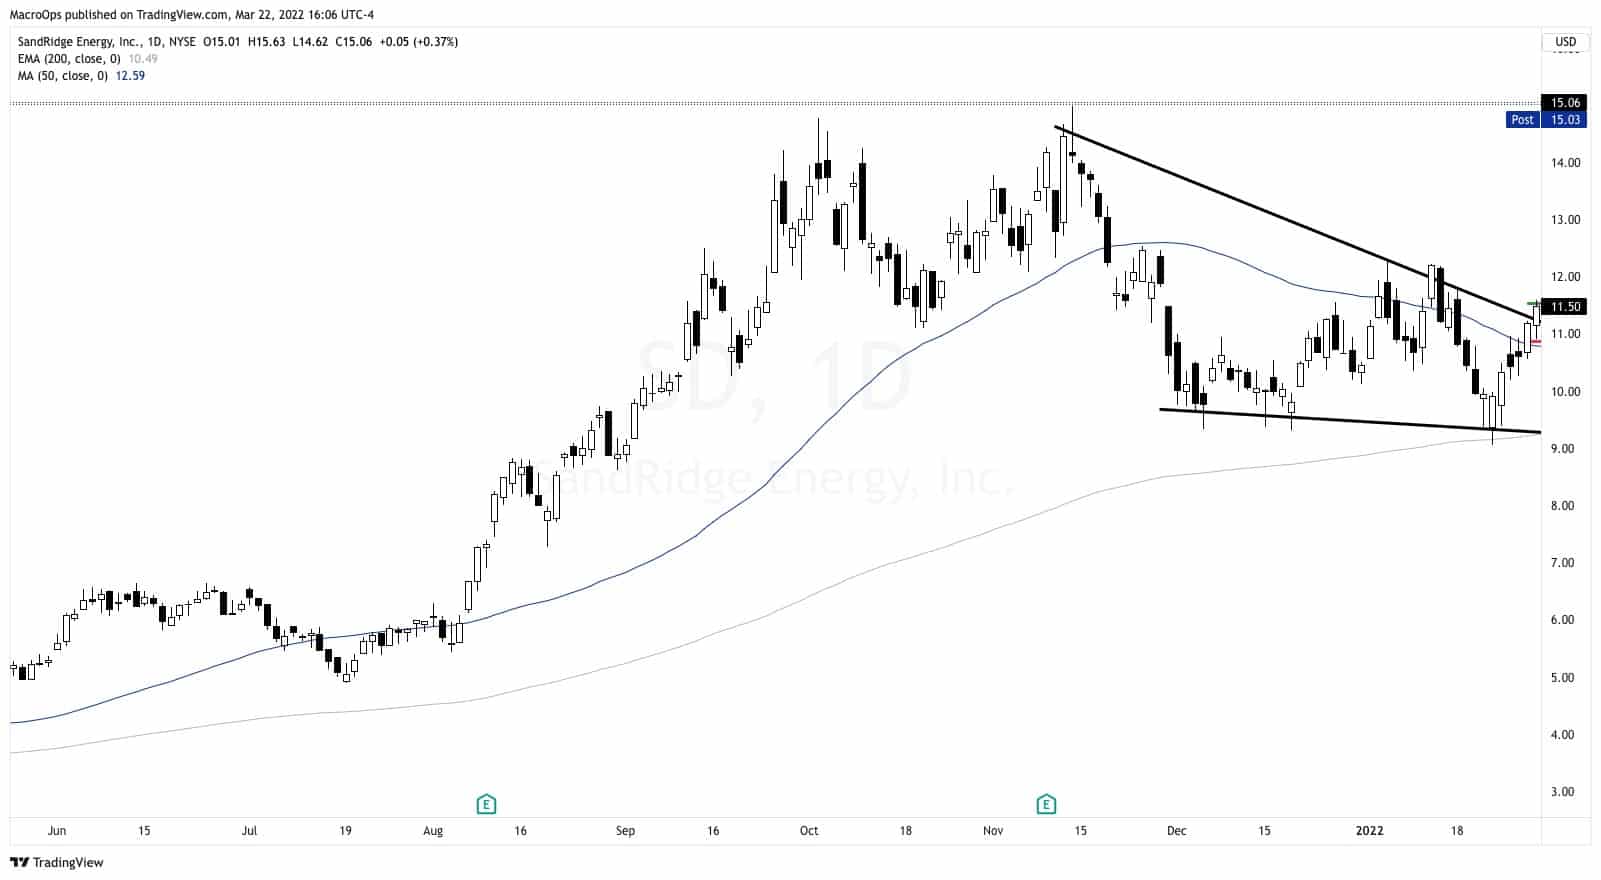
I don’t usually trade wedge patterns. I prefer breakouts from horizontal boundary lines like rectangles, ascending/descending triangles, and H&S patterns.
The Protocol entered the SD long trade at $11.54/share with an initial stop-loss at $10.88/share, risking $0.66/share of trading capital.
The stock took 22 trading days to hit our profit target of $15.49 for $3.95/share in profit. We booked a 5.98R gain, 1.6x higher than our average winning trade.
This year, we’ve alerted three Bull Wedge setups (SG and NVEI being the other ones).
Corteva (CTVA) Cup and Handle
CTVA is a global producer of seed and crop protection solutions. They sell stuff that helps farmers make all the food we eat.
The stock broke out of a 9.5-month cup-and-handle consolidation on February 4, which you can see below.
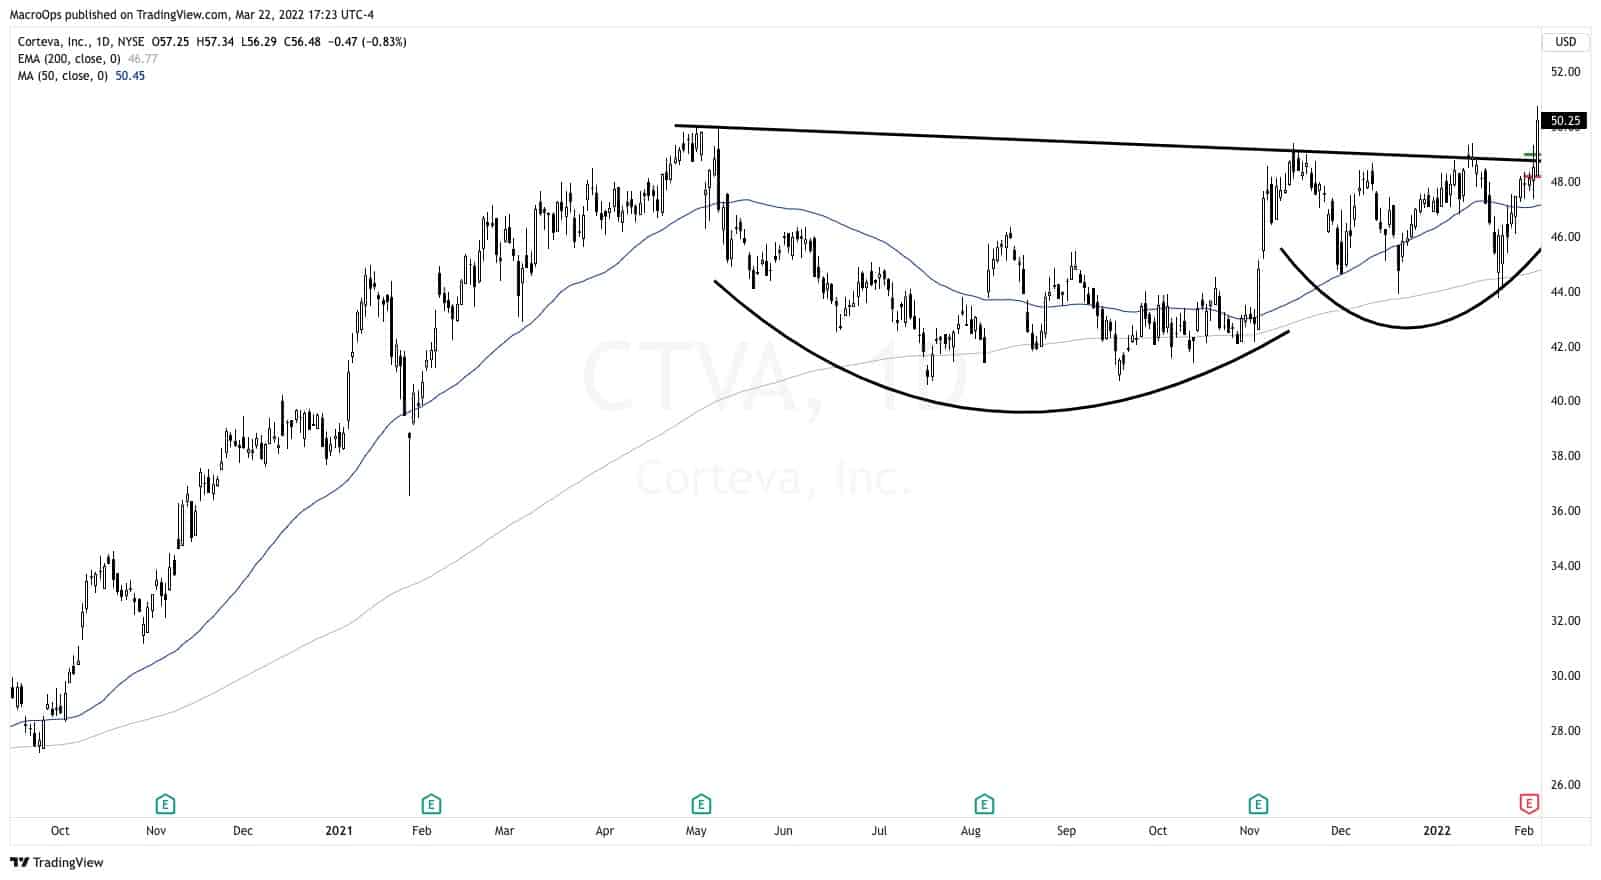
The Protocol alerted members on the breakout at $49/share. We placed our initial stop loss at $48.22, risking $0.80/share in trading capital.
It took 31 trading days for CTVA to reach its target of $57.11 or $8.11/share in profits. That’s a +10.40R.
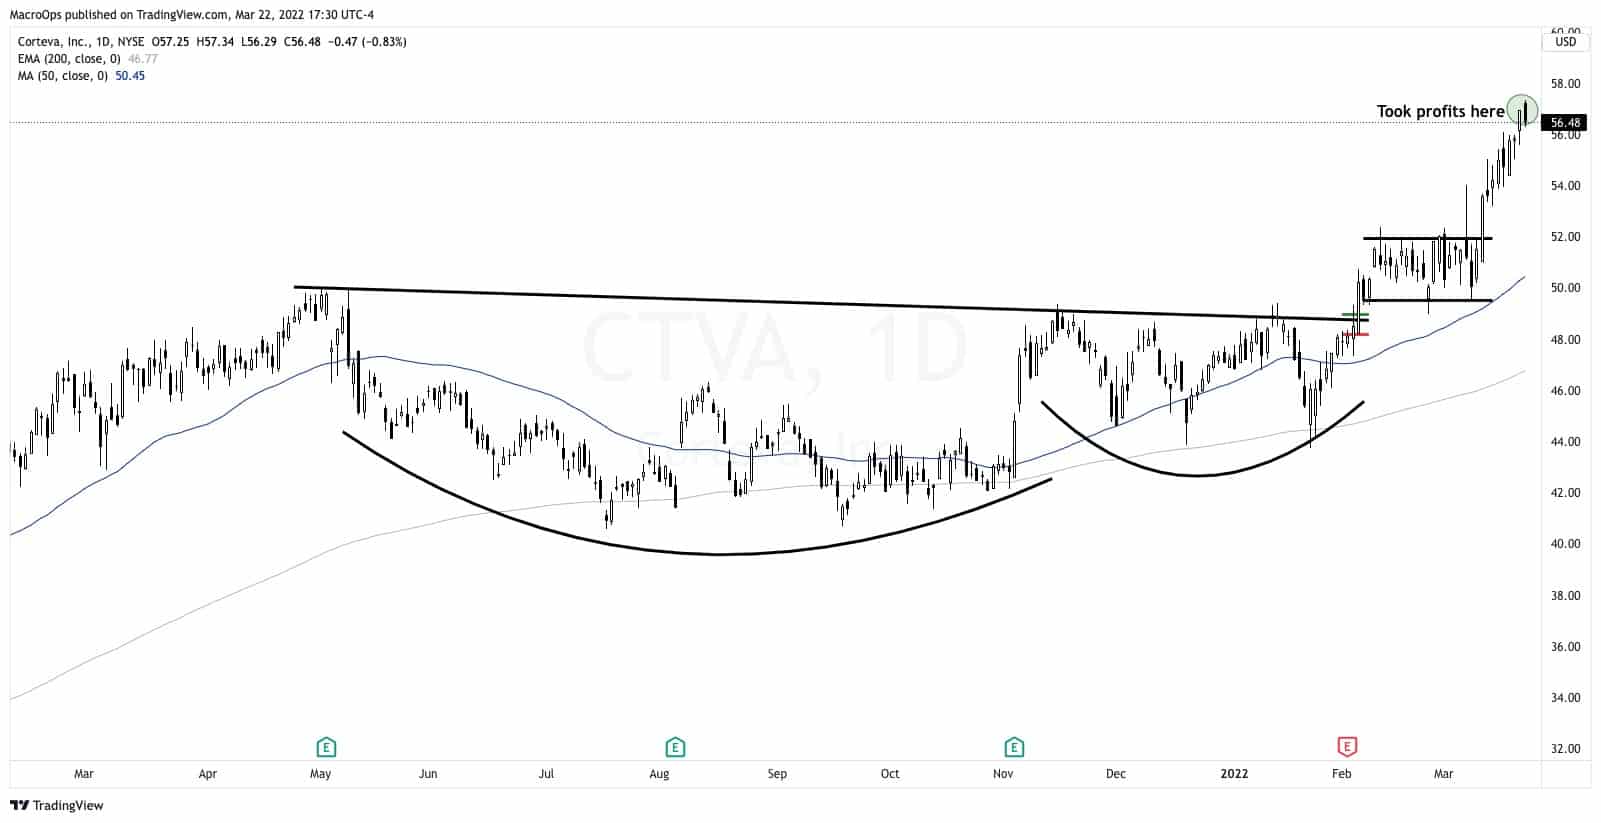
CTVA is another excellent example of trading “stacked” patterns. Notice how the stock formed a rectangle consolidation shortly after its initial breakout. There are a couple things a trader can do here.
On the one hand, the trader could pyramid her position by buying the initial breakout and the rectangle breakout. Traders should treat the second pyramid trade as an independent trade with its own risk parameters and stop-loss placements.
On the other hand, a trader could use the second breakout as a stop-loss placement tool.
Concluding Thoughts
The best traders have an incredible tolerance for taking many small losses. Last year, we proved that as the Protocol printed losing streaks of 5-7+ consecutive trades.
So far, this year is no different. And it shouldn’t be different.
The Protocol identifies classical charting set-ups intending to catch a few big winners throughout the year.
If we’re lucky, we break even on every trade between our big winners.
Our goal isn’t to eliminate the losses but to minimize their impact on PnL as we search for those mega-profitable Pareto Trades.
I hope you enjoyed this Q1 Classical Charting Protocol Breakdown. We look forward to reporting our Q2 results.
In the meantime, happy trading!


