Summary: Big momentum/megacap flush. If you need a cause, point to the strong jobs report and the subsequent yield spike through a key technical level. But that’s like asking which grain of sand started the avalanche. The instability had been building for weeks — BofA sell signal, crowded momo chasing — and Friday was the release valve. The more interesting observation: over ¾ of stocks outperformed the SPX, and only roughly half actually declined. This was a megacap and semi story, not a broad market breakdown.
Near-term path: low conviction in either direction. A new BofA Sell Signal just triggered, and our Liquidity indicator remains well below 50%, which has historically weighed on forward 3-month returns. We’ll let the tape lead. Separately, our crypto shorts saved the book last week. We took partial profits near Friday’s close. BTC and ETH are sitting at significant support and deeply oversold — how they react here matters. We also pitch two equity names on our target list.
MO Portfolio & Trades
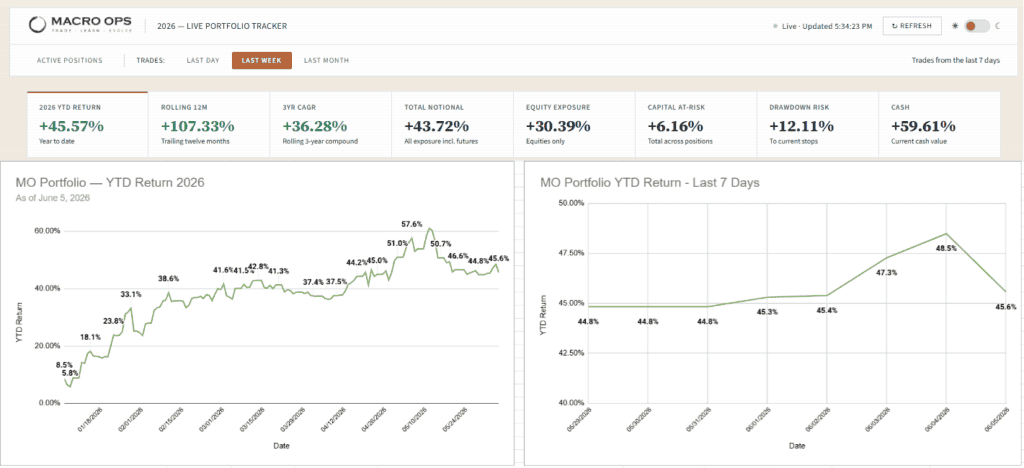
1. The portfolio ended last week up +80bps, bringing year-to-date returns to +45.6%, which is below our YTD NAV high of +61%.
Current positioning: elevated cash, select beaten-down software, healthcare, and cybersecurity names; short ETH, BTC, SOL; long the Bloomberg Commodity ETF; long solar; a handful of idiosyncratic equity positions.
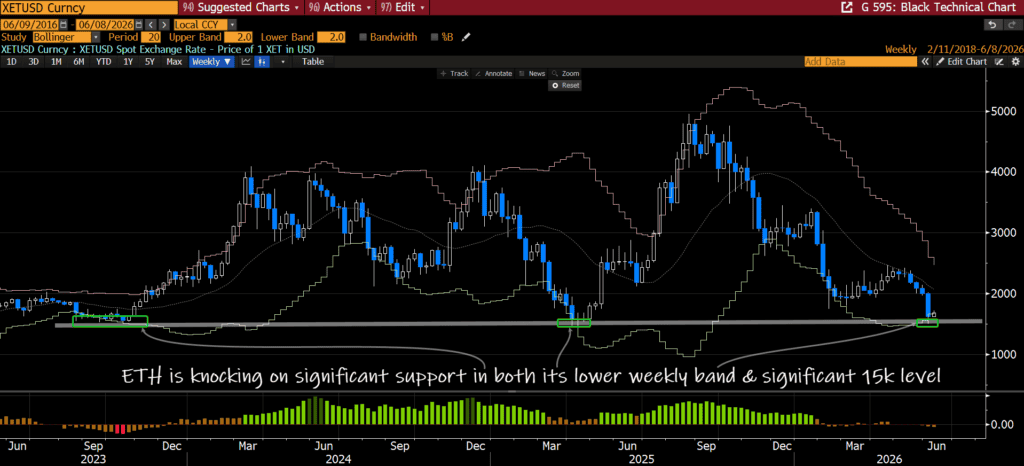
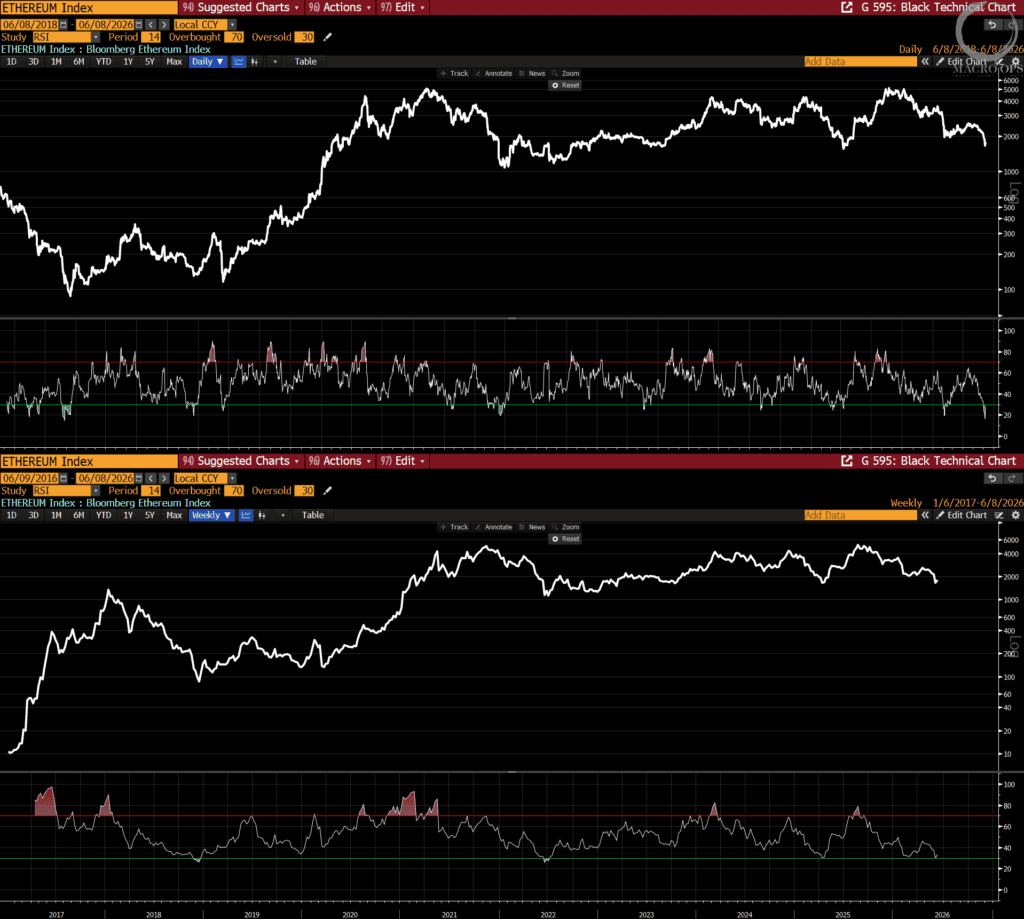
2. The short crypto trade that we’ve been writing about — and participating in — for the past month, saved our book last week with our short ETH, BTC, and SOL trades making up for our losses in equities. We took partial profits near the close on Friday and now have some tough trade management decisions to make. ETH is at its lower weekly band as well as multi-year support along the significant 15k level.
3. RSI on both weekly and daily timeframes has dropped to historically significant oversold readings.3.
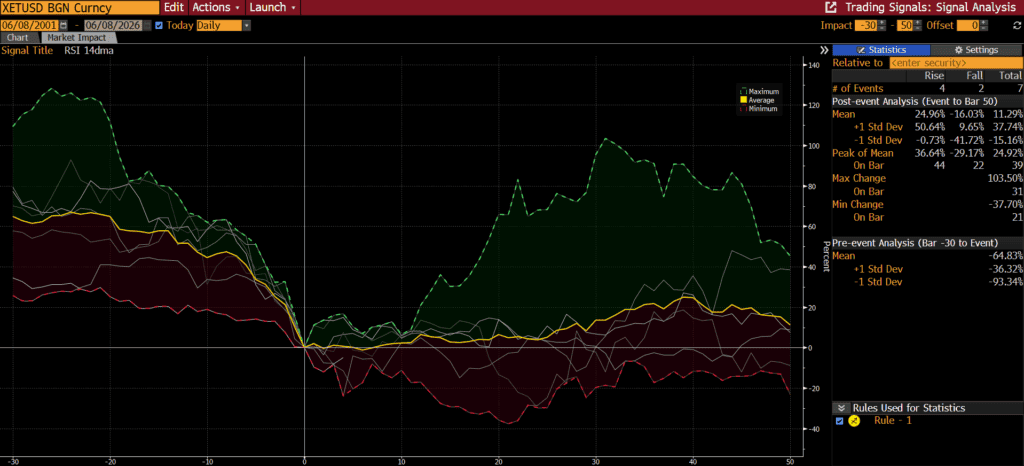
4. There have been seven instances (including last week) when the daily RSI fell below 20. In four of them, ETH was trading higher 50 days later, with an average gain of +25%. .
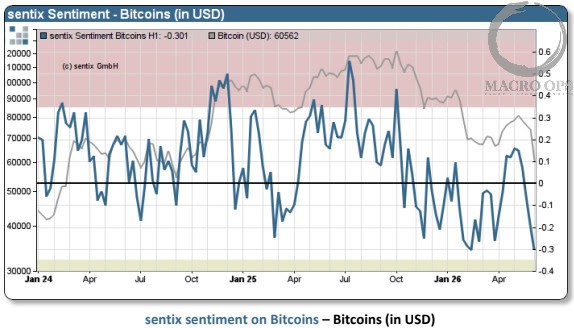
5. We’ll see how the crowded long CoT positioning shifted when Friday’s updated report drops. Sentix’s BTC Sentiment index is near its lowest reading in two years.
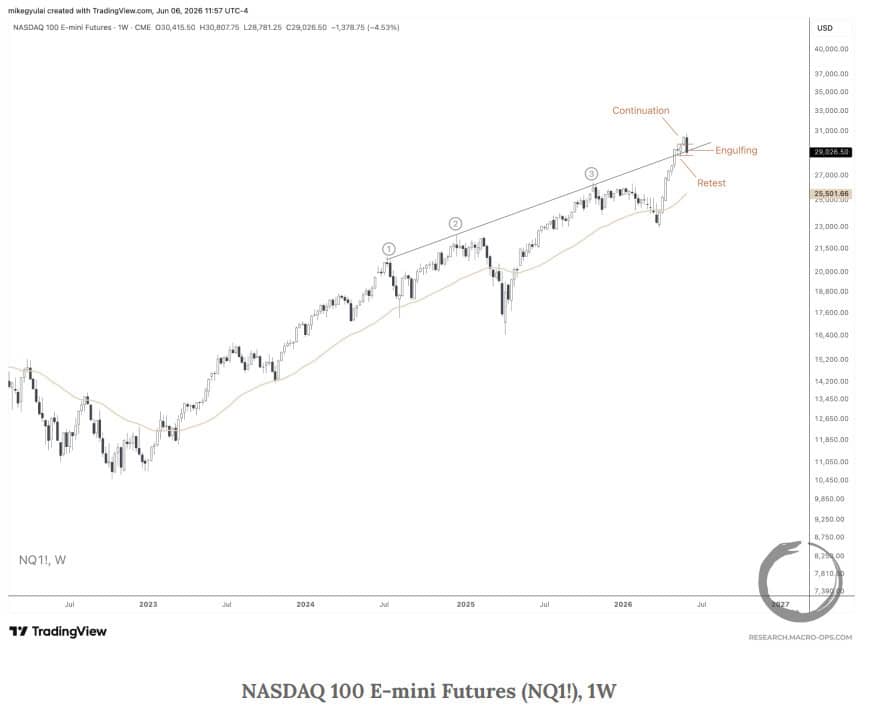
6. If you’re not reading Mike G’s weeklies, you’re missing out. His latest covers the chart below alongside a study on gambling and neuropsychology — a real banger (link here).
On the chart: we closed our NQ long last week out of respect for risk management. I don’t think the trend is over — strong momentum tends to beget more momentum — but my conviction is low. What I do have increasing conviction on is that we’re late cycle. I’m seeing it in our long-term positioning metrics, in the technicals, and now in macro data flagging a late-cycle Overheating regime.
This isn’t immediately actionable. Late cycles can persist for months, even years, which makes them among the hardest regimes for our style to navigate. The good news: there are better opportunities outside the crowded AI trade. We’ll continue to play the trend with tight risk, but most of our focus is shifting elsewhere.
7. From @sunchartist, a technician I respect:
“Semi’s have all the hallmarks of exhaustion throwover. The exponential rally is more pronounced on the Weekly charts. Last week formed a bearish inverted hammer reversal on higher volume, with the highest RSI reading on record. If this is indeed a trend reversal or establishing a higher trend channel, we are about to find out.”
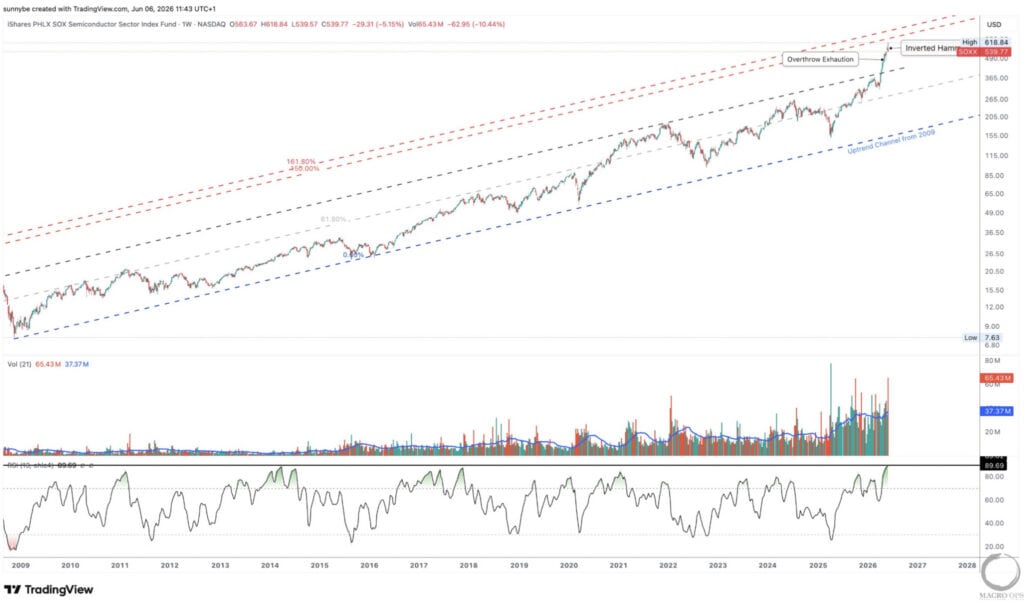
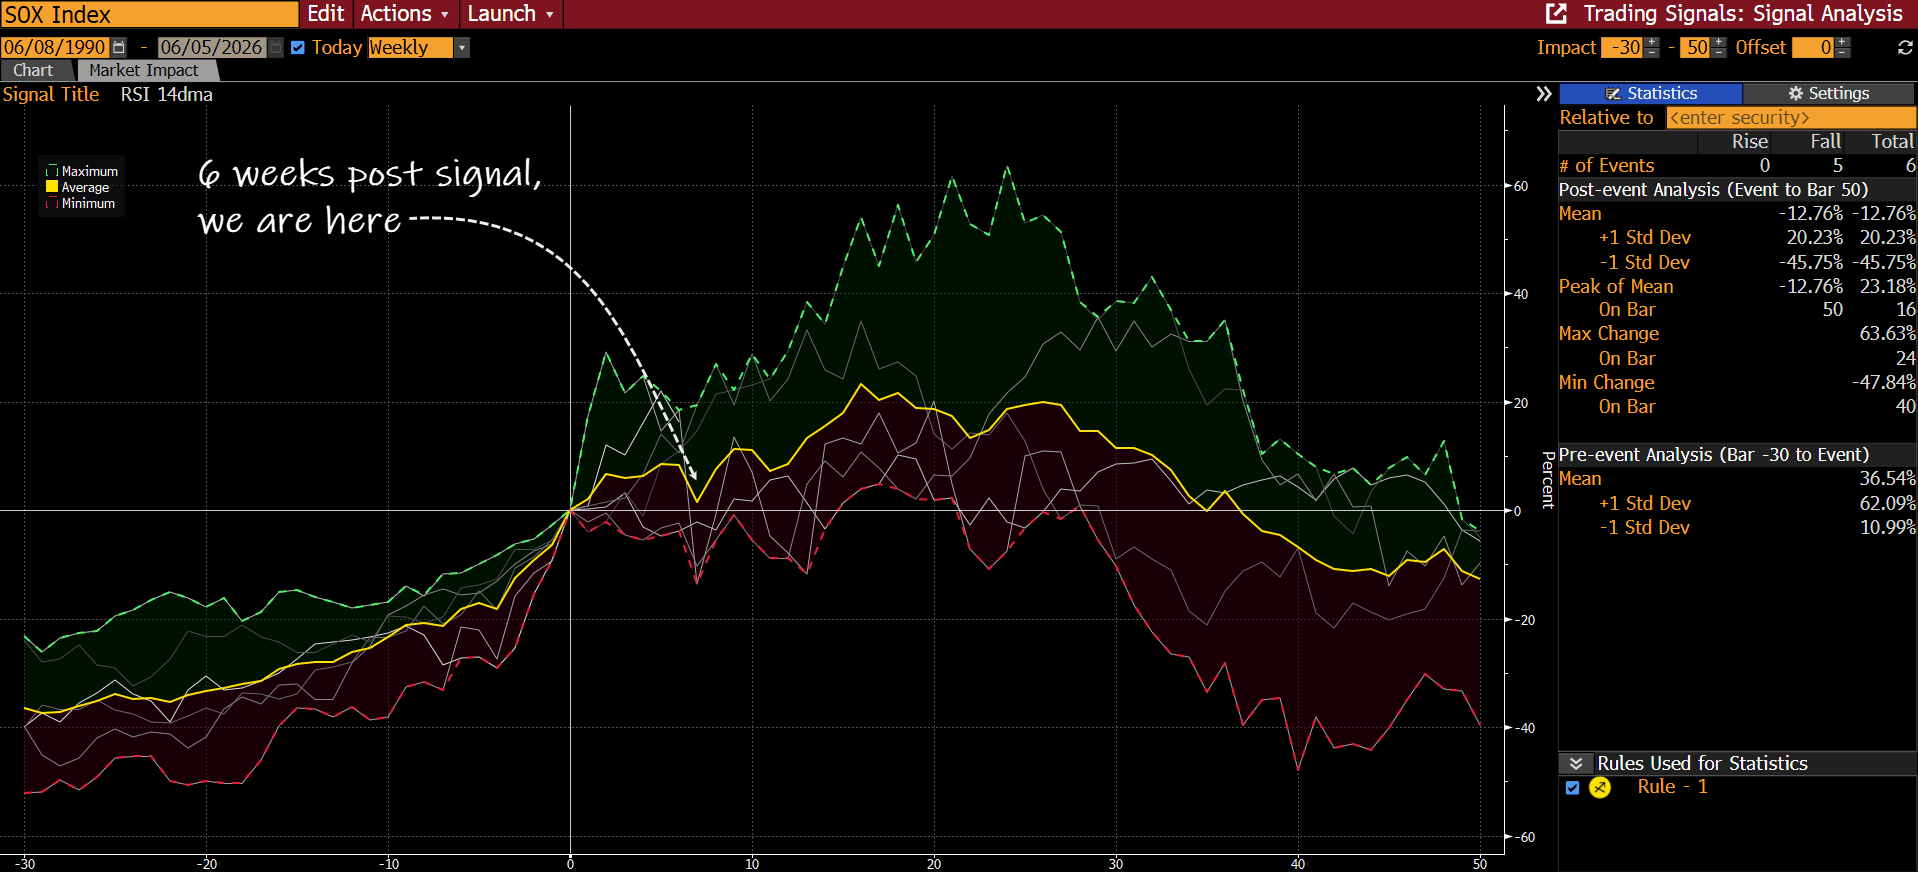
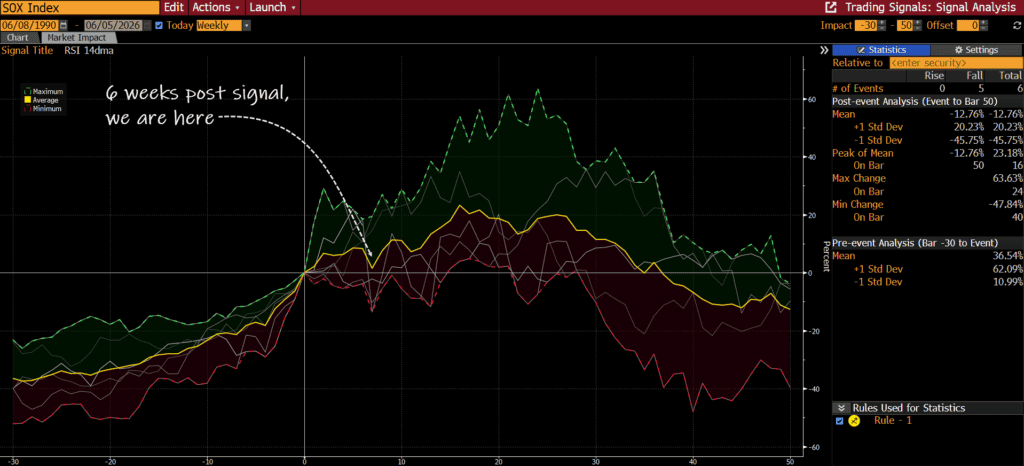
8. Historically, when weekly RSI on semis climbed above 80%, it preceded higher prices over the subsequent 13 weeks on average — before rolling over. In 5 of 5 instances, semis traded lower over the following 35 weeks, with an average forward 50-week return of -12.76%.
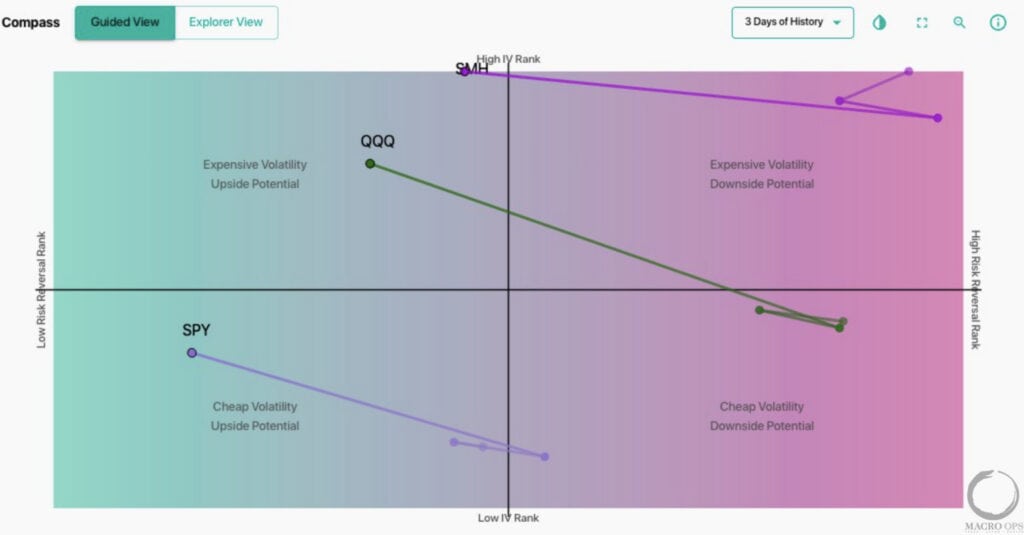
9. Here’s @spotgamma on Friday’s action:
“When someone answers “What do you think triggered the big stock market selloff Friday?”
They will come up with a large list of narratives, none of which mention positioning: People were choking on calls on Thursday, and purging all those calls on Friday.
ex: $SMH (pink) went from top right on this chart on Thursday (calls priced higher than puts in the +90% %’ile), to puts and calls being equally valued (i.e. center of chart).
Then look at how expensive QQQ options were INTO the Friday vs SPY (Y axis). Tech heavy Qs were massively overvalued related to SPY as everyone over-FOMO’d tech.
Positioning needed a reset.”
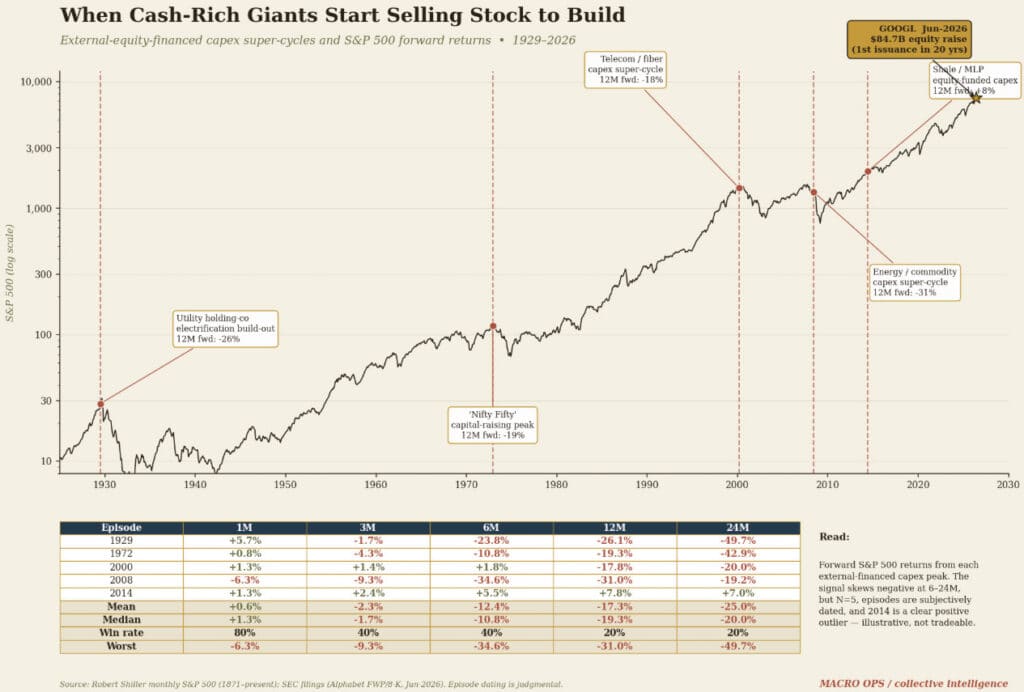
10. A few weeks ago we wrote about the coming tidal wave of new equity supply from mega IPOs and its historically bearish implications for equities over the following 12-24 months (link here).
Alphabet’s recent $84.7 billion equity raise adds a new data point. Cash-rich giants don’t sell stock — they buy it back. When Alphabet reversed a two-decade pattern to externally finance an AI build-out, it echoed a familiar sequence: a serial cash-returner pivoting to fund a demand-boom capex cycle. History has not been kind to that pattern. Telecom/fiber in 2000: -18% twelve months later. Energy in 2008: -31%. Four of five analogs since 1929 saw the S&P lower a year out, with mean forward returns of -17% at 12 months and -25% at 24.
The caveats are real: these tops took time to form (returns were flat-to-positive at 1-3 months), the sample is small (N=5, judgmentally dated, with 2014 shale a clean outlier), and capex itself has been priced for two years. Read this as weight-of-evidence, not a tradeable signal. The tell isn’t the surge in capex. It’s how it’s now being financed.
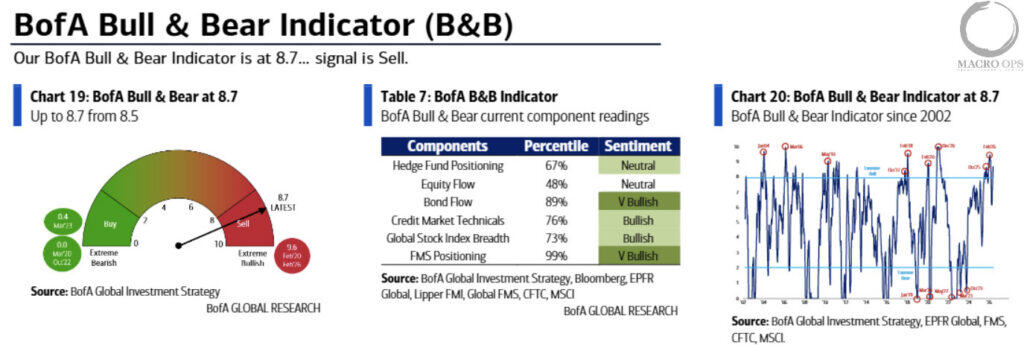
11. Another BofA Bull/Bear Sell Signal fired last week while our Trend Fragility indicator climbed to 76%, unphased by Friday’s selloff. Again, my bias is that markets trade a bit higher in the short-term (low conviction on this one) but I think we’re setting up for a larger Summer selloff.
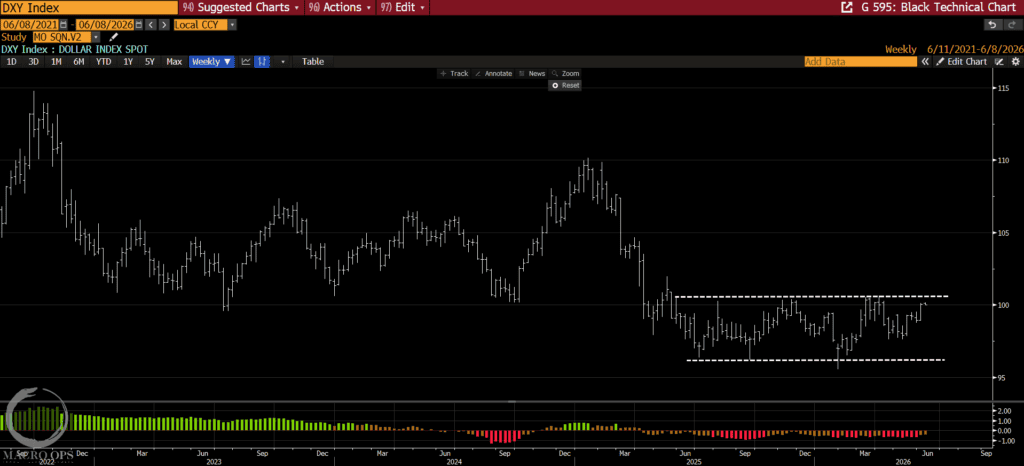
12. We’ll keep updating this weekly DXY chart until we get a breakout. Likely putting on a small starter long this week.
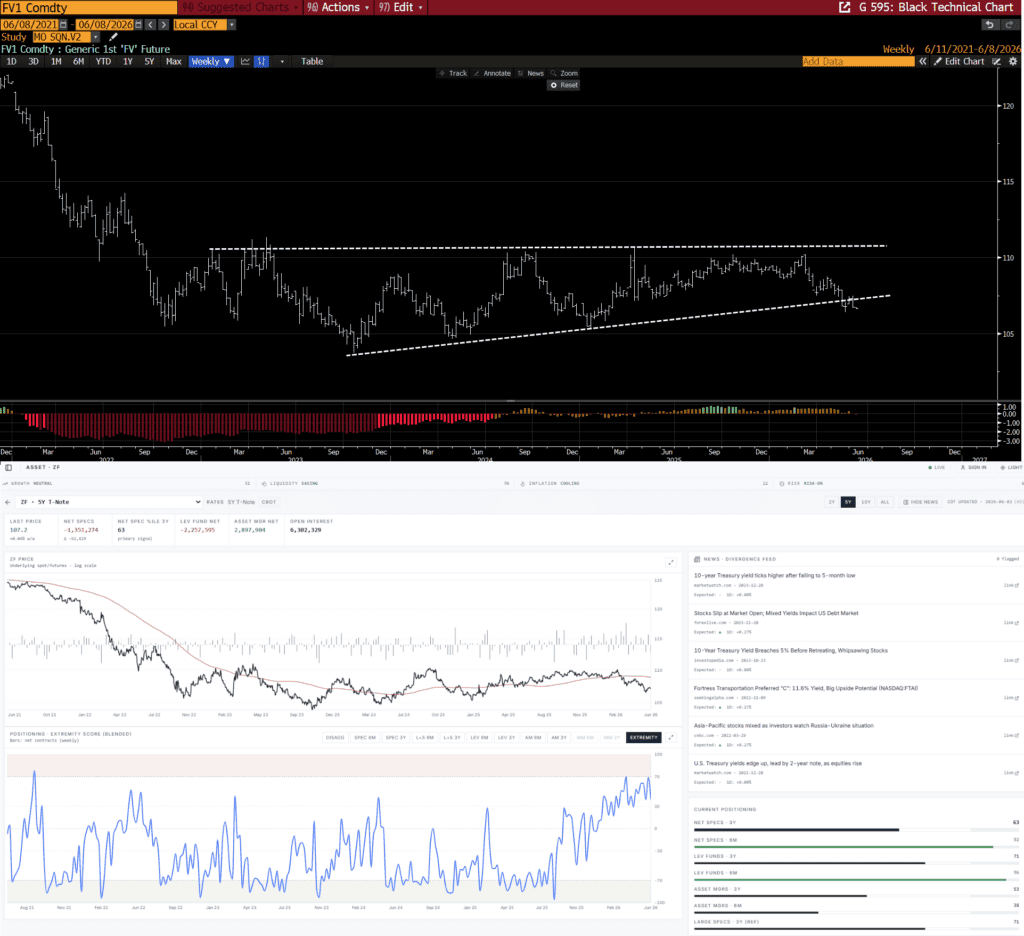
13. The constructive action in DXY is being driven by rising yields. 5-year Notes broke their triangle compression last week. Our positioning measure shows speculators near max crowded long levels.
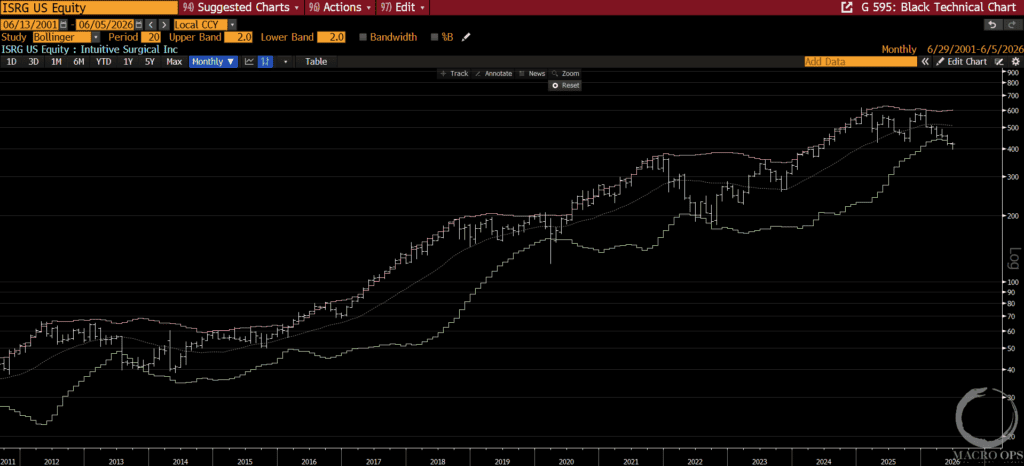
14. We’ve been flagging the healthcare setup for several weeks and have been slowly adding exposure. ISRG is a name we’re doing DD on.
The bull case: ISRG is the entrenched leader in robotic surgery with a dominant installed base and high switching costs. Revenue is increasingly driven by recurring instruments, accessories, and service — now over 80% of sales. Da Vinci 5 and SP are driving higher revenue per procedure. International expansion (including new Japanese reimbursement starting June 2026) and continued double-digit procedure growth underpin a 10-15% revenue CAGR with expanding margins and strong FCF. The buyback program is active: $2.3B repurchased in 2025, a $9.08B multi-year program completed in Q1 2026, and a new $5B authorization approved in May 2026.
The monthly chart: if ISRG holds its lower band — a level that has marked significant lows multiple times over the past decade — and closes the month strong, that’s technical validation for the bull thesis.
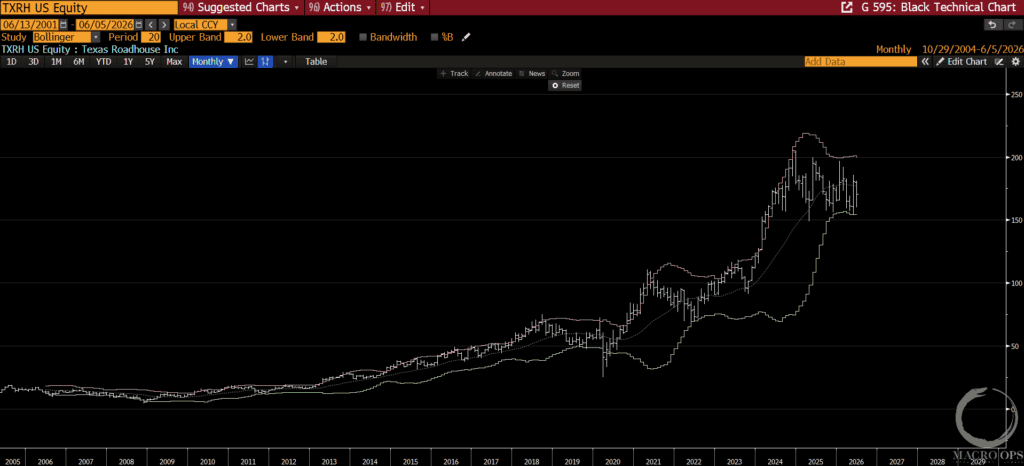
15. Over the weekend I drove past a Texas Roadhouse outside San Antonio. Packed parking lot on a Saturday. A family member said it’s always that way.
The bull case for TXRH: one of the few scaled casual-dining chains with consistently positive traffic, strong value perception, and best-in-class unit economics. They’ve put up 60+ consecutive quarters of comp growth and continue to take share in the steakhouse category, supported by resilient mid-income dining demand, easing beef costs, and improving throughput. Dividend recently hiked to $0.75/quarter. The board approved a new $500M buyback in February 2025; they’ve deployed roughly $150M of it through 2025 and continued buying in Q1 2026.
The monthly chart is compressing nicely. This looks like it’s setting up for a significant move.
Thanks for reading.