While amateurs go broke by taking large losses, professionals go broke by taking small profits. The problem, in a nutshell, is that human nature does not operate to maximize gain but rather to maximize the chance of a gain. ~ William Eckhardt
In this week’s Dirty Dozen [CHART PACK] we look at BAD earnings revisions, COVID-19 temporal arcs, and normalization estimates, before diving into gold’s relationship to volatility, checking out historic levels being hit in the stock/bond ratio, and discussing the bull case for emerging market equities, plus more…
***click charts to enlarge***
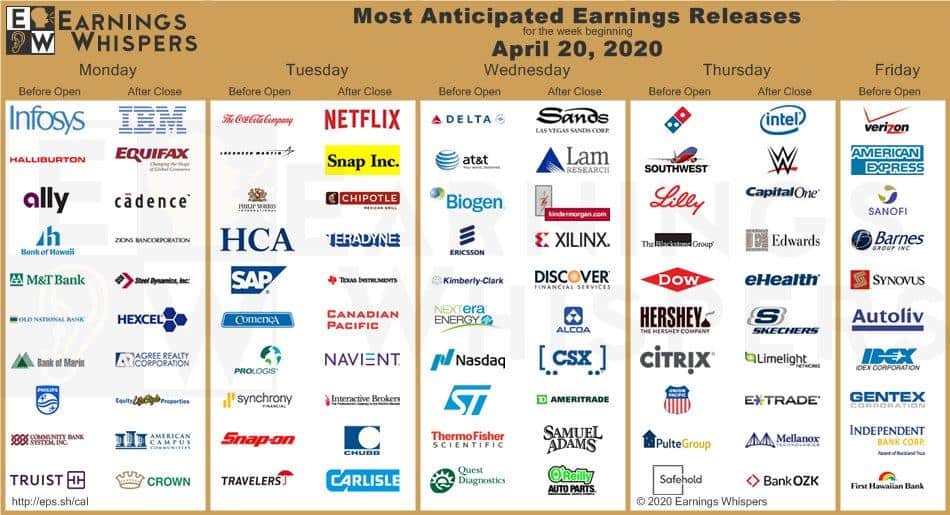
- Most anticipated earnings releases this week via @eWhispers: $NFLX $DAL $KO $INFY $HAL $LMT $ALLY $SNAP $T $DPZ $IBM $PM $INTC $LUV $CMG $BIIB $HCA $VZ $BOH $MTB $ONB $SAP $BMRC $CMA $PHG $AXP $ERIC $CBU $KMB $TFC $PLD $SYF $NEE $LII $NDAQ $LLY $SNA $LVS $TRV $LRCX $KALU $EMR $CIT $FITB
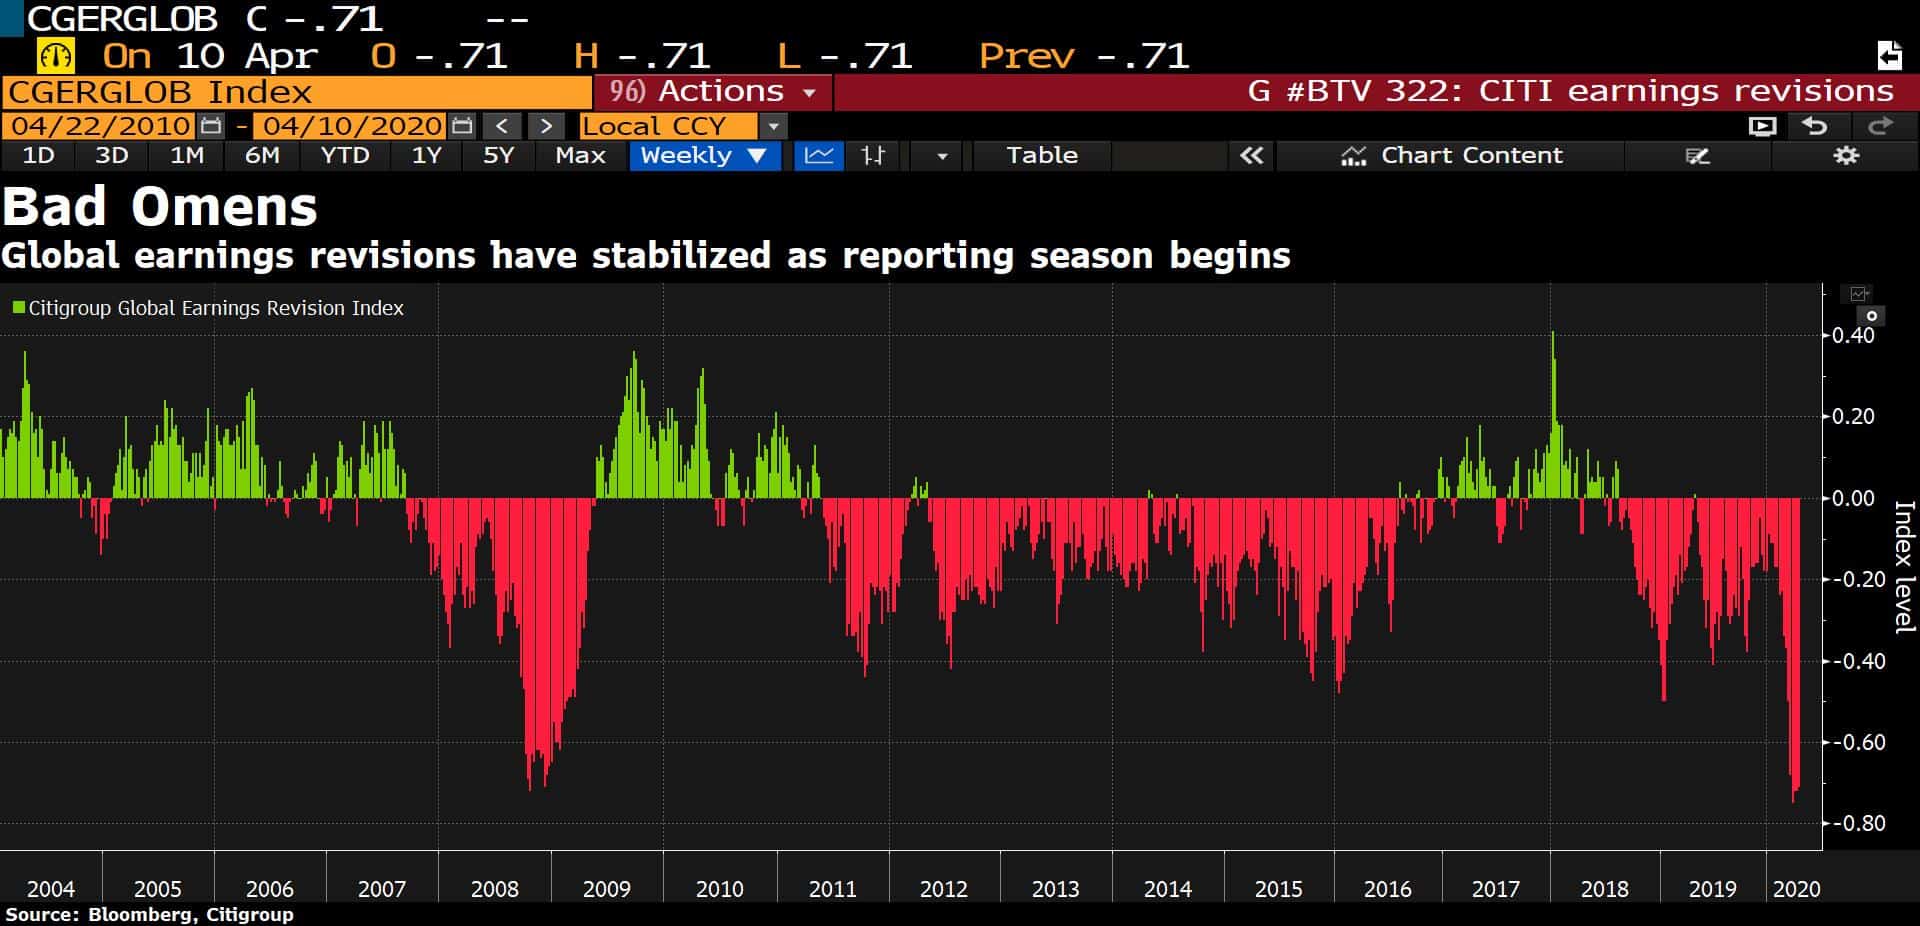
- Negative revisions to earnings have hit their lowest levels in history. The plus side is that they’ve steadied in recent days and a lot of bearishness is now baked into consensus (chart via Bloomberg).
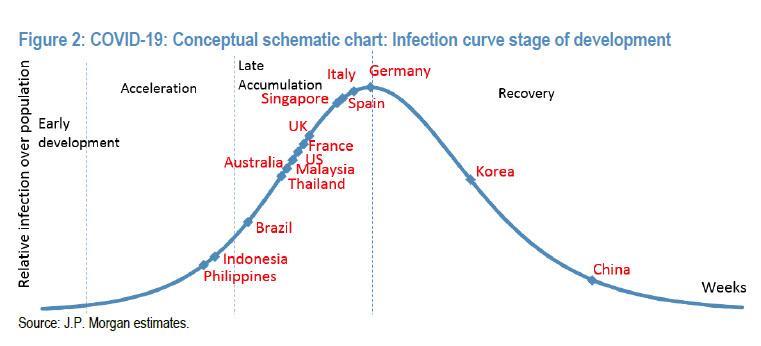
- According to JP Morgan’s conceptual schematic chart of COVID-19 cases, the US along with much of Europe is nearing the peak and will hopefully follow in Korea and China’s footsteps.
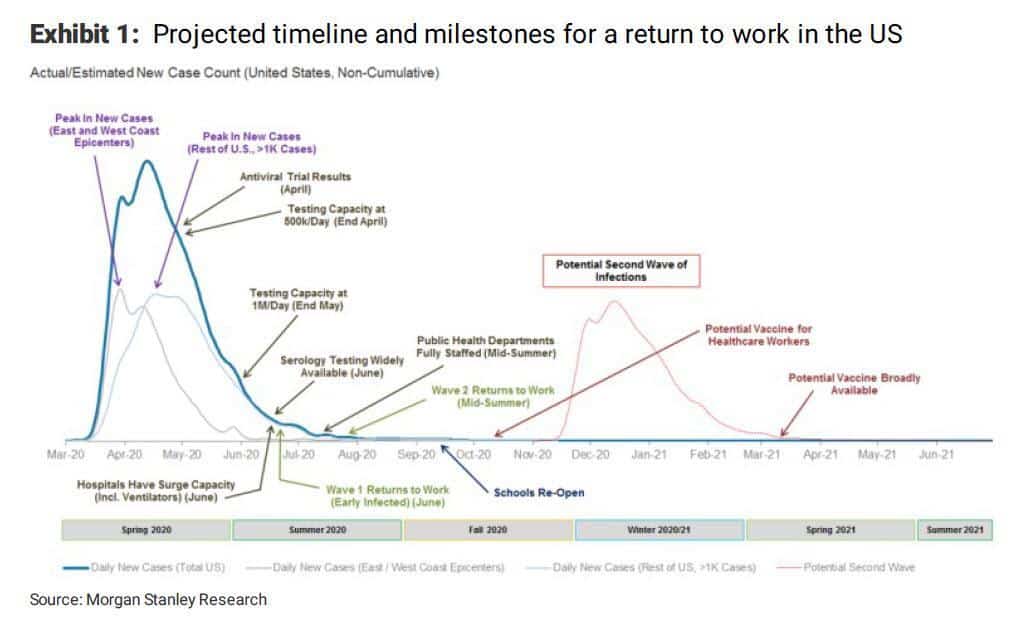
- But according to Morgan Stanley’s lead Biotech analyst Matthew Harrison, it’s far too early to rejoice. Matthew writes:
“Investors should realize that this won’t be a “normal” re-opening. In COVID-19: A Prescription to Get the US Back to Work, we argue that only after we see (1) adequate surge capacity in hospitals, (2) broad public health infrastructure to support testing for disease surveillance, (3) robust contact tracing to curtail “hot spots” and (4) widespread availability of serology testing (blood tests to see who is already immune to the virus) can the US confidently return to work. We see this happening in waves starting in mid-summer. Unfortunately, we think there will still be a large number of workers not able to go back to work until a vaccine is abundantly available as social distancing cannot be fully relaxed until we have herd immunity (~60% of people vaccinated).”
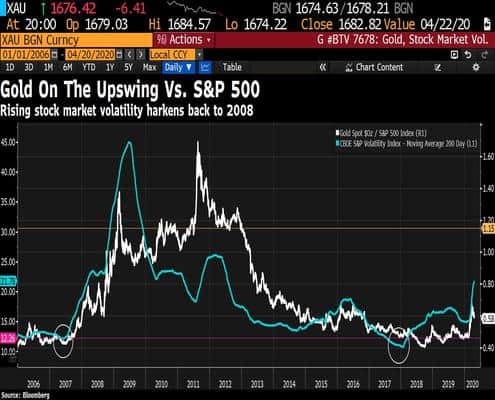
- This chart from Bloomberg shows the 200-day moving average of the CBOE VIX (blue line) along with the performance of gold relative to SPX. Will higher volatility keep real yields pinned down and hence drive gold higher like it did in 08’?

- I wrote the longer-term bullish case for gold the other week which you can find here. Gold had a weak close on Friday though and there are decent odds it starts another period of extended volatile sideways-to-down chop again. There is crowded spec long positioning that needs to be shaken out. A close below the 1,650 level would nullify the inverted H&S pattern and put me back on the sidelines.

- According to Bloomberg, “U.S. stocks have gone through their biggest bout of weakness relative to Treasury securities in decades… The ratio started this month by closing at its lowest level since 1983 after tumbling 85% from a high in October 2018.”

- Invesco shared a similar chart along with the YoY% graph in a recent chart pack (link here). I’m of the opinion that we’re headed for some form of yield curve control here in the US, similar to Japan. The world has too much debt and can’t stomach high real rates. So maybe this ratio is less important in today’s world? Or maybe it’s not. Have to keep an open mind and if there’s one thing that can kill the long gold trade for good it’d be higher rates.

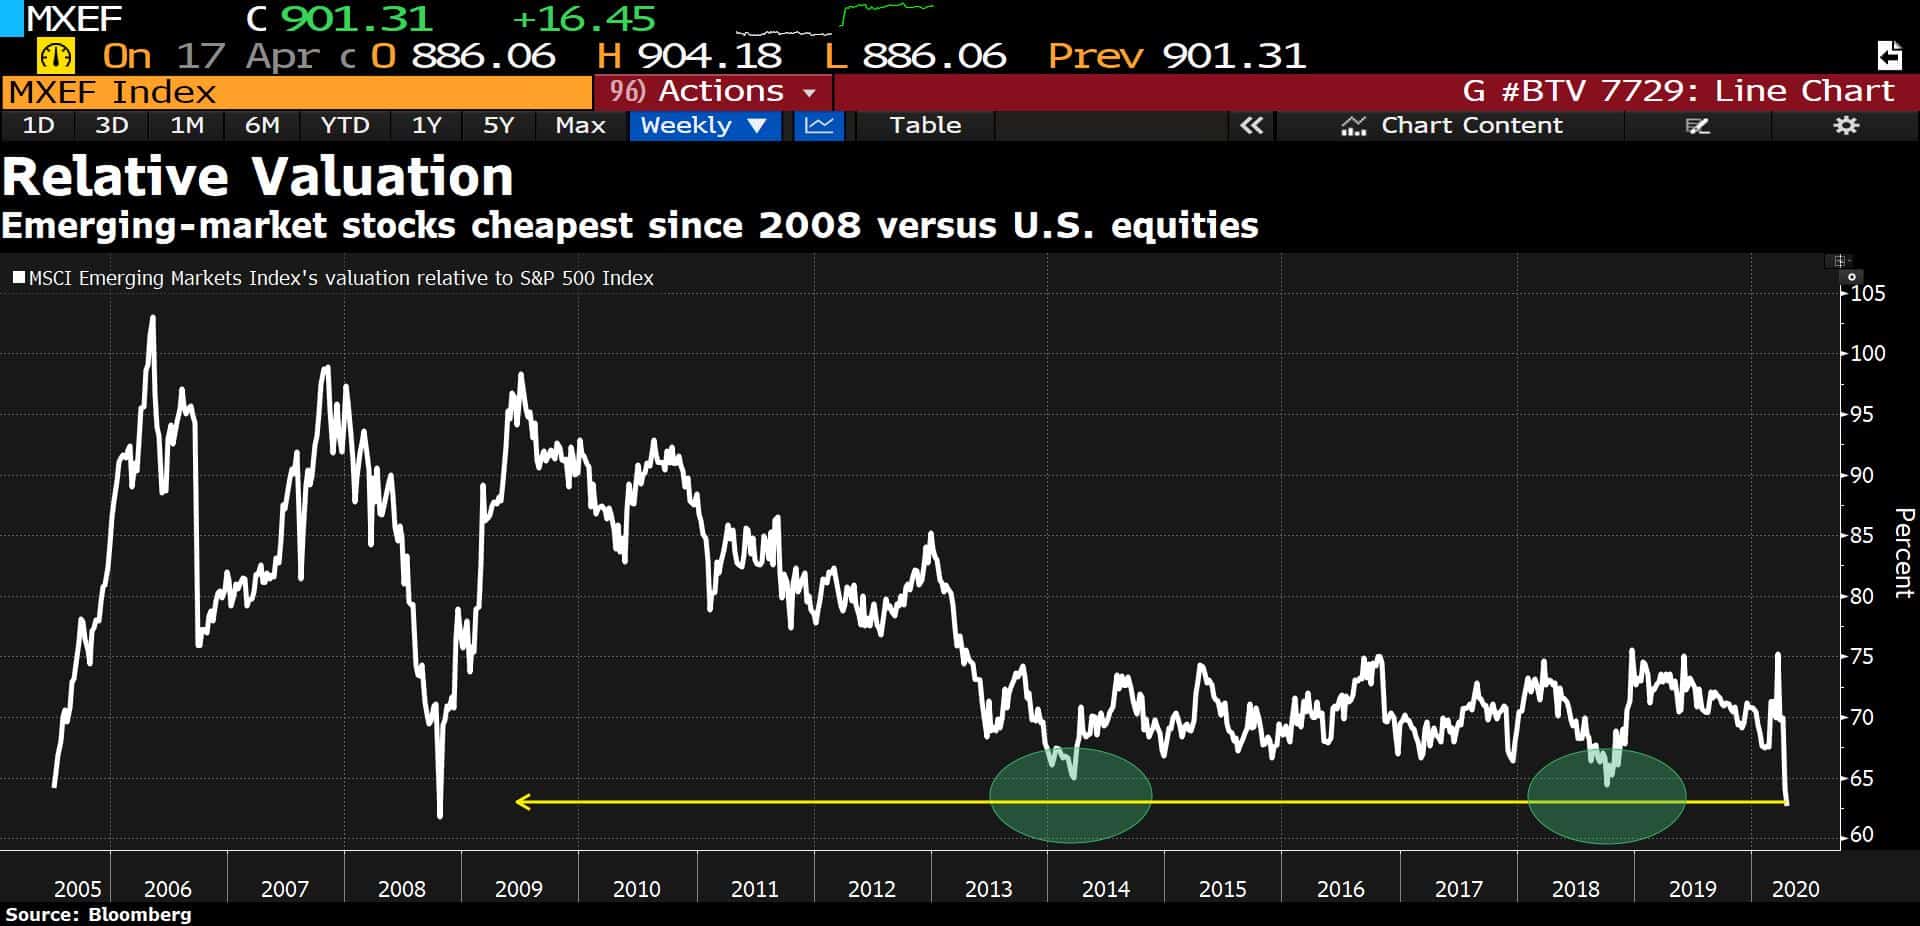
- EM stocks have only been this cheap relative to the SPX one other time and that was at the bottom of the 08’ market rout. You know what could cause some mean reversion here? Some big Chinese stimulus… It just so happens that aggregate financing hit a new YoY% high last month and excavator sales in the country — a sign of infrastructure building on the way — hit a new record high in March. This could also potentially cause rates to spike.
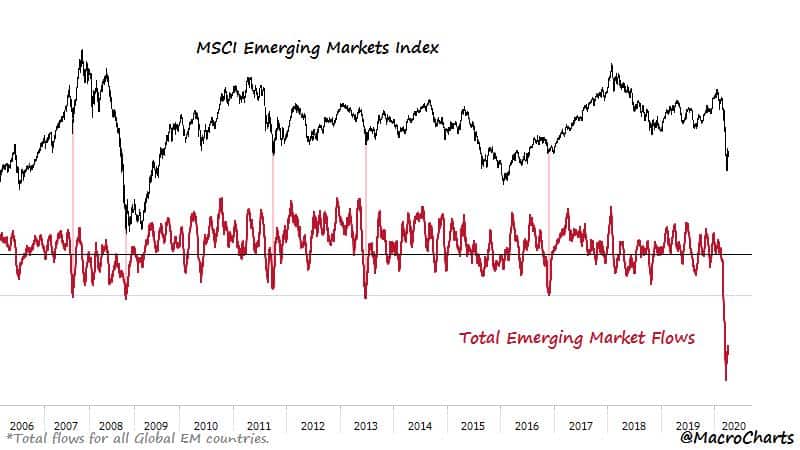
- This would be great timing since as @MacroCharts recently pointed out:
“Emerging Markets just suffered the most aggressive selling purge on record (like almost everything else).
Flows are starting to turn up again.
Similar inflections marked every Major bottoming phase in 20 years – and preceded ALL of EM’s biggest historic rallies.”
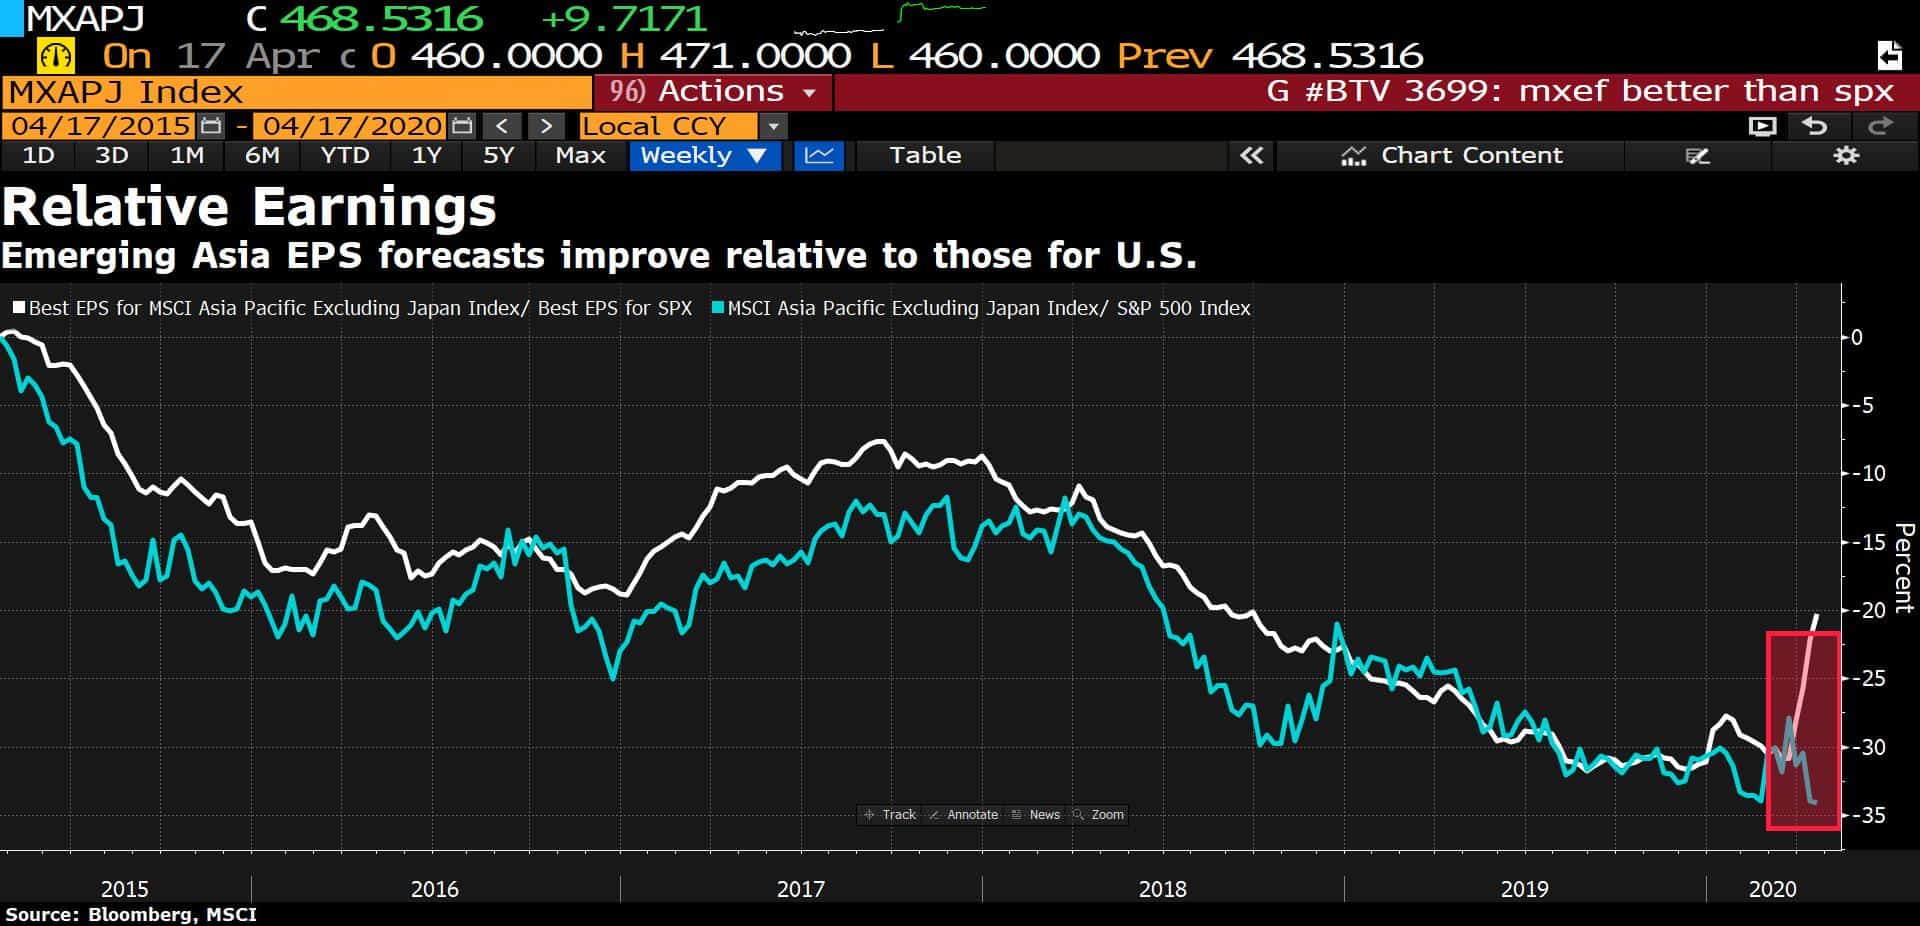
- And EM Asia EPS earnings forecasts relative to SPX EPS is inflecting higher. Do we see some catch up soon?
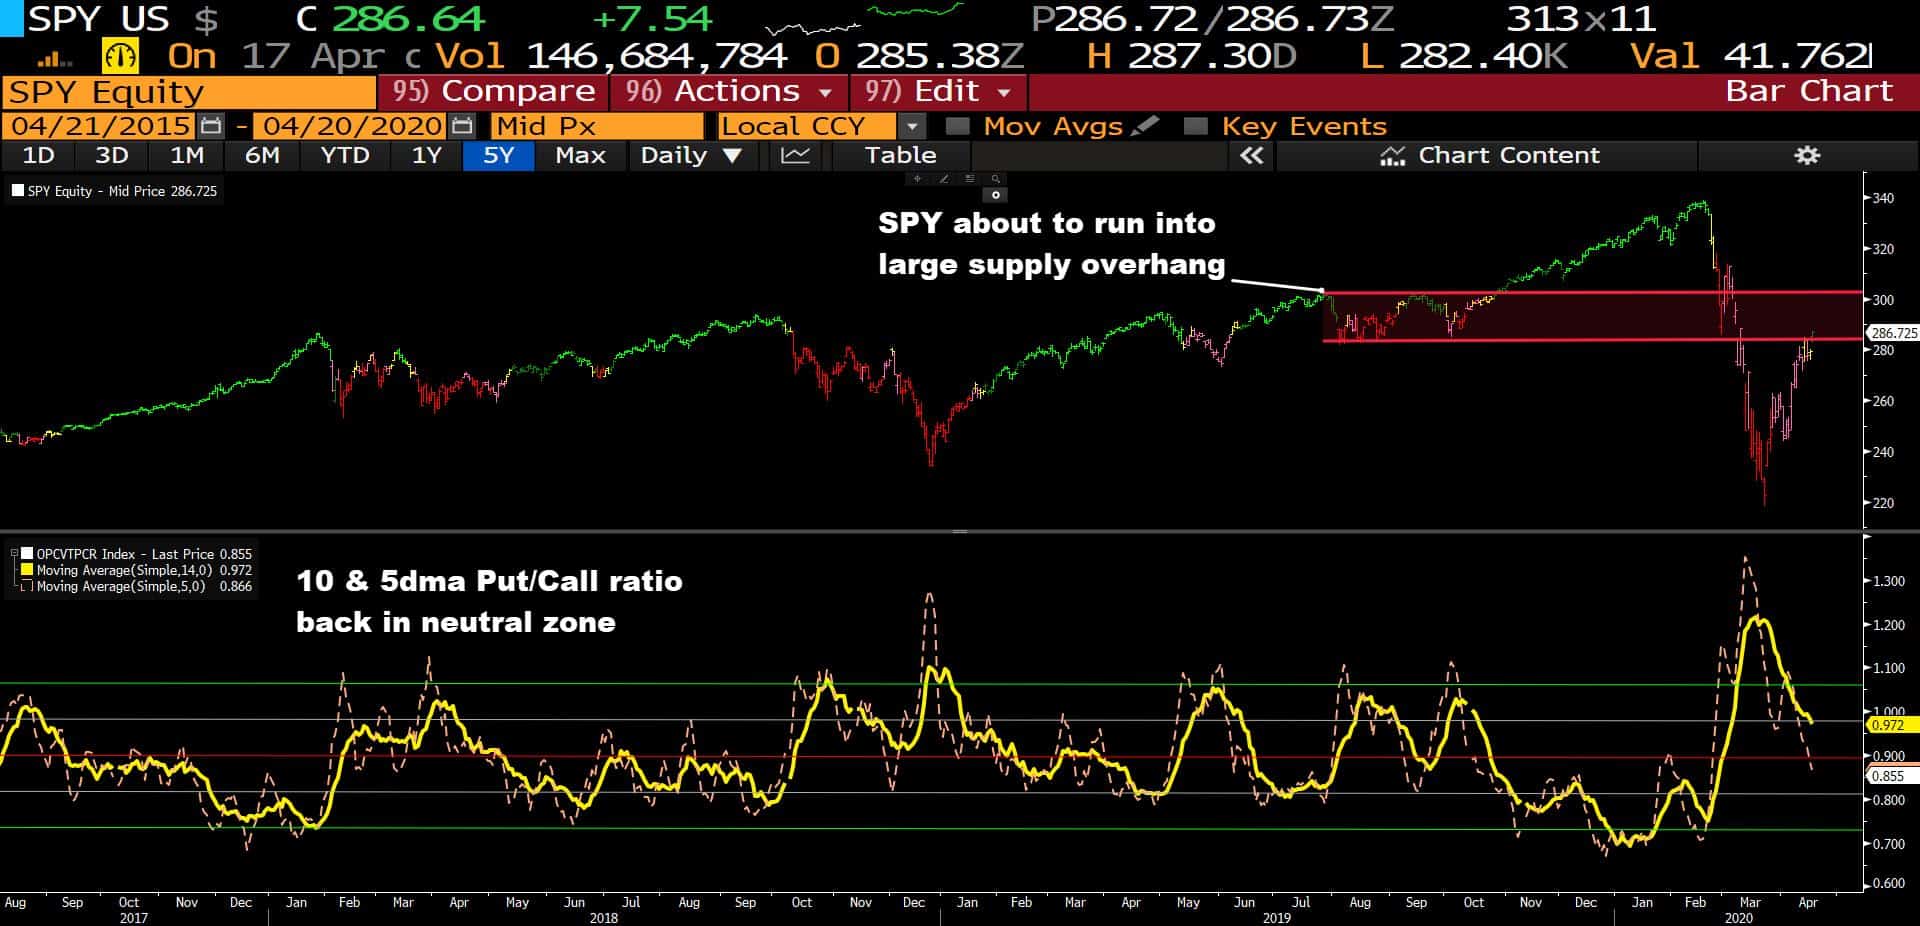
- Looking at US indices the odds favor some more gains over the very short-term. But… the SPX is about to run into a large supply overhang in the 3,000-3,100 level (red channel below). And a further push higher will likely drive put/call dma’s back into sell territory. The time to buy was two weeks ago. Not now.
Stay safe out there and keep your head on a swivel!