The people that I know who are the most successful at trading are passionate about it. They fulfill what I think is the first requirement: developing intuitions about something they care about deeply, in this case, trading… They develop a deep knowledge of whatever form of analysis they use. Out of that passion and knowledge, their trading ideas, insights, and intuitions emerge. ~ Charles Faulkner
Click here to get the Dirty Dozen straight to your inbox every Monday morning
Good morning!
In this week’s Dirty Dozen [CHART PACK] we look at the broadening top in the SPX and add to the case that we’ve put in a short-term bottom and cover some of the liquation values on offer in global markets. We then talk about the troubling signs of a global recession on the horizon and what to keep an eye on as we go forward. And finish with a look at the global fiscal response, what it means, along with what the Fed’s done to relieve USD pressure, plus more. Let’s dive in…
***click charts to enlarge***
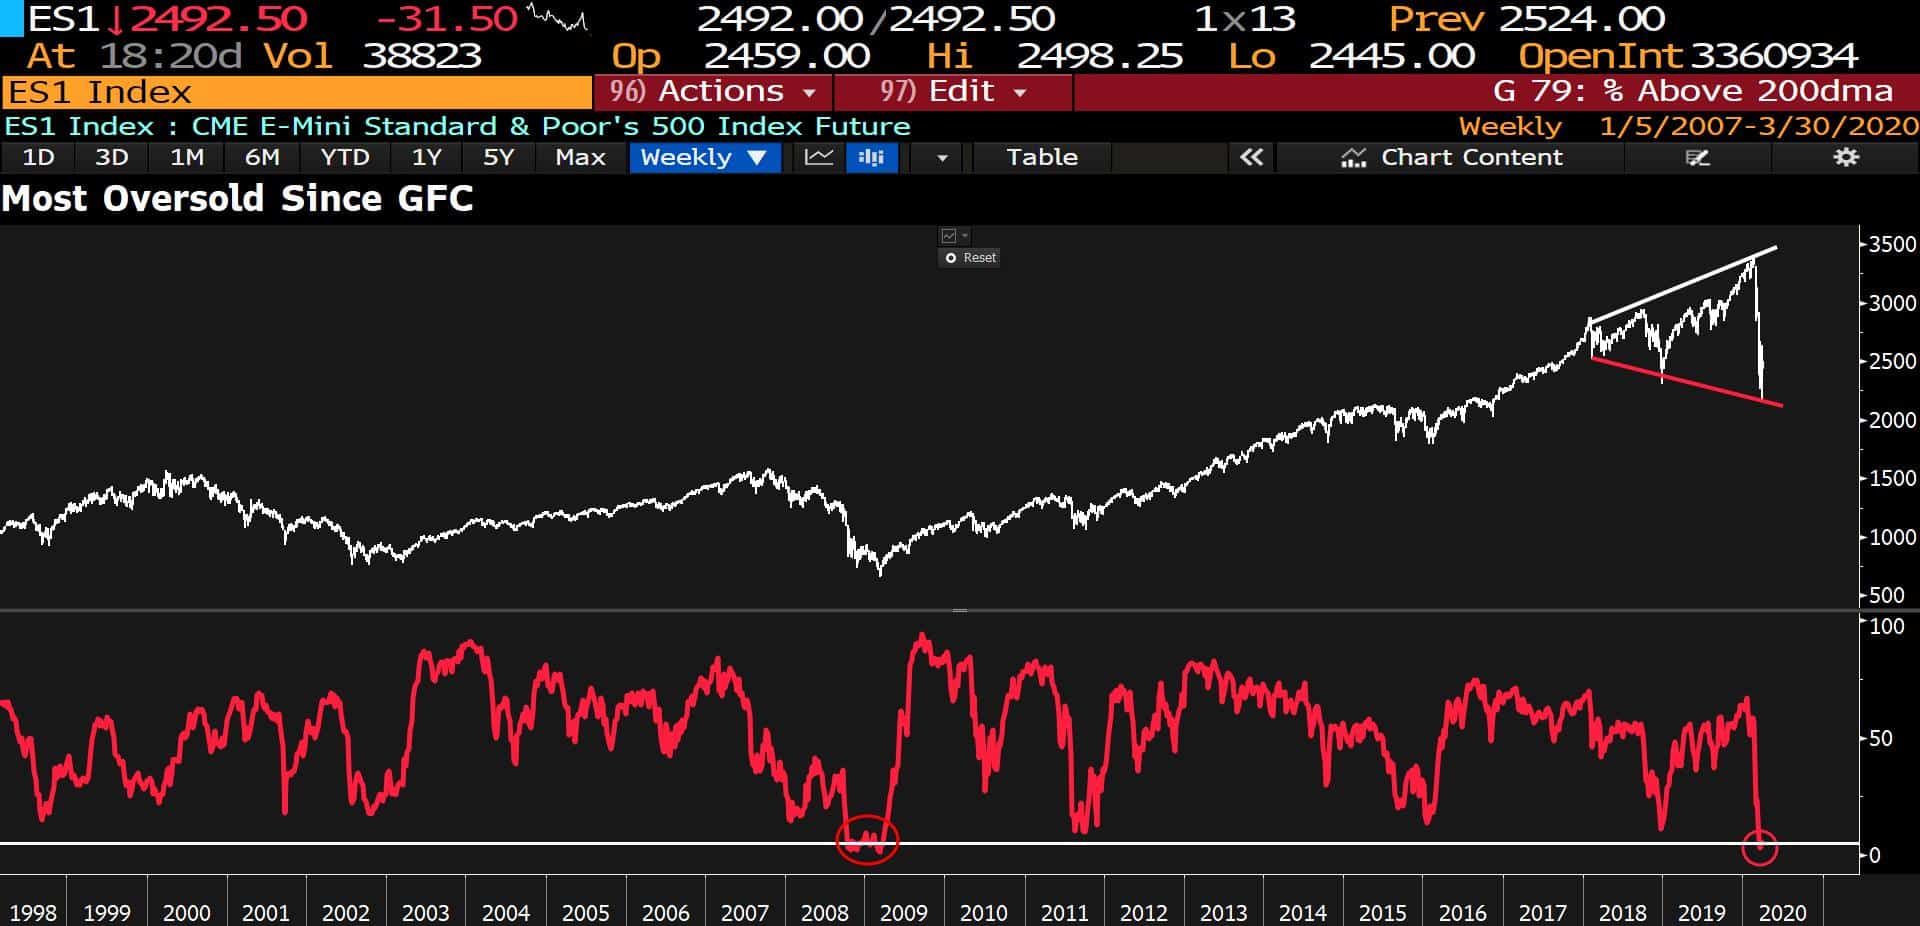
- Last week I wrote about the deeply oversold levels, consensus negative sentiment, and how we should expect a bear market rally to soon begin (link here). The chart below shows the primary technical pattern I’m tracking. The S&P is bouncing off the bottom support of a large broadening top pattern. The percent of stocks trading above their 200 day moving averages fell below 5% for only the second time in 25+ years.
That marks extreme oversold conditions. Markets don’t move in straight lines. And especially now that the Fed has largely fixed the plumbing issues, minimizing liquidity gap risks. It makes me think we’re about to see a large multi-week rally from here. Watch to see where the monthly bars close on Tuesday. That will be a big tell as to where things are headed for April.
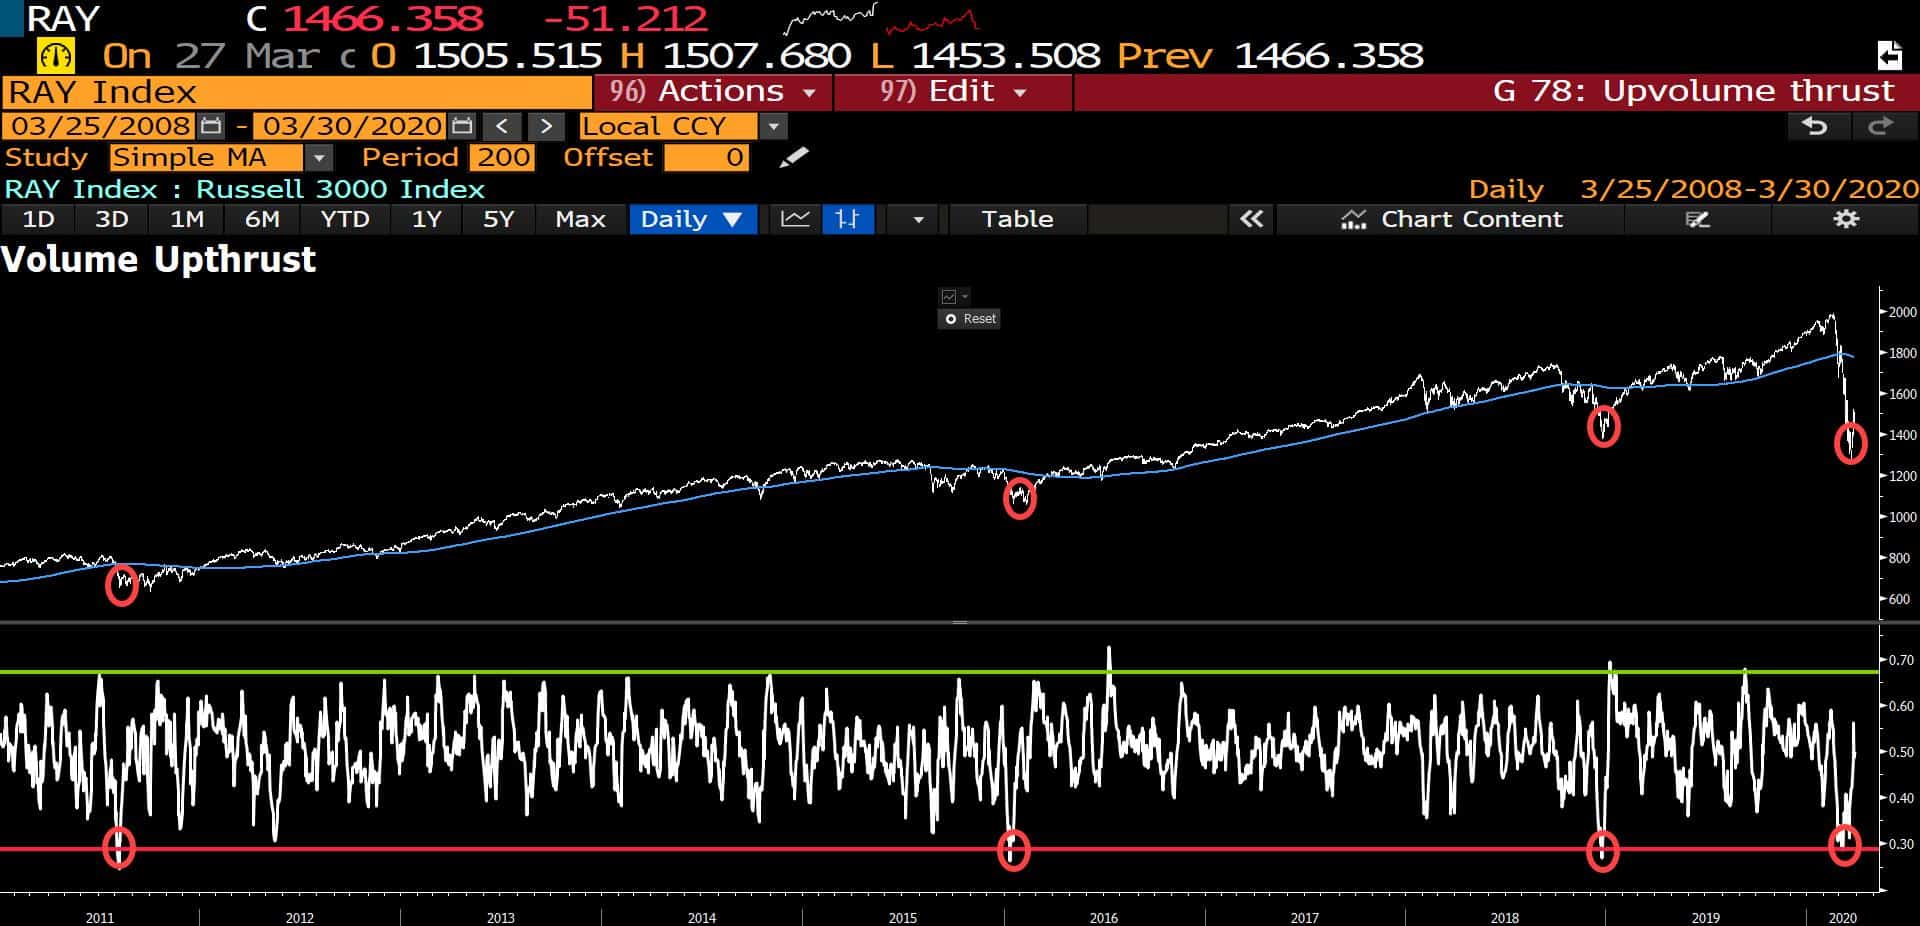
- To add to the short-term bullish case, I’ve been seeing an across the board improvement in breadth and under-the-hood technicals to support a run higher. For example, the chart below shows the smoothed average daily advancers volume ratio for the Russell 3000. The red circles show the points which mark past selling exhaustion points followed by strong recoveries. Each time created at least a temporary bottom.
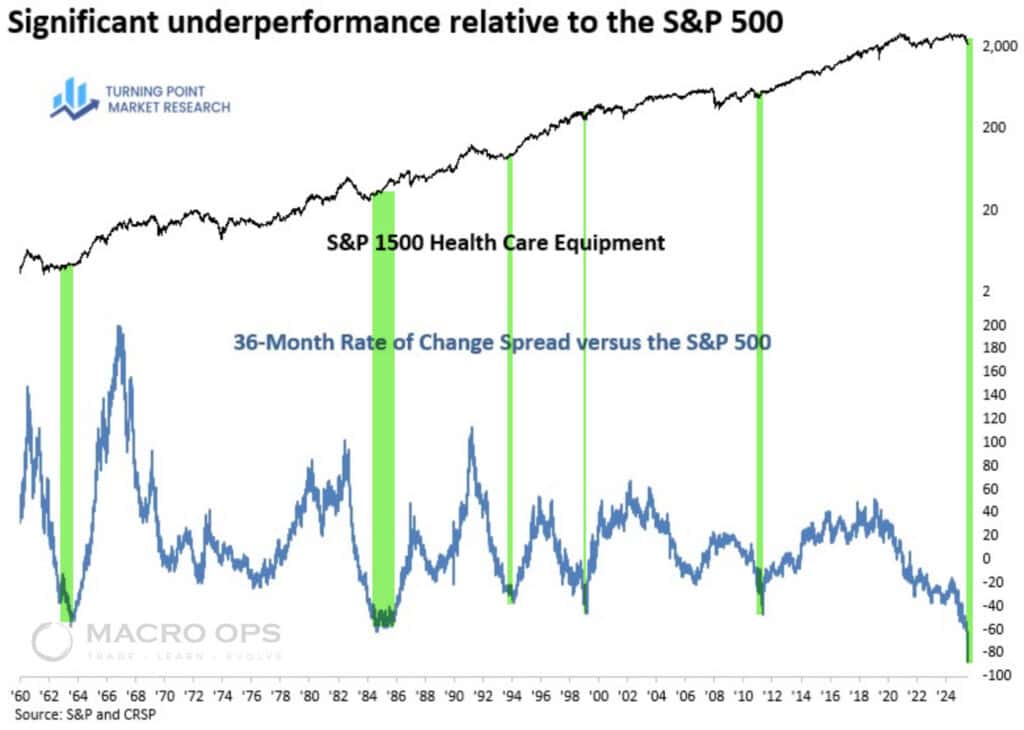
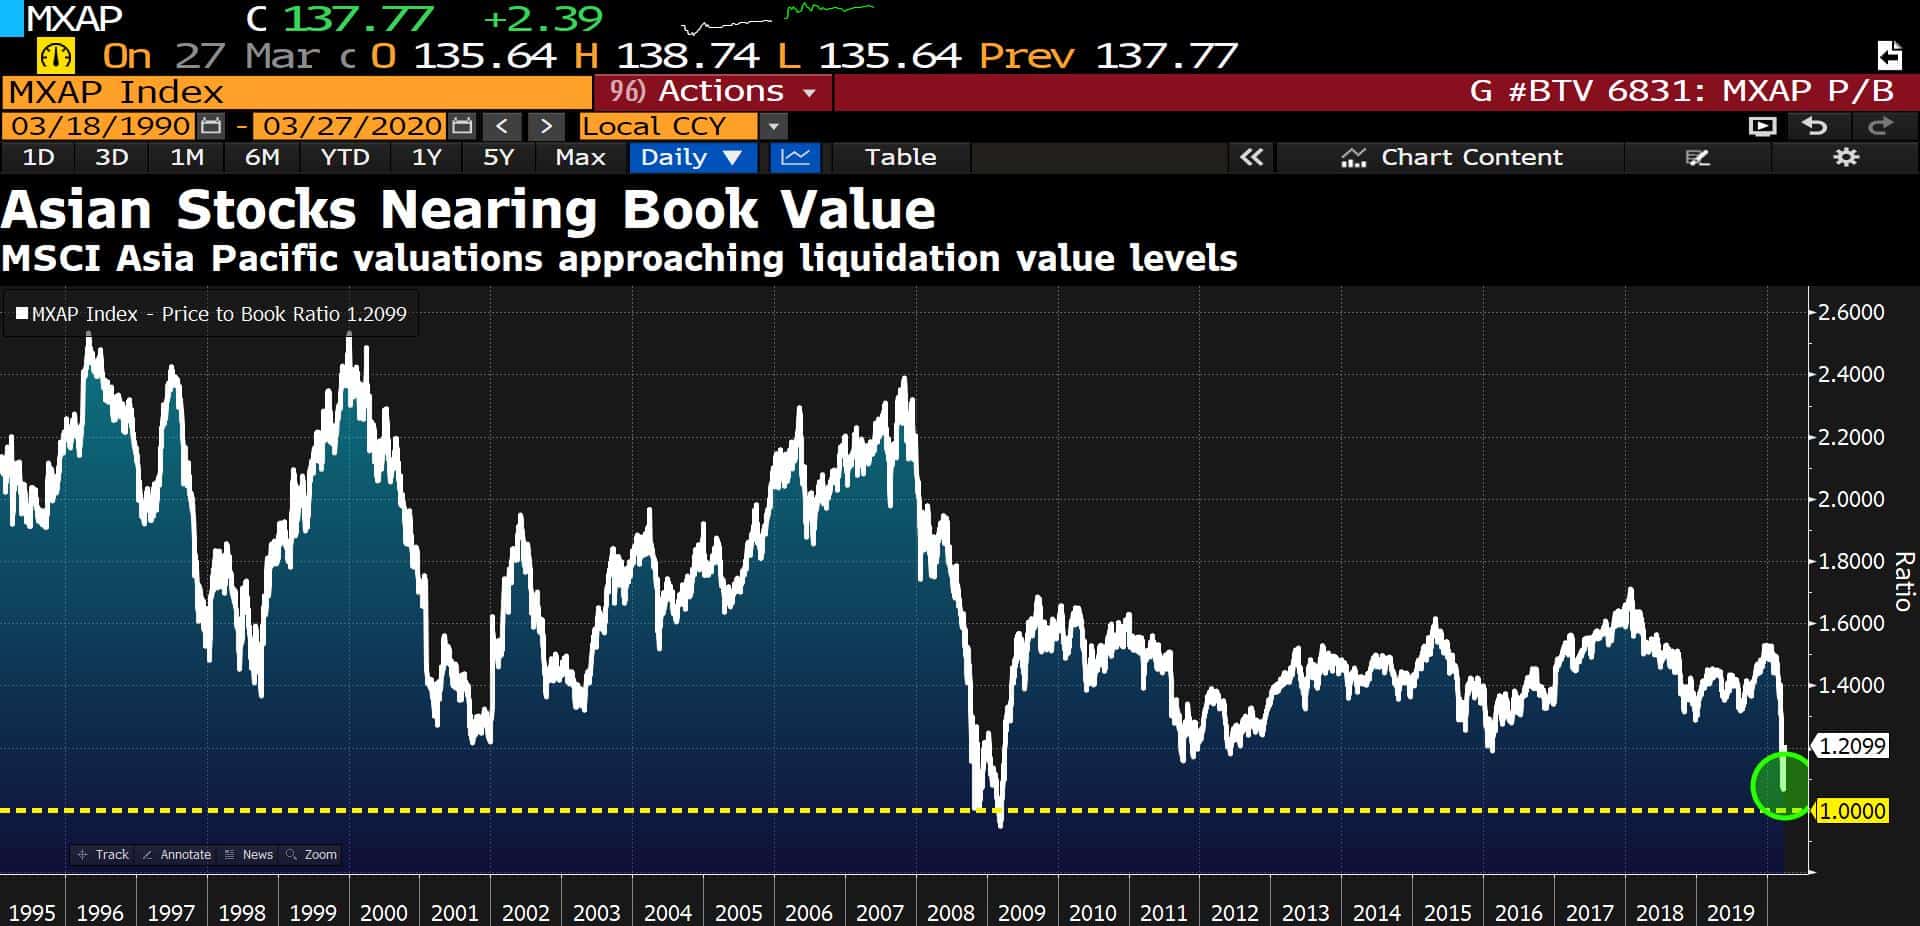
- It’s wild looking at many of the valuations around the world right now. I can show chart after chart of entire country indices selling for 2stdev’s below their long-term average multiples. MSCI Asia Pacific stocks, for instance, are trading at liquidation levels, last seen at the depths of the GFC.
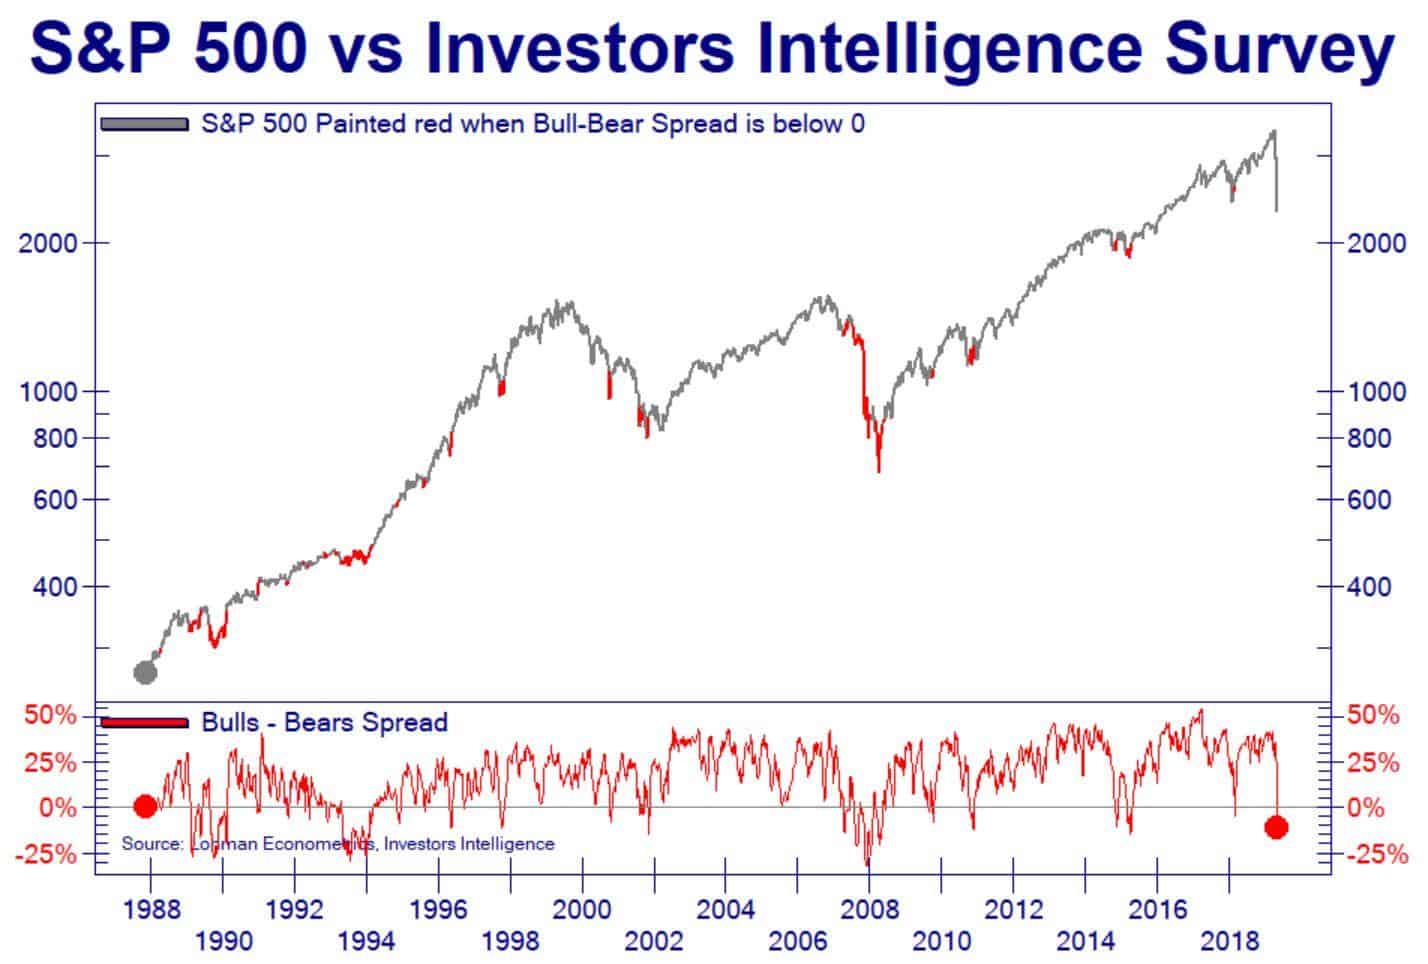
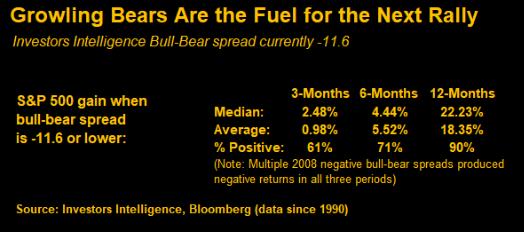
- The Investors Intelligence Survey Bull/Bear spread turned negative for only the 6th time this cycle (h/t @Not_Jim_Cramer). The graph below from Bloomberg shows the following returns after the II spread turns negative.
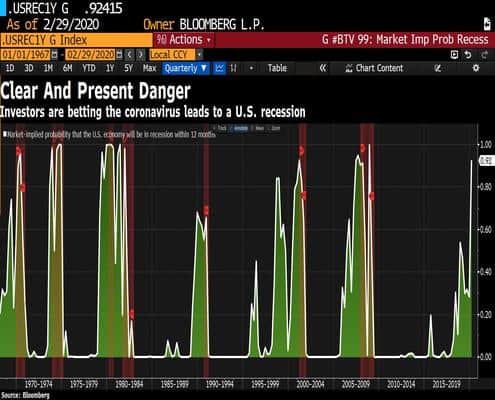
- While I’m positioning for an extended tactical bounce I’m expecting a severe recession and a new low in the market within the next 12-months. The market-implied probability of the US slipping into recession within the next year is now 92%.

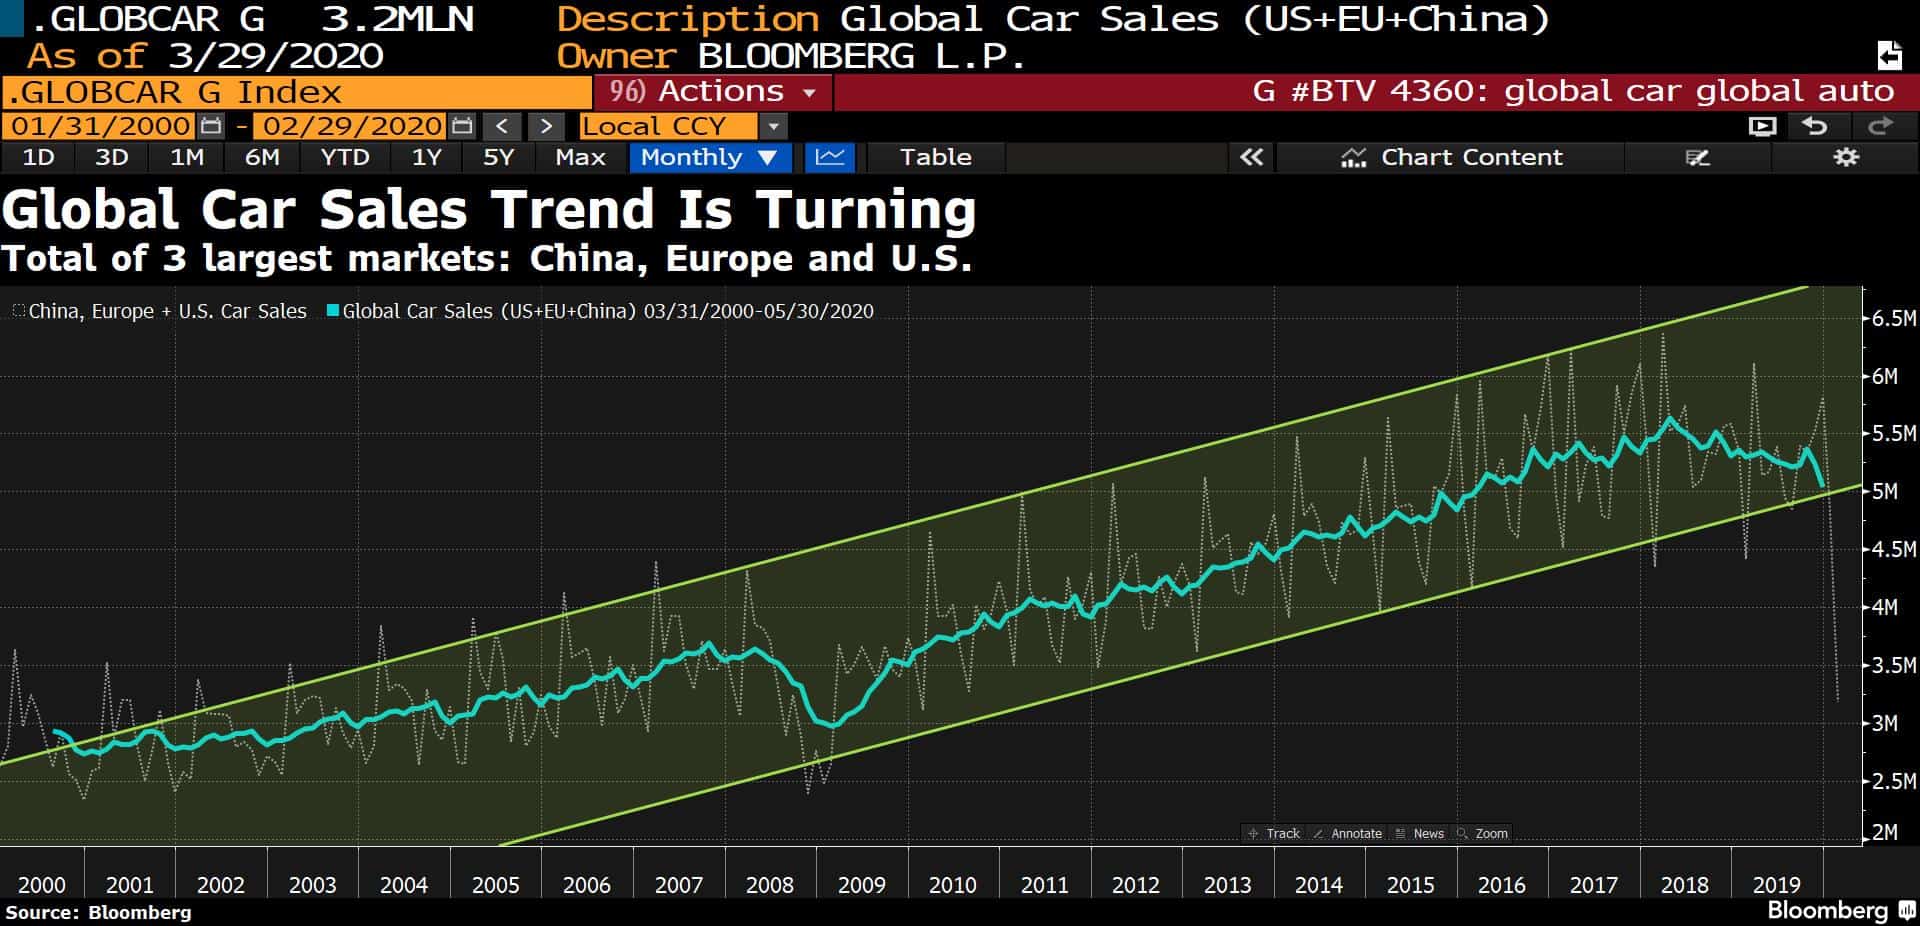
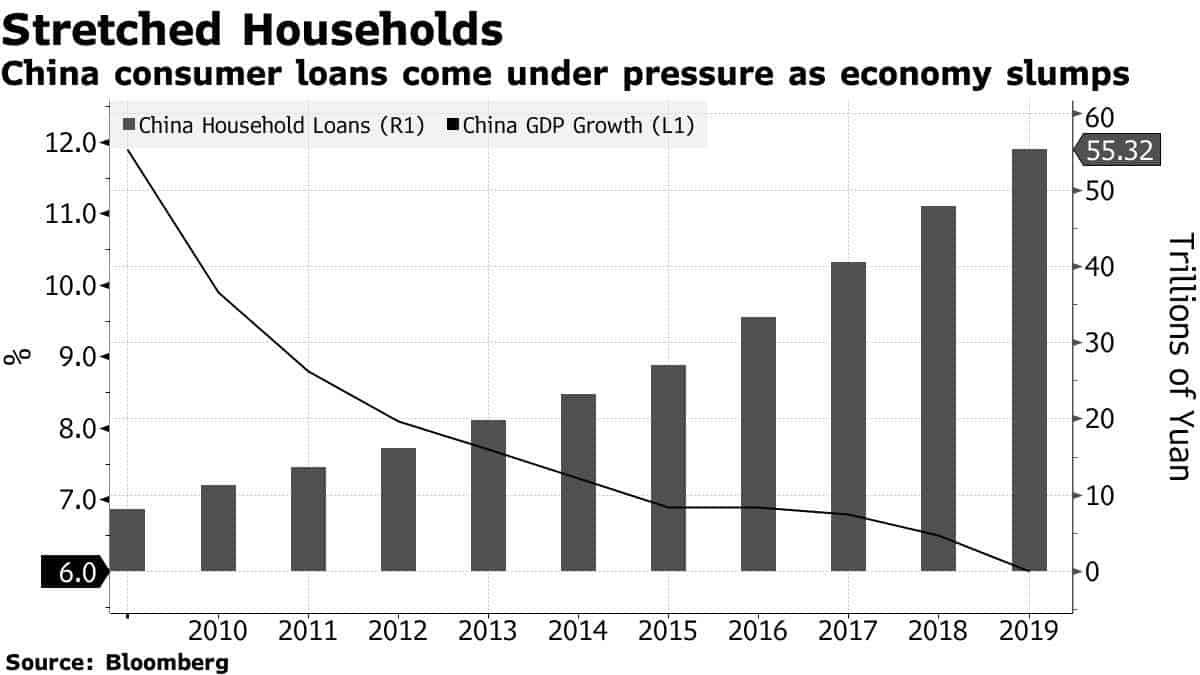
- Global car sales have fallen way below their long-term trendline as you’d expect. This trend had turned well in advance of the virus, driven by some changes to environmental standards in both China and Germany, along with just overall weakening demand in China. Thinking through things now, the big question is how long will this virus hang over us? Even if we can get R0 down to 1 or below within the next few months, will we have to worry about a second wave in the Fall? How will this affect consumer behavior, will we save more and spend less? Will companies hold back on CAPEX and slow hiring plans? (chart via Bloomberg).
- According to Bloomberg, “Overdue credit-card debt swelled last month by about 50% from a year earlier” in China (link to the article here). The virus is having ripple effects throughout a very leveraged global economy. The article goes onto point out that “ In Australia, which has the highest household debt levels among G20 nations, the country’s largest lender said on Thursday that its financial assistance lines are receiving eight times the normal call volume. A similar surge in queries has flooded lenders in the U.S., where credit-card balances swelled to an unprecedented $930 billion last year and 3.28 million people filed for jobless benefits during the week ended March 21 — quadruple the previous record.”
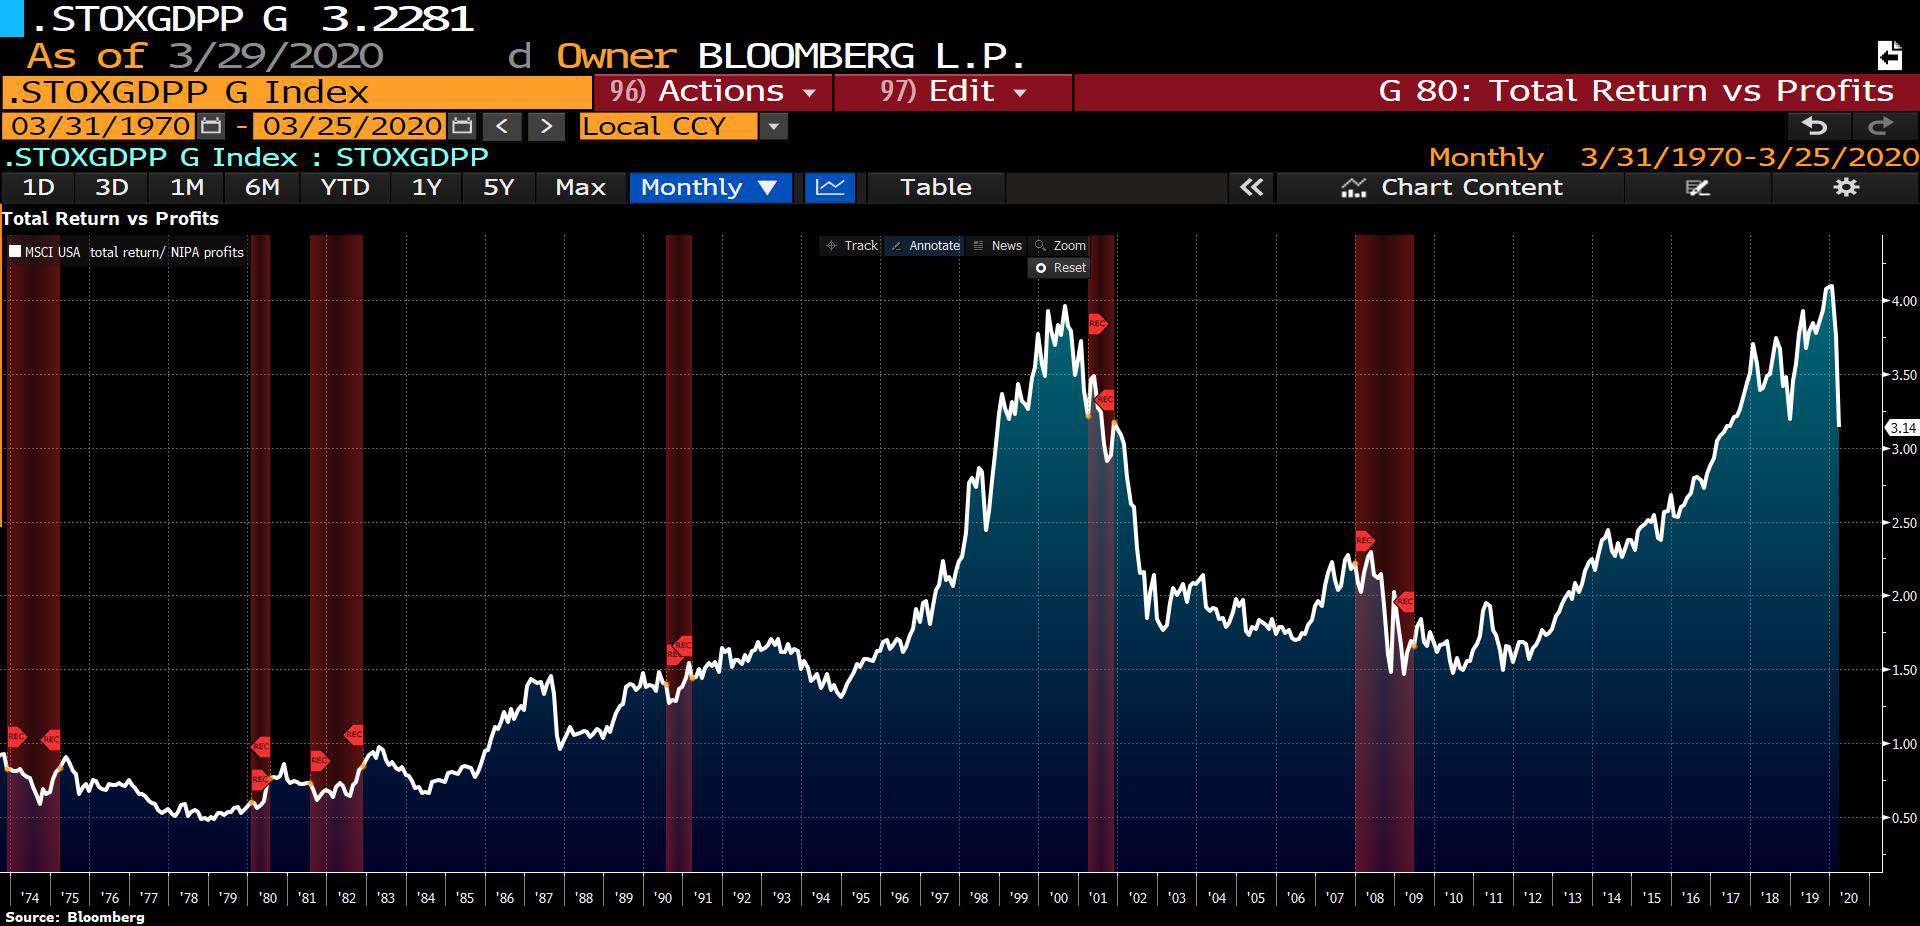
- If you look at total US market returns relative to NIPA profits, things still appear to be quite stretched; even after our recent haircut. I don’t see any reason why this chart couldn’t revert back to somewhere closer to its longer-term average, which would entail a much deeper bear market than what’s already occurred (h/t Macro Man).
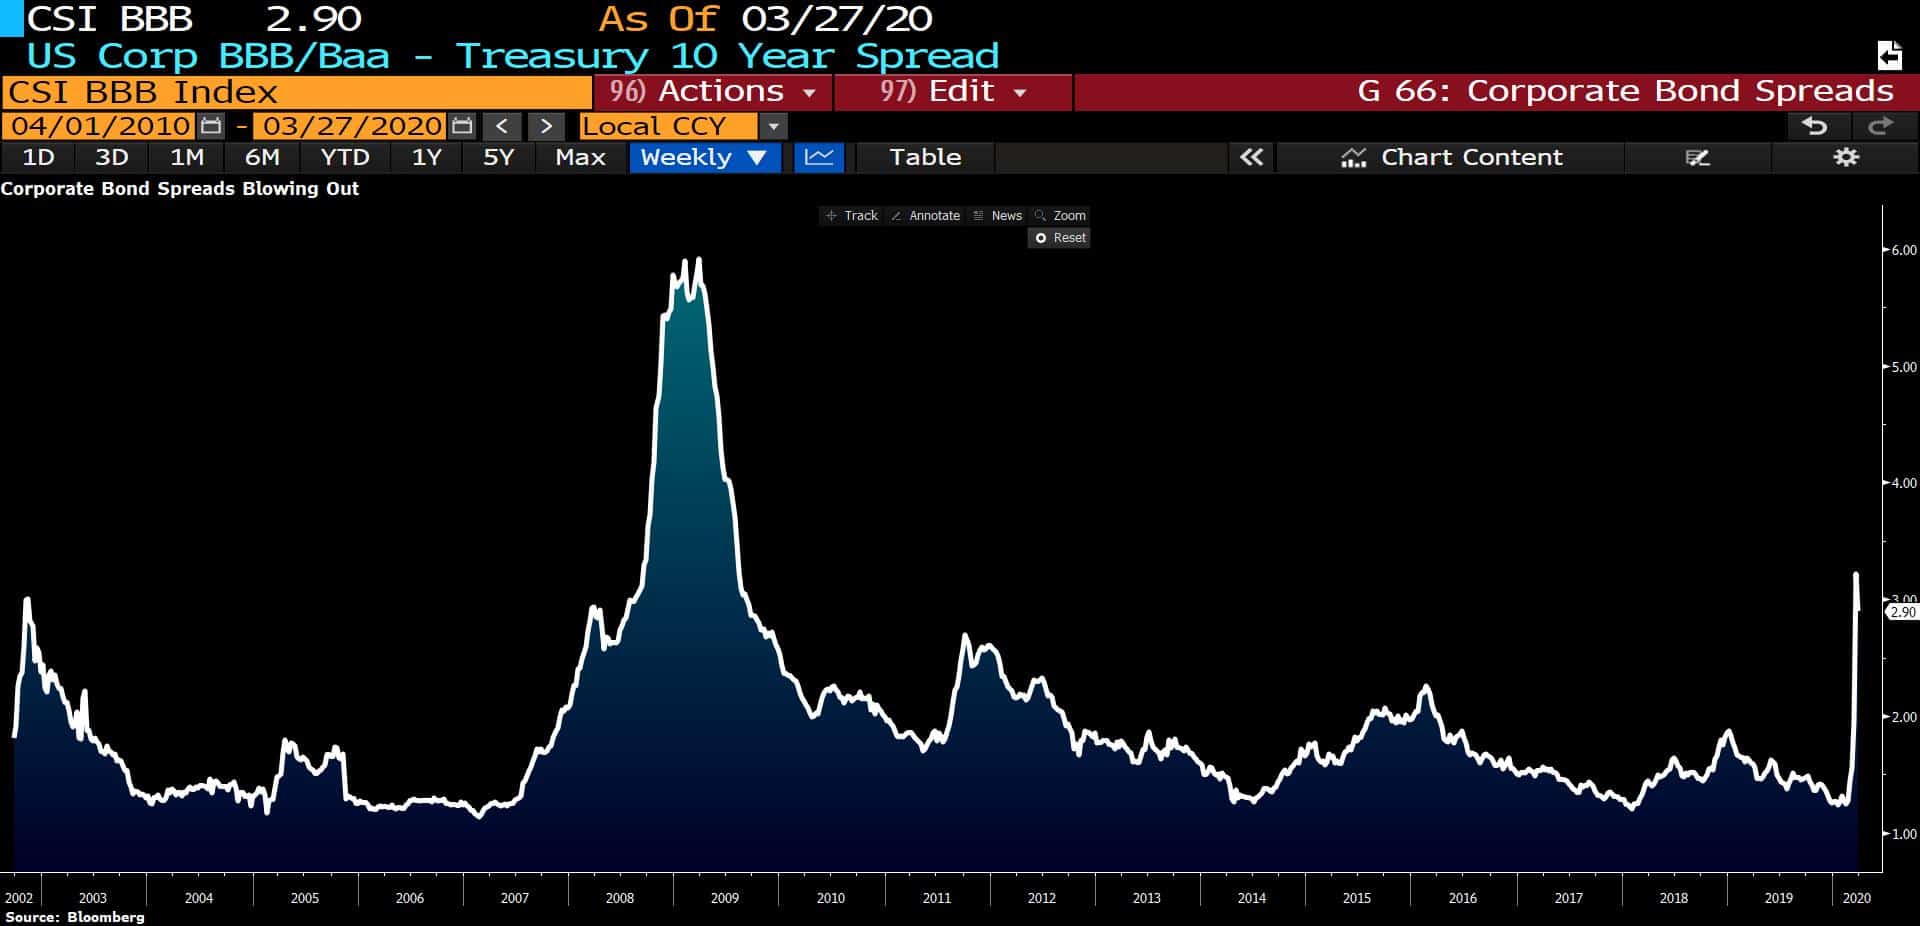
- Since the amount of BBB rated corporate debt is at all-time record levels here in the US. I think it wise to keep a close eye on BBB spreads as not just a gauge of sentiment but also a measure of where we are in the risk cycle. If I am right and we are indeed in the early innings of a bear market then we should see spreads continue to widen, even if equities go on extended rallies.
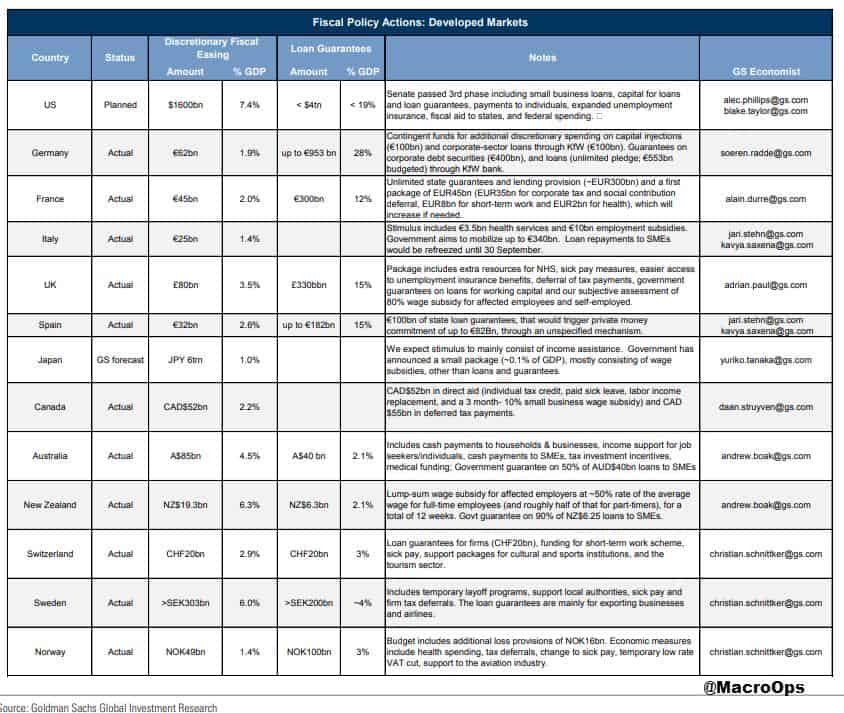
- The fiscal and monetary responses to the virus have so far been impressive. I suppose that’s the benefit of policymakers still living in the event echo of the GFC and so are quick on the trigger. These are certainly bullish developments and why those of us who are of a more bearish bent at the moment, must hold our opinions weakly and update our views often. The chart and graph below from GS show the fiscal responses so far.

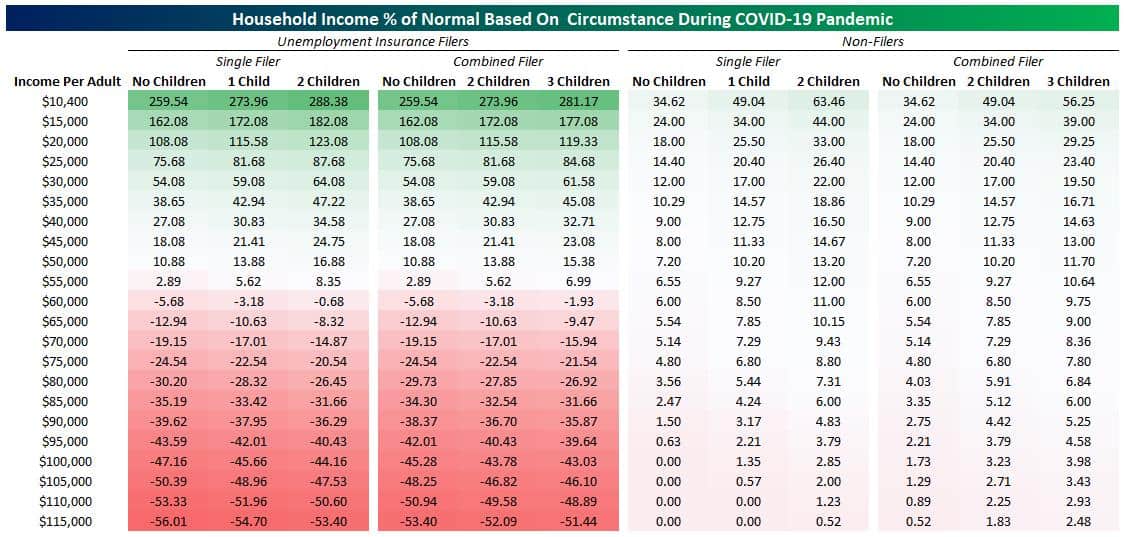
- Bespoke Research published a great piece breaking down the actual dollar amounts that each income bracket will be getting from the announced US fiscal measures (link here). The short and sweet of it is, if you’re making below $50k then this is a great deal for you. If you were making above that, it’s less so. The expanded UI will make a huge difference to those at the lower ends of the income bracket.
- I’ve been getting a lot of questions about the US dollar and gold lately. The US dollar had caught a short-bid for a while as markets panicked and we saw a dash for cash. The reason for this dynamic is that the world is essentially very short US dollars. The reason why is because most debt is USD denominated and so when there’s a risk-off environment that could threaten the cash flows needed to pay that debt we see the dollar get bid up.
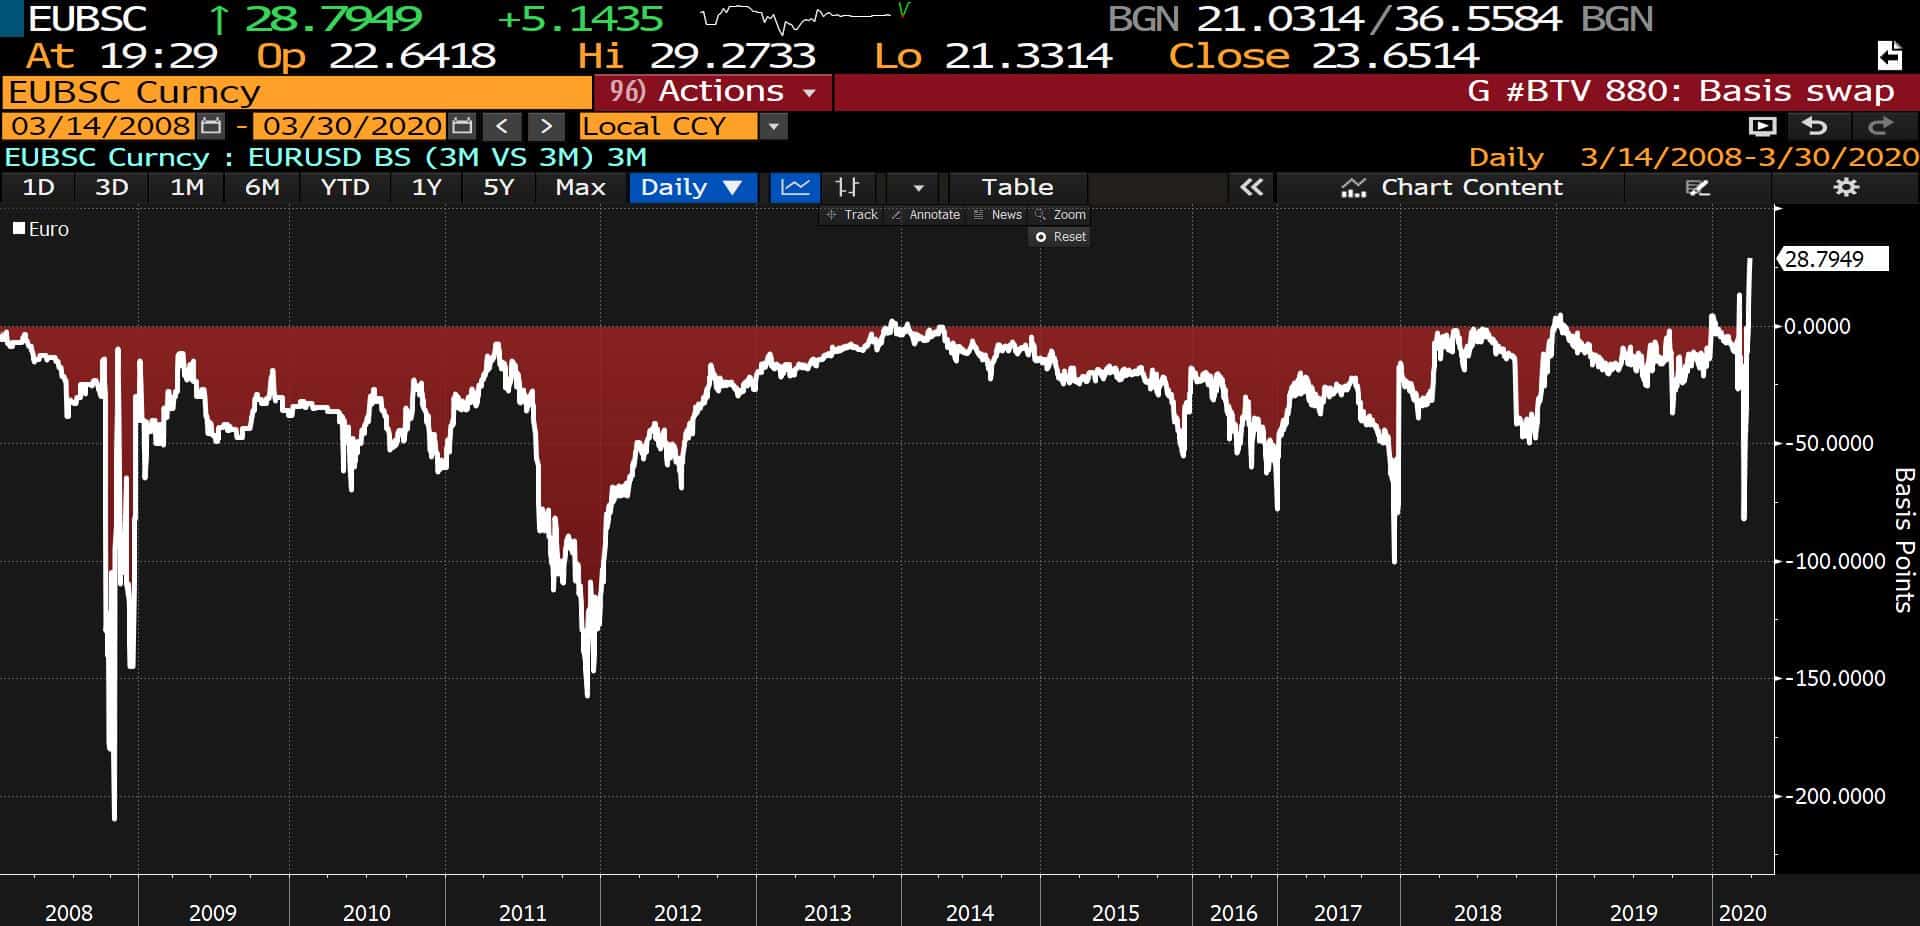
Well, the Fed has done a tremendous job in recent weeks being quick to respond and opening up swap lines and supplying the market with much needed USDs. The chart below shows that the widening in EURUSD basis swaps has been reversed and bullish pressure on USD has been relieved. At least for a while.
Click here to get the Dirty Dozen straight to your inbox every Monday morning
Stay safe out there and keep your head on a swivel!