You cannot trade the market. Instead, you can only trade your beliefs about the market. However, you can only do that successfully if you understand the fundamental concepts behind low-risk ideas, expectancy, and position sizing. ~ Van Tharp
In this week’s Dirty Dozen [CHART PACK] we look at a record high in the DIX index, giving a very bullish signal. We then cover the troubling change in COVID trend growth in some US states and what they could mean for markets. And finally, we end with some charts showing the historical value opportunity on offer in select European markets, plus more.
Let’s dive in.
***click charts to enlarge***
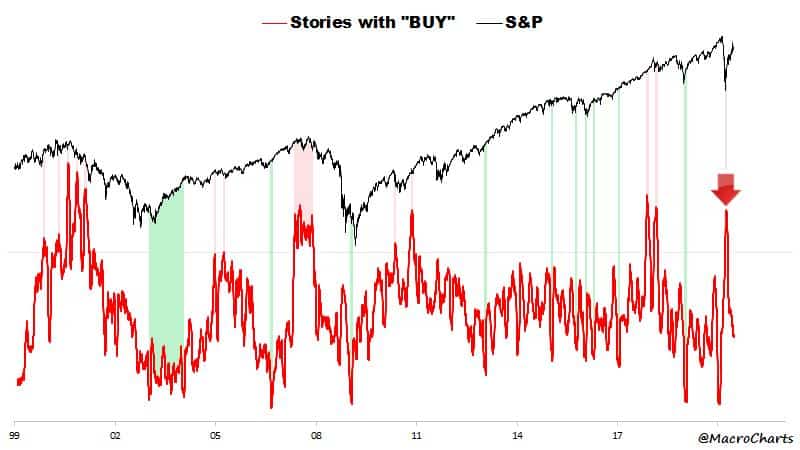
- This is an interesting chart from @MacroCharts. He tweeted “When the history books are written about 2020… Save a page for how Stocks plunged at the fastest pace ever – and nearly all News Stories contained the word “BUY” at the *exact* bottom.
“It may have been the ONLY time in history this ever happened. Time will tell… Yolo!”
- Three weeks ago I shared this DIX chart from @SqueezeMetrics pointing out that the index had hit an all-time high. Well, last week it once again broke that record. This is incredibly bullish as it shows large players are purchasing big blocks of stocks in off-exchange transactions. You can find more info on the DIX here.

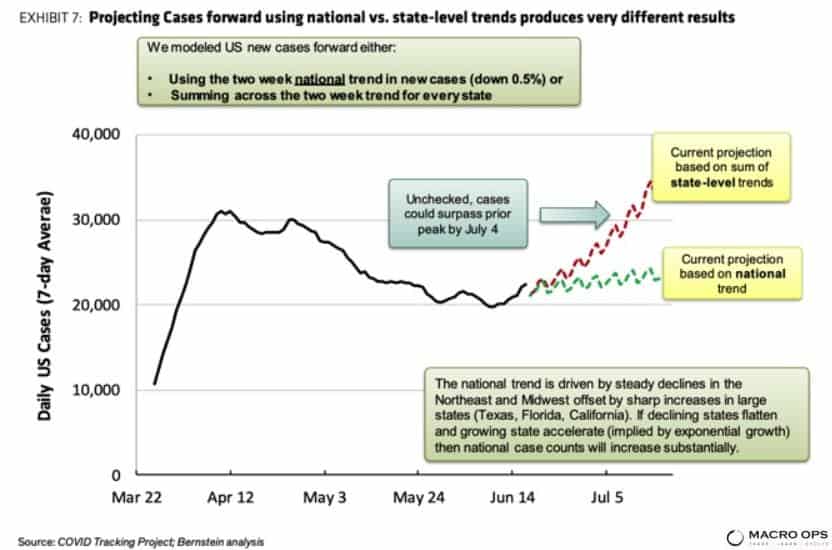
- Bernstein published a report on US COVID trends recently where they point out the troubling trend in case growth amongst many US states. In the chart below, they show their projections for where daily new cases could be headed should this rise go left unchecked.
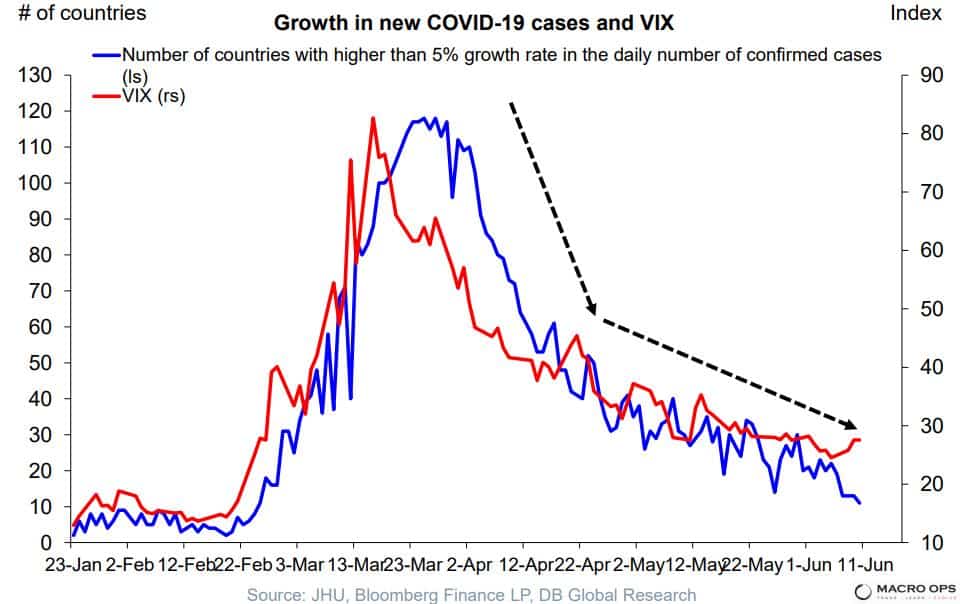
- This matters to the markets for a number of obvious reasons. One of them being that a rising case count raises the likelihood of a return to shutdowns. This chart from DB shows the relationship between market volatility and global case growth.
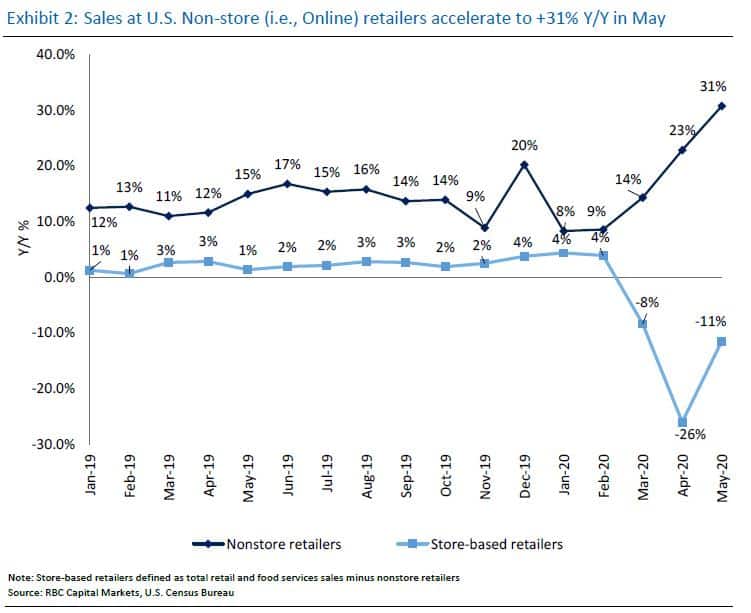
- COVID-19 has acted as an accelerant on many existing trends such as the rise of e-commerce. This chart from RBC Captial shows that despite the rebound in brick and mortar based shopping, the trend growth in online shopping hasn’t slowed.
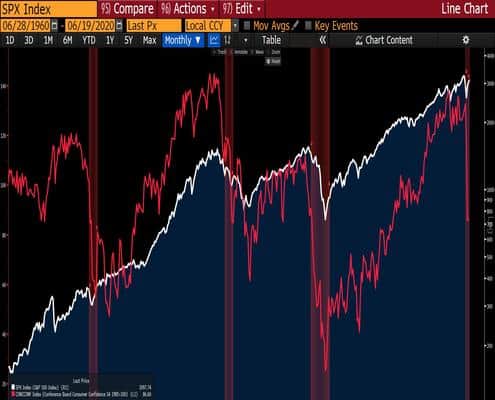
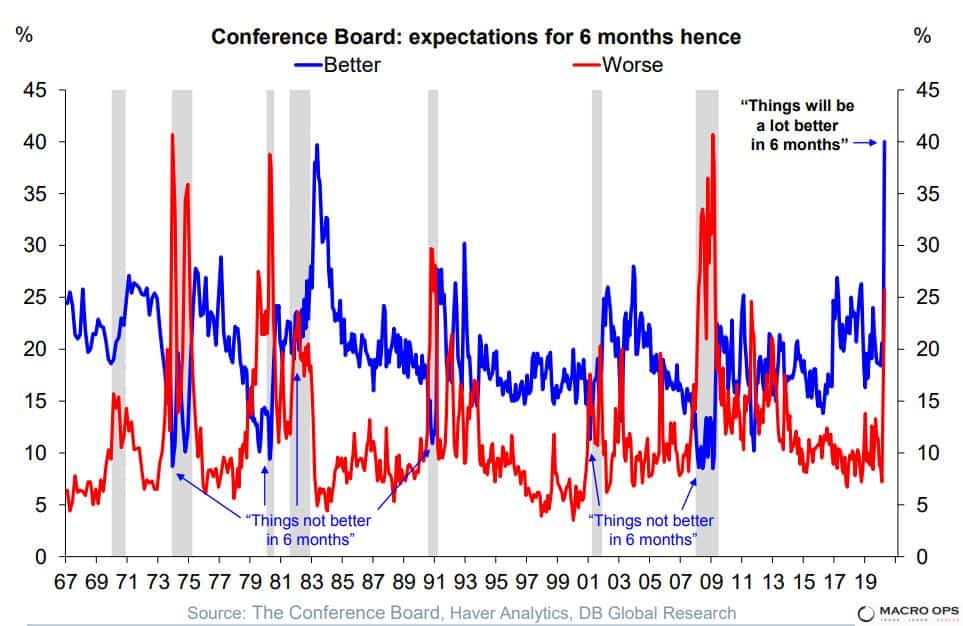
- There’s a lot of funky charts out there that are just complete head-scratchers. Take this one from DB for example, the percentage of US consumers expecting the economy to be worse off in 6-months time is at its highest print in 10-years. At the same time, those expecting things to be better in half a year is at its highest level ever. I’d be interested to see how this splits out according to political leanings.
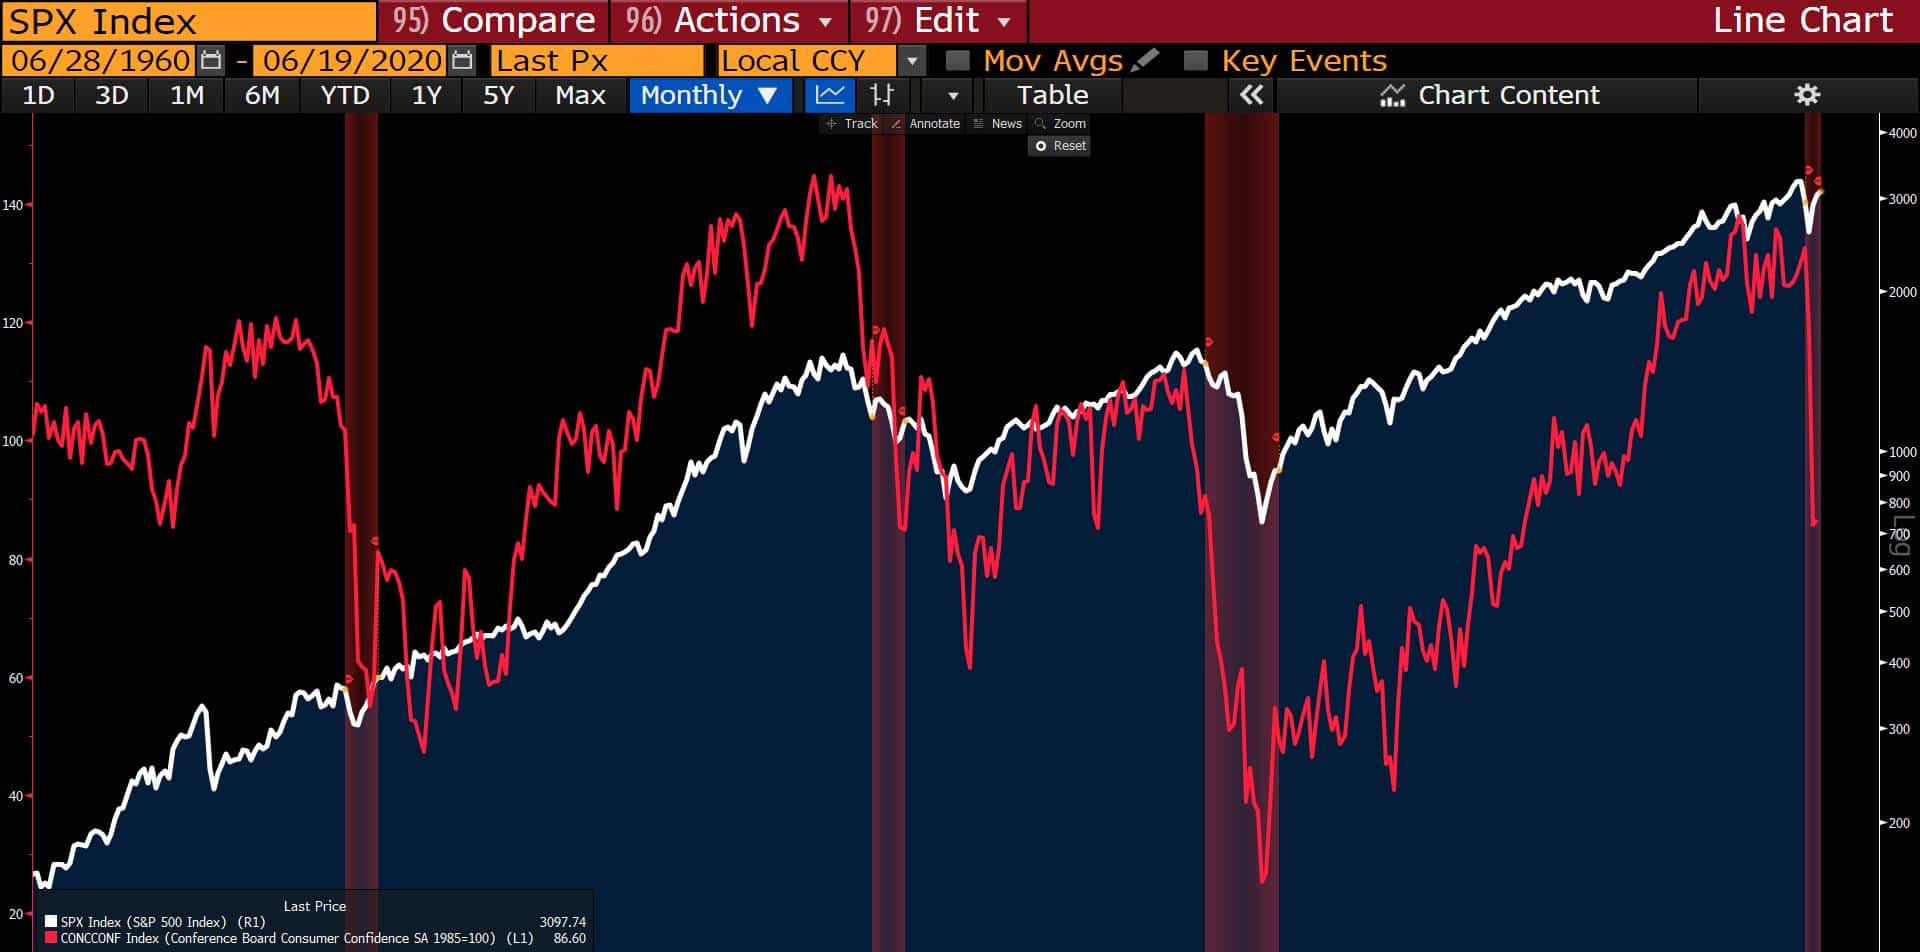
- On a similar note, we haven’t seen too many other times throughout history where consumer confidence (red line) and the market (white line) were this disconnected.
- Nearly 20% of US companies now classify as “Zombie Firms” according to DB. A business gets classified as a zombie when there debt servicing costs are higher than there profits. This is not good for a capitalistic system. We are seeing our markets disintegrate in real-time and it doesn’t seem like we have any reasonable people driving the bus, who could possibly redirect course from here.

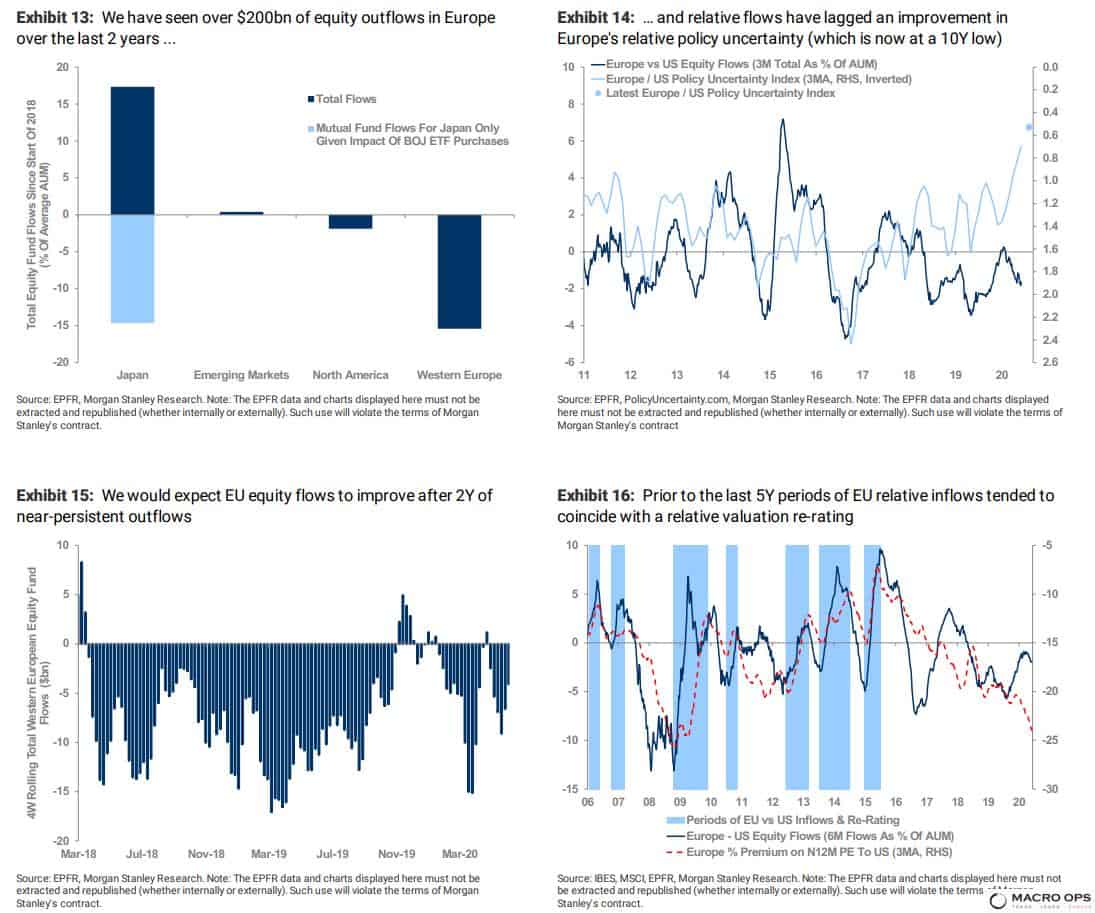
- I’ve been pointing out the attractiveness of some European and EM markets in these pages over the last two months. Here’s a group of charts from MS that help make the bullish case for Europe.
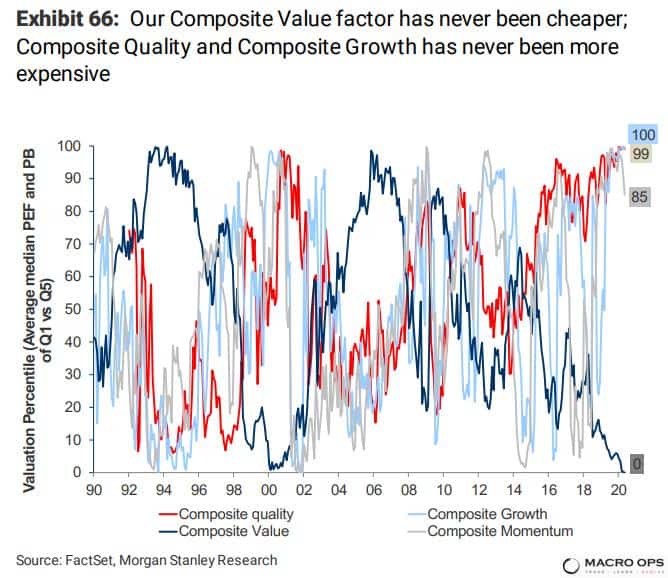
- And within Europe, you might want to look at value stocks from the periphery seeing as how both groups are at or near historical record low valuations (chart via MS).
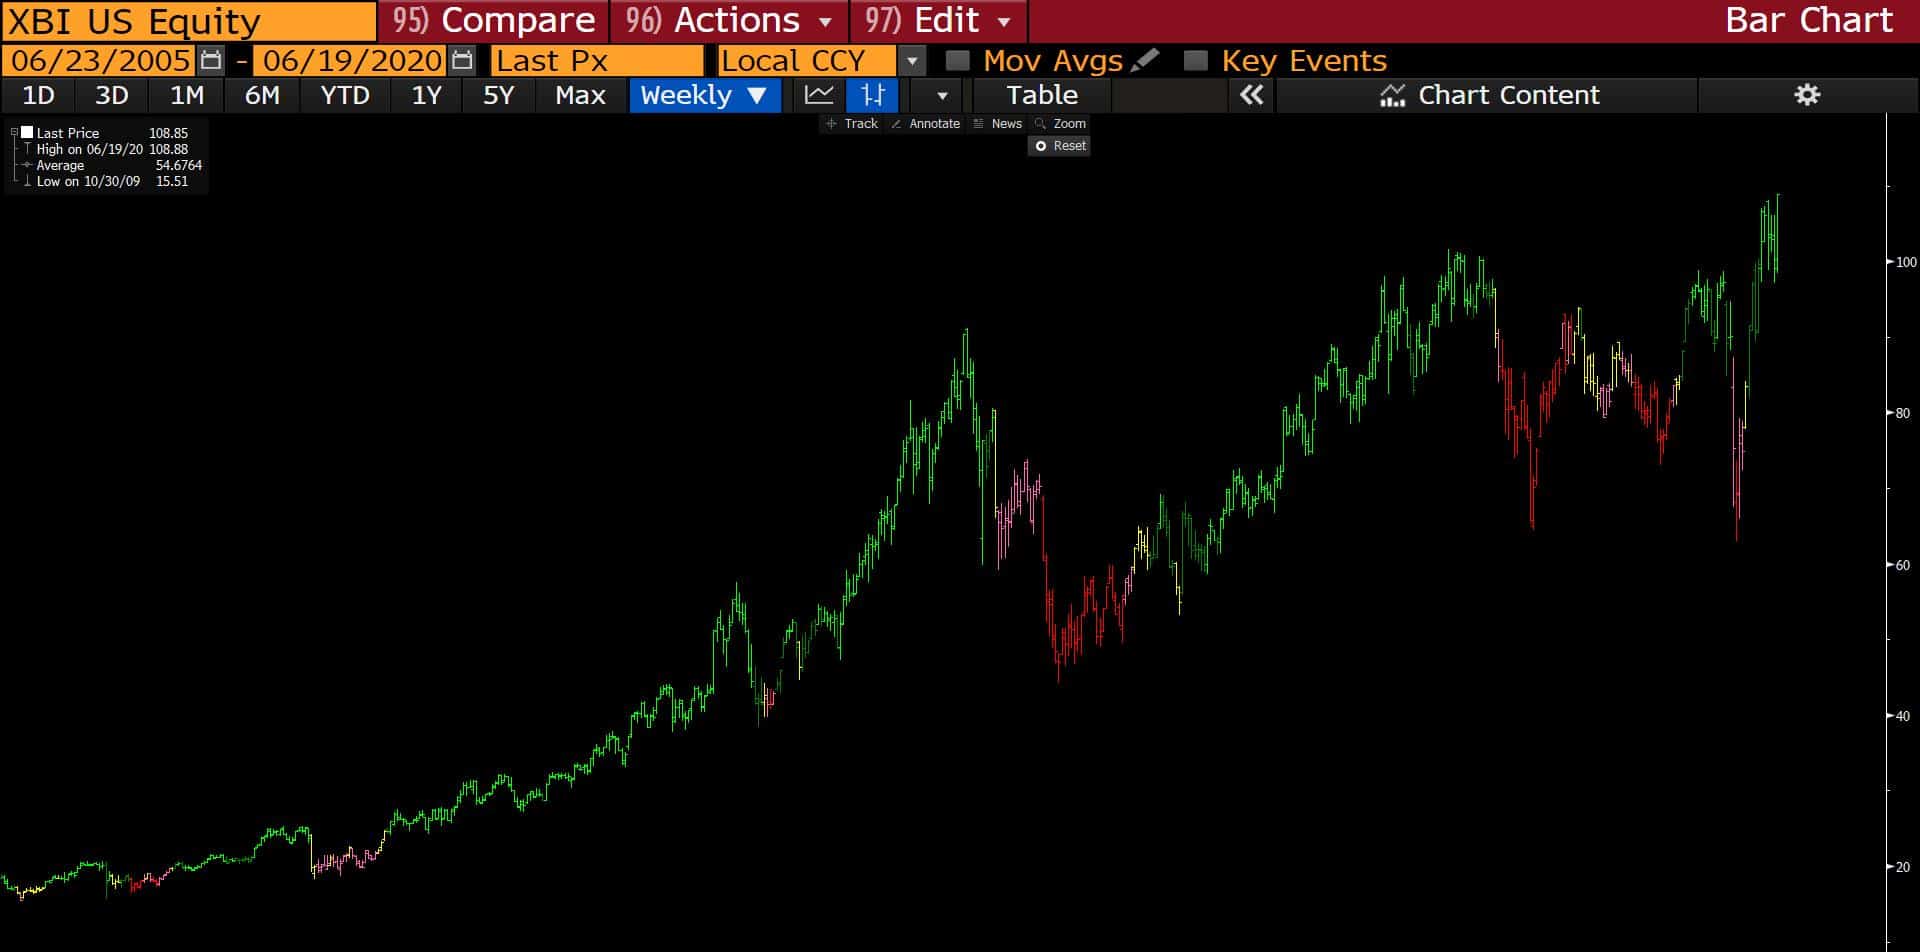
- One of the strongest looking sectors from a technical standpoint right now is Biotech. The biotech index went out last week on its highs and at all-time highs at that. The space has also large outflows recently which is generally a bullish sign when combined with contrasting price action.
Stay safe out there and keep your head on a swivel.