The beginner plunges ahead on a favorite that loses, then bets lightly on a fair-priced horse that wins. He keeps switching amounts and positions, so that he never has a worthwhile bet on a winner at a worthwhile price. He is always one race behind the form of a horse and several races behind the rhythm of the results sequences. ~ Robert L. Bacon
In this week’s Dirty Dozen [CHART PACK] we look at the STRONG BREADTH we’re seeing in markets around the world, then dive into the potential source of that breadth, before covering some dirt-cheap international markets with exceptional long-term chart setups, and finally end with some precious metals, demographics, and short-term signs of complacency…
Let’s dive in.
***click charts to enlarge***
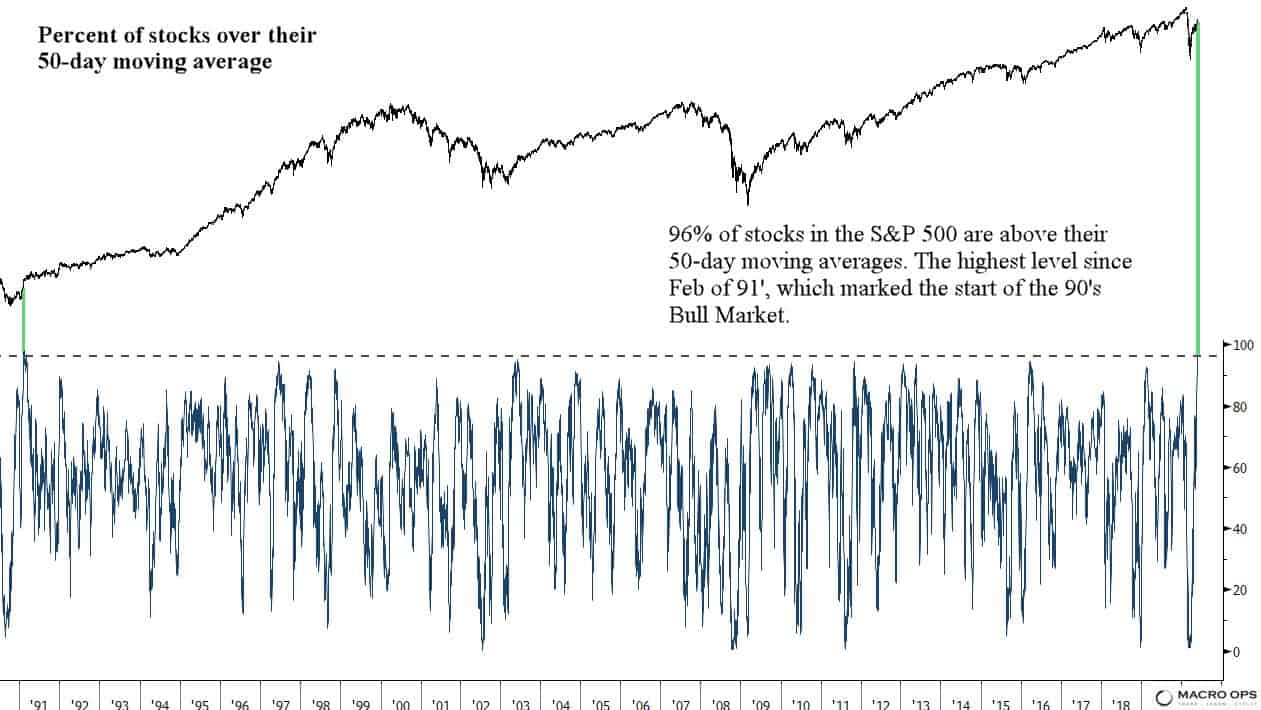
- Something happened last week that hasn’t happened in 29 years. 96 percent of S&P 500 stocks were above their 50-day moving average… That’s after hitting near-record lows in March. The last time breadth hit similar levels was in early 91’ following the 90’-91’ bear market and recession, which then preceded the great 90s bull market.
- The following chart from NDR shows past instances (marked by arrows) where this short-term breadth indicator crossed above 90 after falling to at least 75% in between. Out of the 19 cases, the market was up a year later each time with a median return of 16.28% (chart via @edclissold).
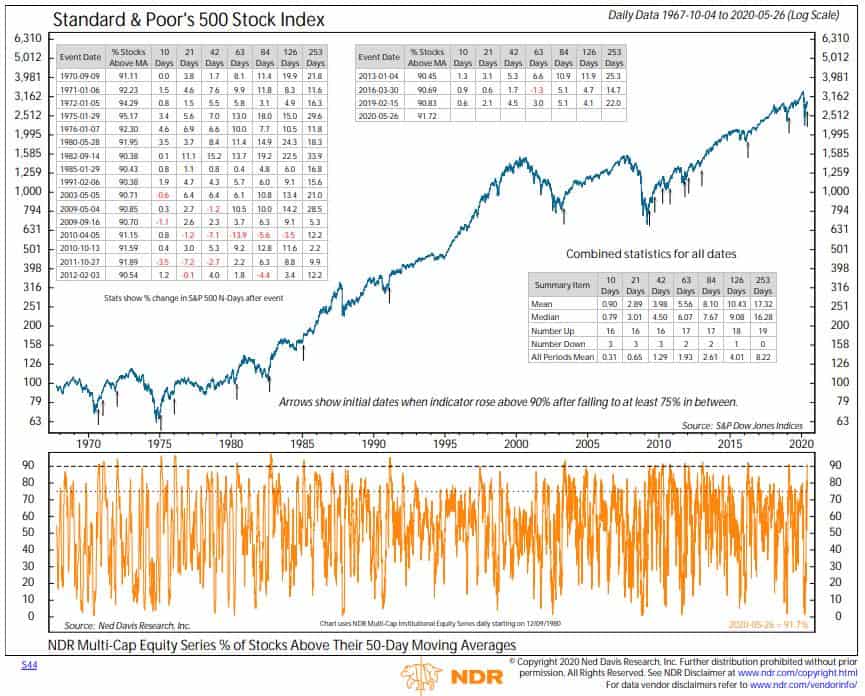
- And here’s the return following each thrust 2-months later (chart via @edclissold).

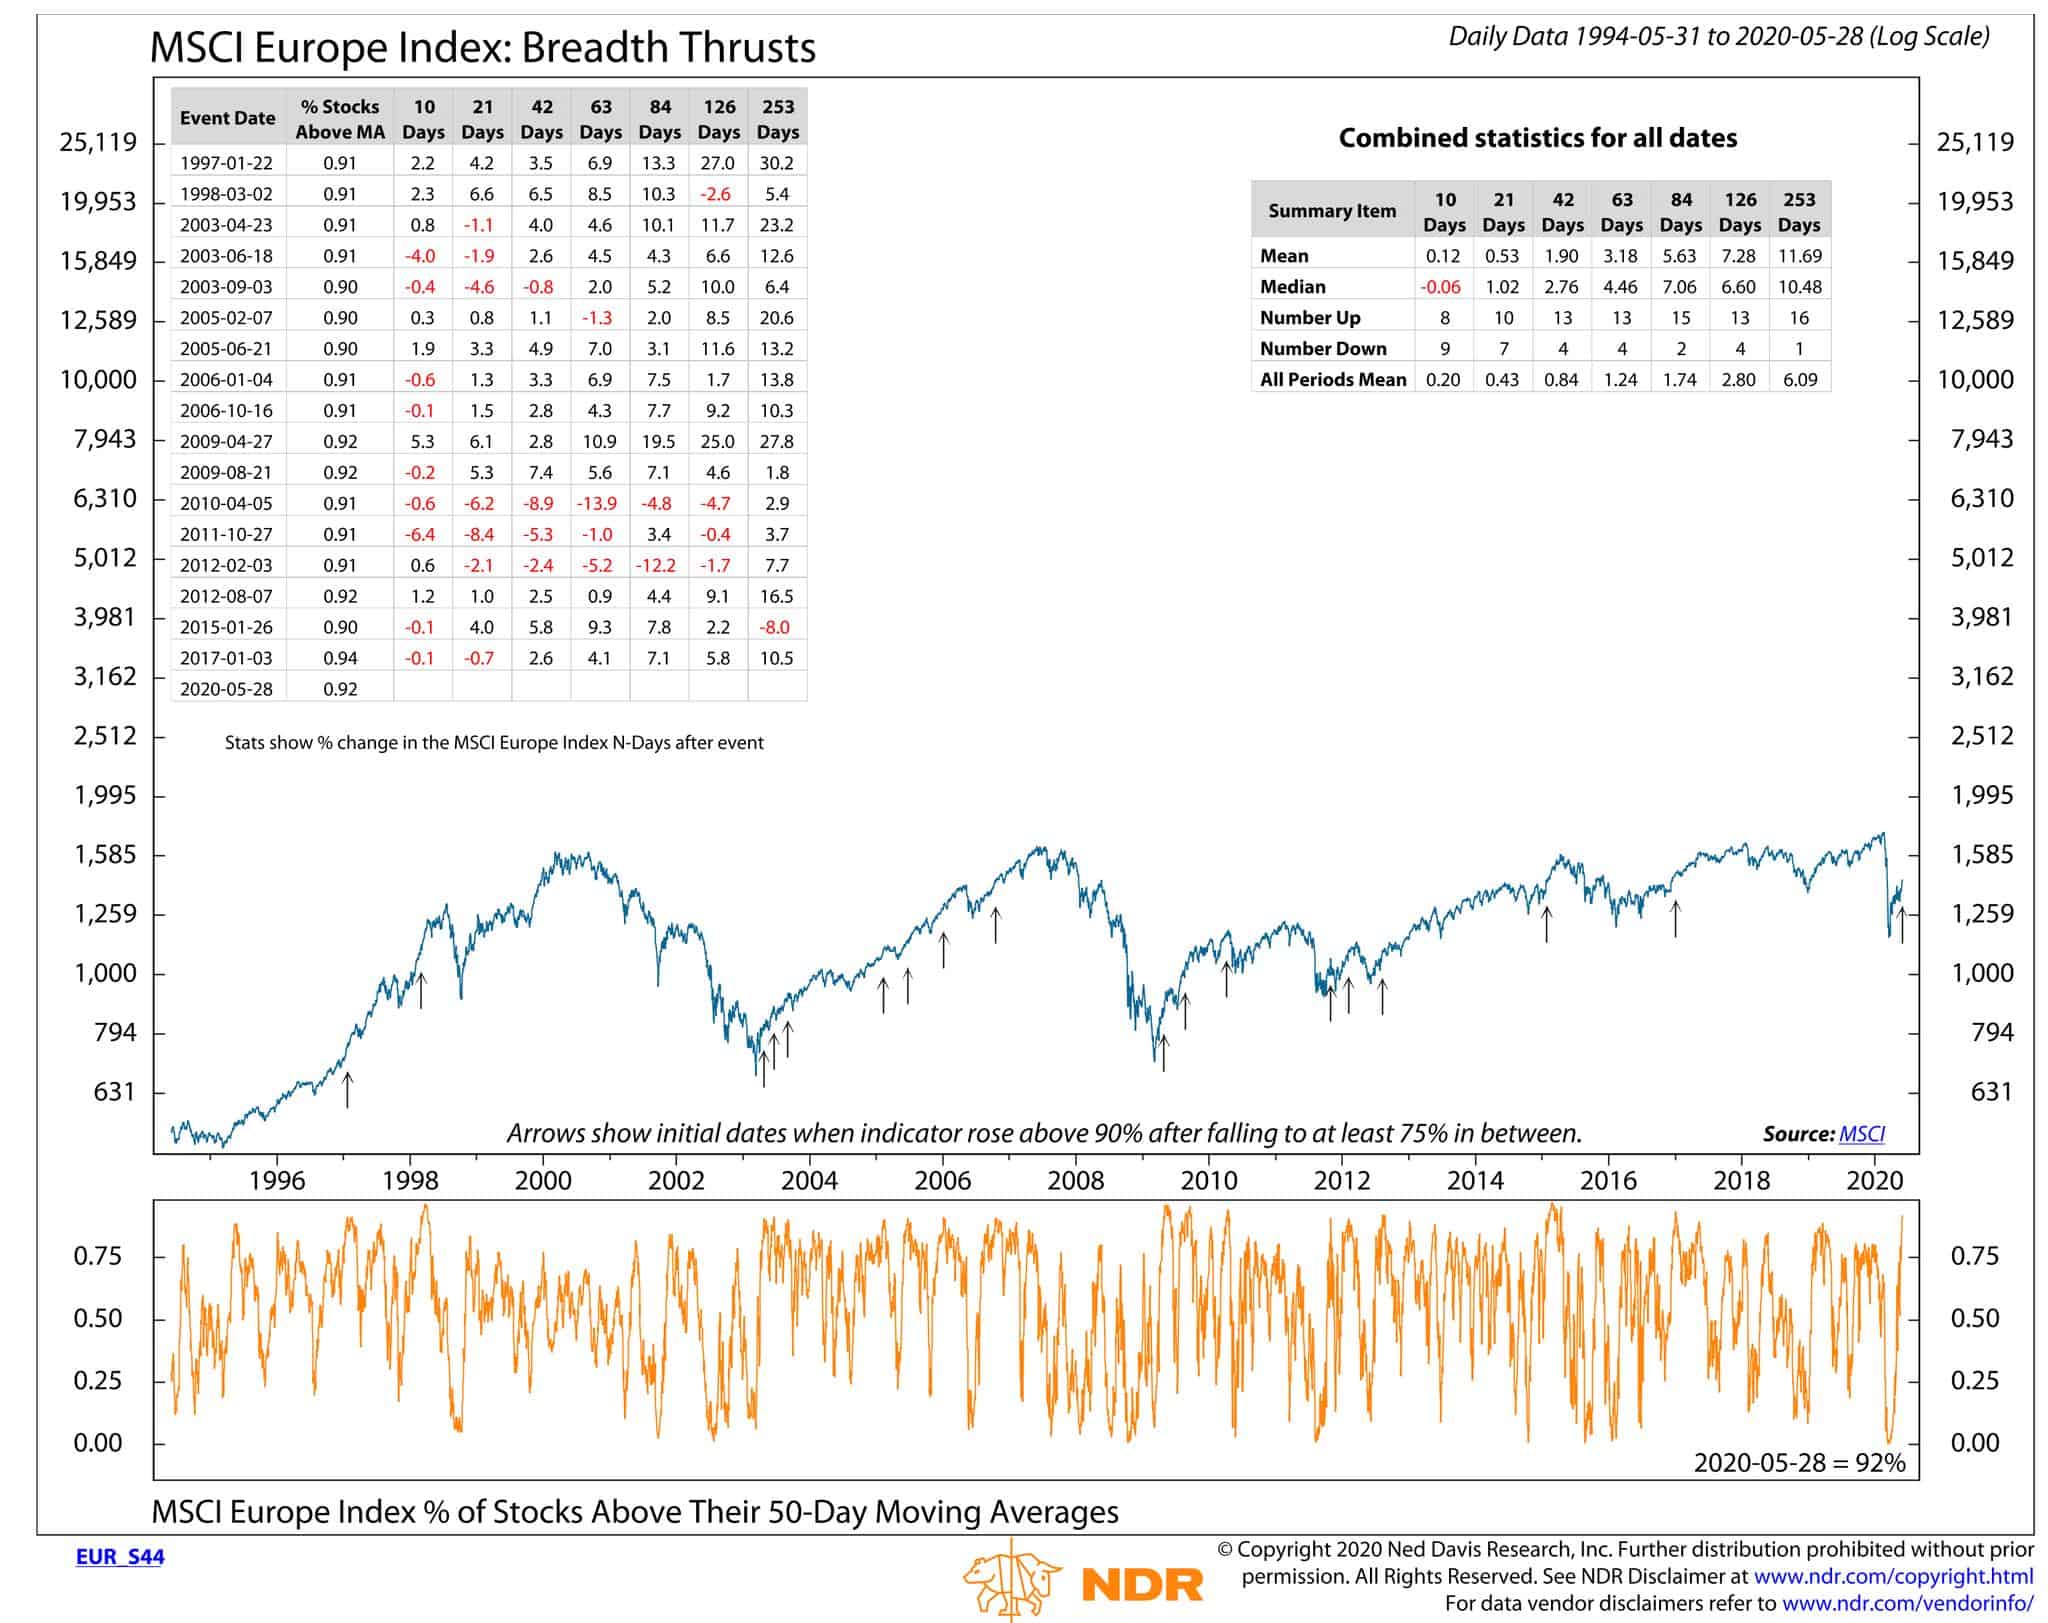
- The strong breadth isn’t unique to just the US either. Here’s the same NDR chart but for the MSCI Europe Index where 92% of stocks crossed above their 50-day moving average last week, for the first time in over three years (chart @WillieDelwiche).
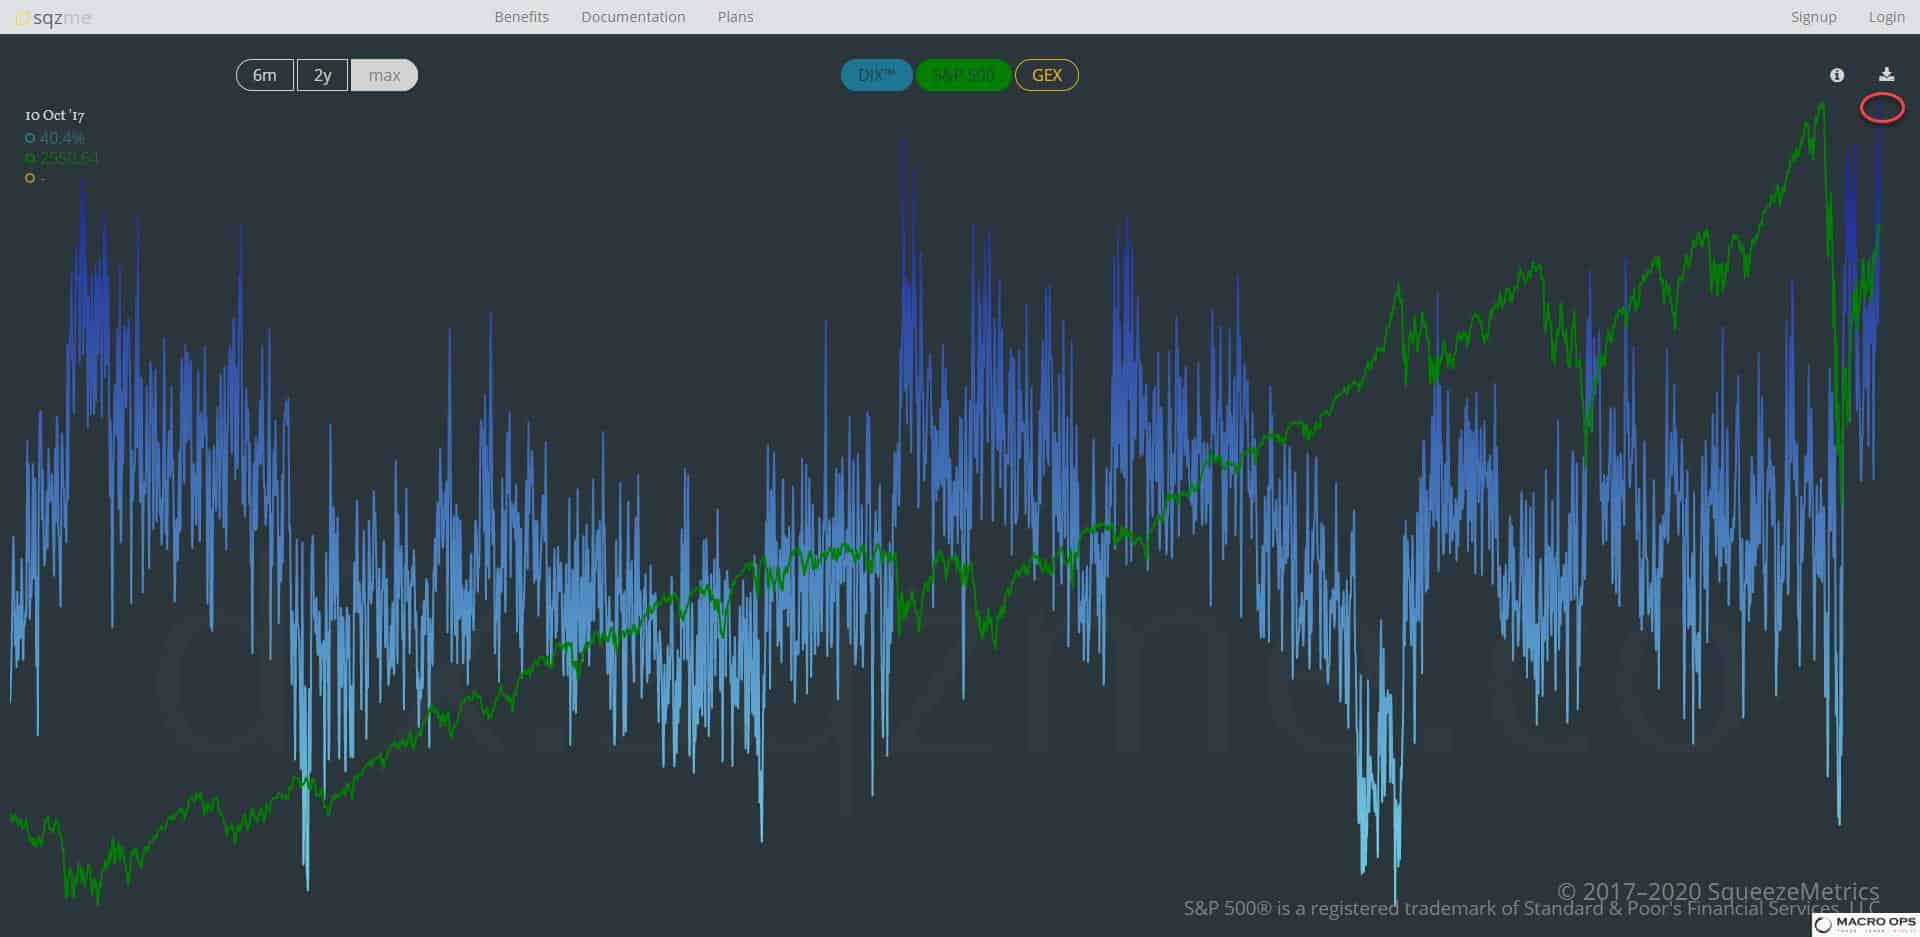
- The Dark Index (DIX), a measure of off-exchange transactions (you can find more information here) hit 52.3% on Friday. That’s the highest number on record. @SqueezeMetrics, the creator of the DIX, points out that “off-exchange transactions have been ‘overwhelmingly’ bullish since late March”.
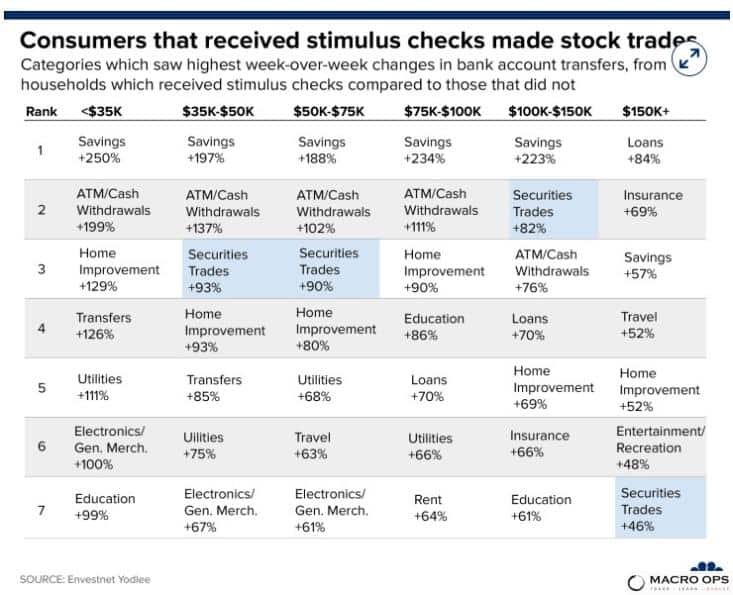
- The strong demand for risk assets that we’re seeing is making many financial twitter warriors and newsletter writers head’s spin, as they see a total disconnect between the market and the economy. What they don’t get is that the market operates off its own fundamentals and it recently saw a huge boost to the demand side of that equation. Ben Carlson shared in a recent blog post (link here) how “the major brokerages — Robinhood, Charles Schwab, TD Ameritrade and Etrade — saw new accounts grow as much as 170% during the first quarter” and that one of the biggest beneficiaries of the stimulus checks was securities trading.
- People email me all the time asking me if I’m bullish or bearish right now. I don’t have a single answer for that question (it depends on the timeframe) and even then, my opinions are very weakly held, especially now. I’m just trying to play the tape in front of me and let the market tell me what’s what.
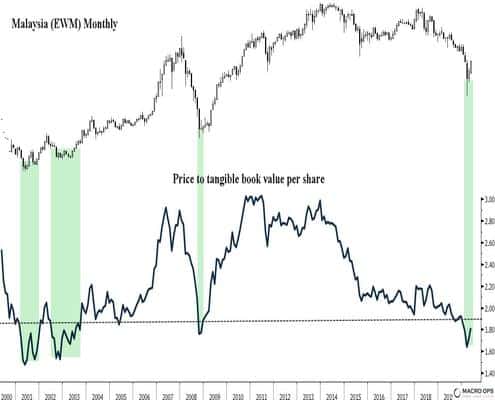
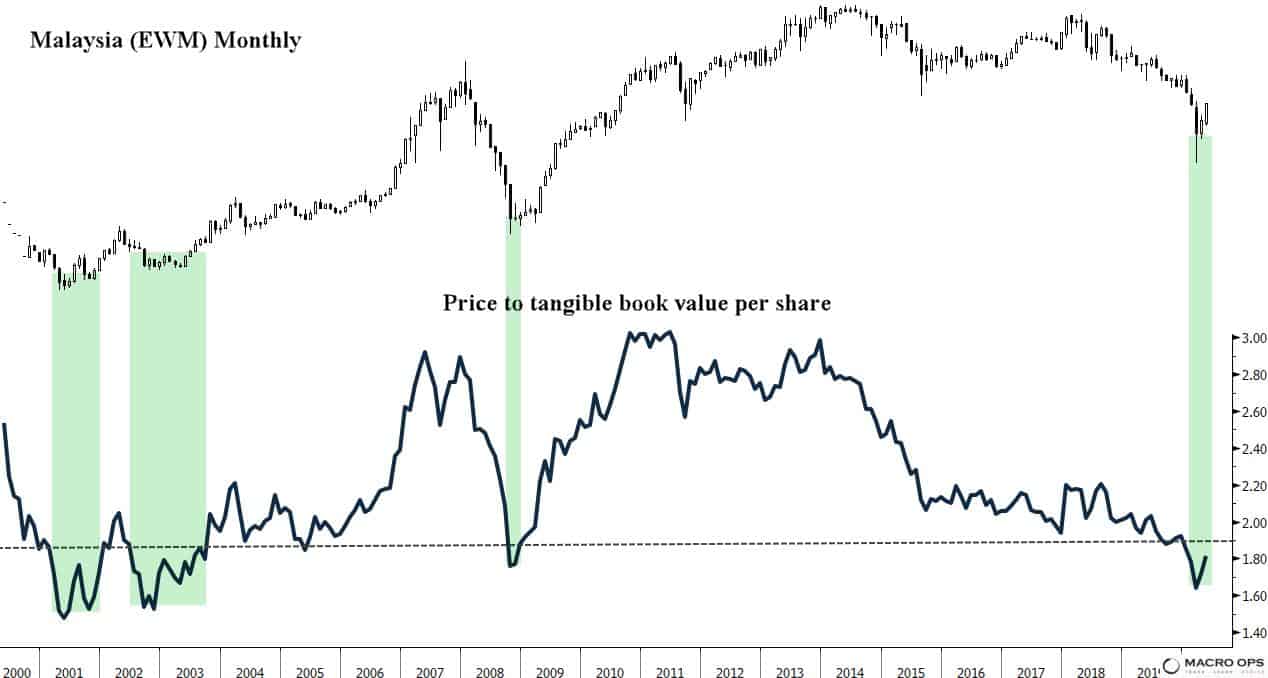
With that said, there’s some great looking charts in emerging markets and Europe that need to be on your radar. Malaysia (EWM) is one of these. It’s selling on the cheap… there are also a number of long-term fundamental reasons to be bullish on the country — not to mention the monthly price action is 👌.
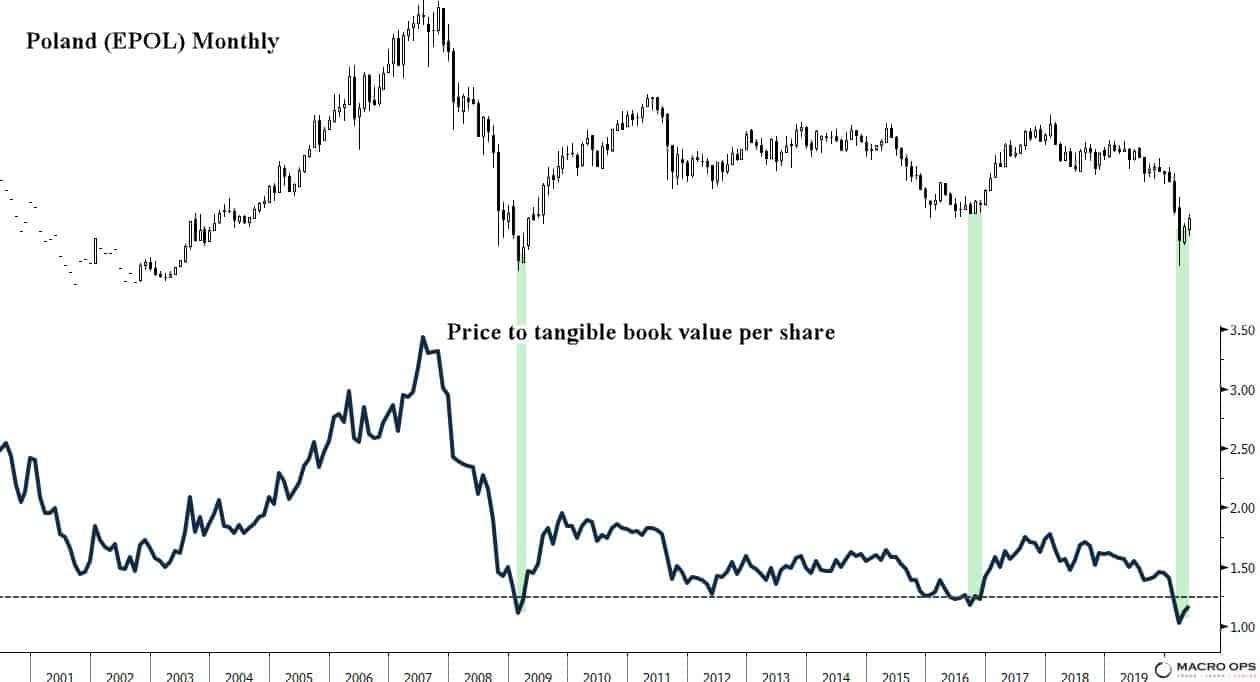
- Poland (EPOL) is another. Na Zdrowie!
- EURUSD has tried to break down only to reverse four months in a row now. This last month saw a strong close. The market is rejecting lower levels which raises the odds of higher ones. It’s still in a sideways regime and we need to wait for a breakout but pay attention. A weaker dollar (stronger euro) would fit with a lot of the other price action I’m seeing across markets right now.

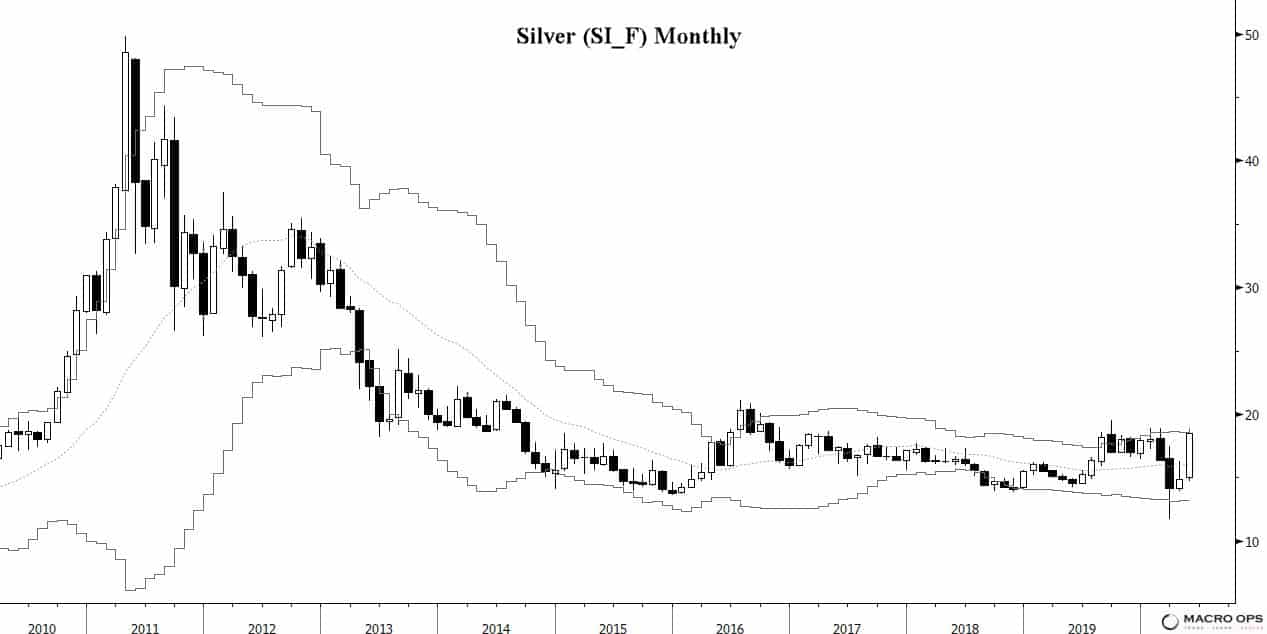
- Precious metals continue to run strong (I last updated the bull case here). Silver especially has been putting in some work on closing the gold/silver performance gap I pointed out a few weeks back. It saw a strong close for the month. Look for higher prices and a break above its long-term base soon.
- Ensemble Captial published a piece recently on where they think the “Next Normal” will be, following the impact of the virus, that’s worth a read (link here).
“Obvious: Coronavirus is going to increase the global death rate.
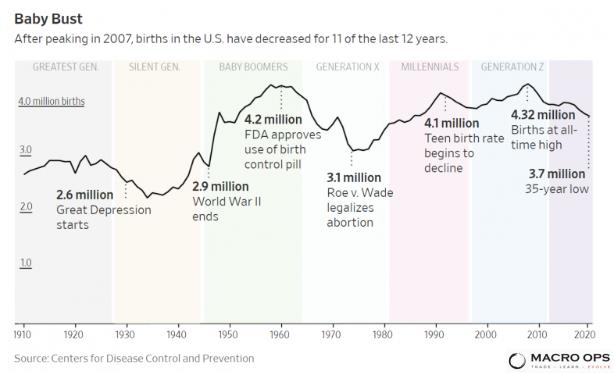
“Less Obvious: Coronavirus is going to increase the global birth rate.
“Historically, baby booms occur for a combination of cultural and biologically programmed reasons. In the aftermath of a tragic experience such as this pandemic, it’s natural for people to reconsider their goals, priorities, and changing circumstances. One of the important things that come out of an event like this, where people are stuck at home or dealing with potentially grave illness, is the realization of the importance of family, companionship, or simply boredom avoidance. Combined with the ability to move further away from urban areas and increasing affordability in the suburbs, it may well be that we see baby booms around the world. In the US, that may stabilize or reverse the trends of lower than replacement procreation (2019 SAW ONLY A 1.7 FERTILITY RATE, below the 2.1 needed to sustain a population ex immigration).”
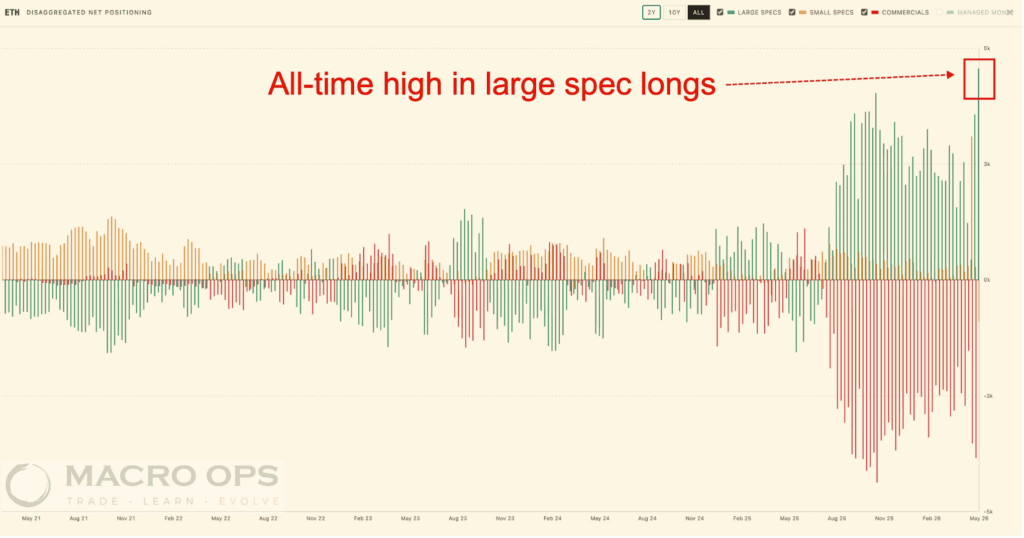
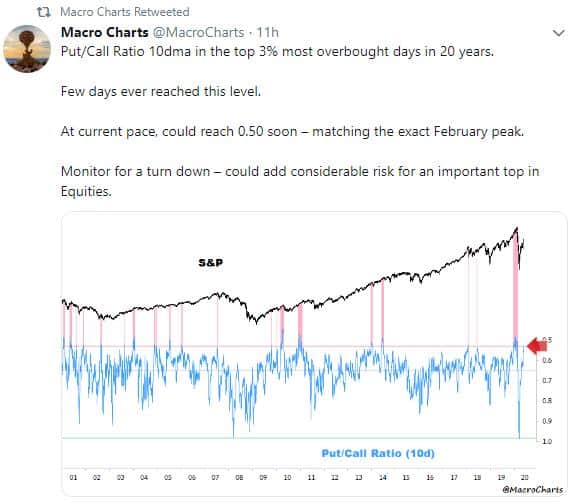
- While the strong breadth is certainly a bullish development the stretched put/call ratios are an indication of complacency and a source of short-term fragility as @MacroCharts pointed out last week.
Stay safe out there and keep your head on a swivel.