(You can read Part 1 of our performance review here.)
 Return Metrics *Through last full trading week of July
YTD: 23.41%
12-Month Return: 35.58%
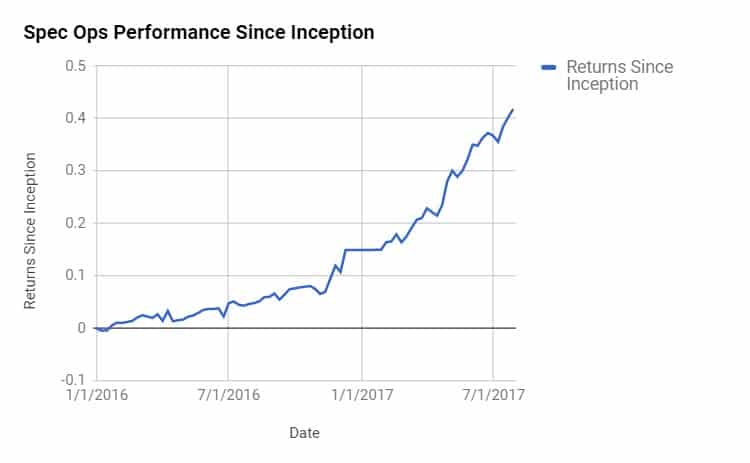
Inception: 41.84%
Annual Vol: 7.50%
Sharpe Ratio: 3.00
Max DD: -1.92%
Tyler from Macro Ops here.
Spec Ops has been crushing it since inception. It’s made over 40% with a max drawdown under 2%.
Market conditions have been perfect for this portfolio’s strategy, but we’ve also made some key macro reads that have boosted performance above “baseline”.
We’ve hit a Sharpe ratio of 3, which is about as good as you can get, unless you’re a HFT shop trading millions of times a year.
Spec Ops’ goal was always to take a collection of statistically sound strategies and enhance them through our macro viewpoint. Injecting macro allows us to tweak these strategies to get better returns than something that’s just 100% systematic.
This process is similar to how top poker players approach their game. Each of their actions is primarily based on math, but they mix in their discretionary “reads” as well.
For example, Pocket Aces have a high probability of being the best holding by the end of each hand. But does that mean these poker players shove all their chips in every time they get dealt Aces?
Nope.
They combine the standard math with discretionary “reads” based on opponent tendency, board texture, and other variables. These “reads” tweak the baseline math strategy to maximize their edge.
The same thing applies to Spec Ops. We take data-backed strategies and tweak them to fit the macro environment with maximum efficacy.
Now just because we’re running well doesn’t mean we can kick back and get lazy… complacency is the devil in this business. As the old saying goes: “You’re only as good as your last trade.”
Markets are tough. To stay ahead of the pack, you need to constantly reevaluate your trading REGARDLESS of your latest results.
All traders try to improve things when they’re losing. But the best traders do this even when they’re winning.
So instead of rambling about how well the portfolio is doing, I’m going to look back on the year and see where I can improve.
There have been 6 core strategies running in Spec Ops this year.
Like we always say… you can’t be sure where the big gains will come from each year. That’s why we spread out a bit to make sure we’re exposed to the winning theme for the year.
Here are the results of these strategies. The numbers are recorded through the last full trading week of July 2017.

VIX Carry
VIX carry is the bread and butter of Spec Ops. The idea is to harvest the volatility risk premium (VRP) by shorting VIX futures or going long ETNs like SVXY/XIV.
It shouldn’t be surprising that this strategy has printed money… It does well in boring/calm markets.
And so far 2017 has been one of the calmest equity markets on record. The S&P 500 has basically grinded near highs for 6 straight months.
Positive SPX price action put a lid on the VIX and even sent it to a new all-time low.
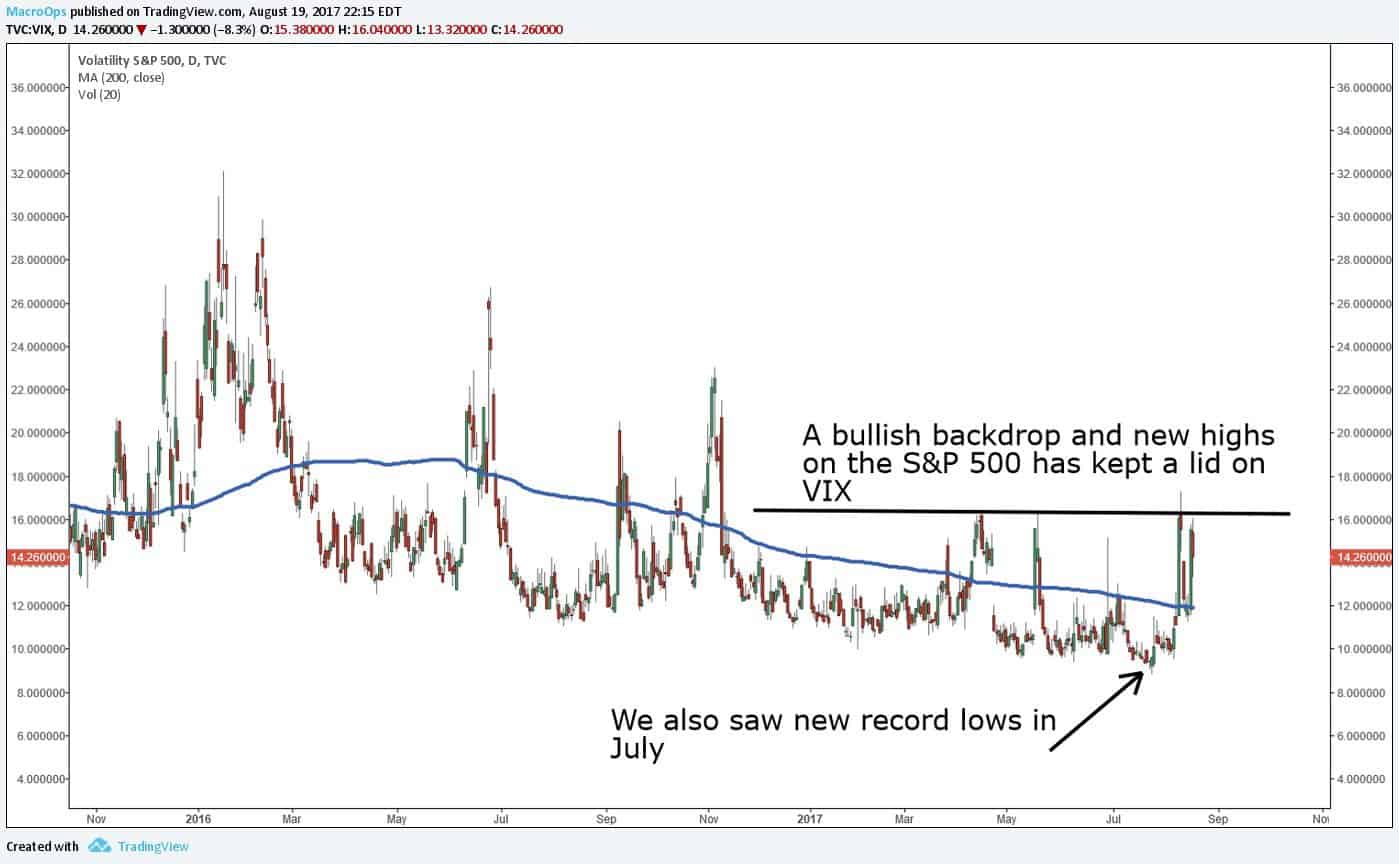
This is why despite the most recent market sell off, SVXY is still up around 45% YTD.
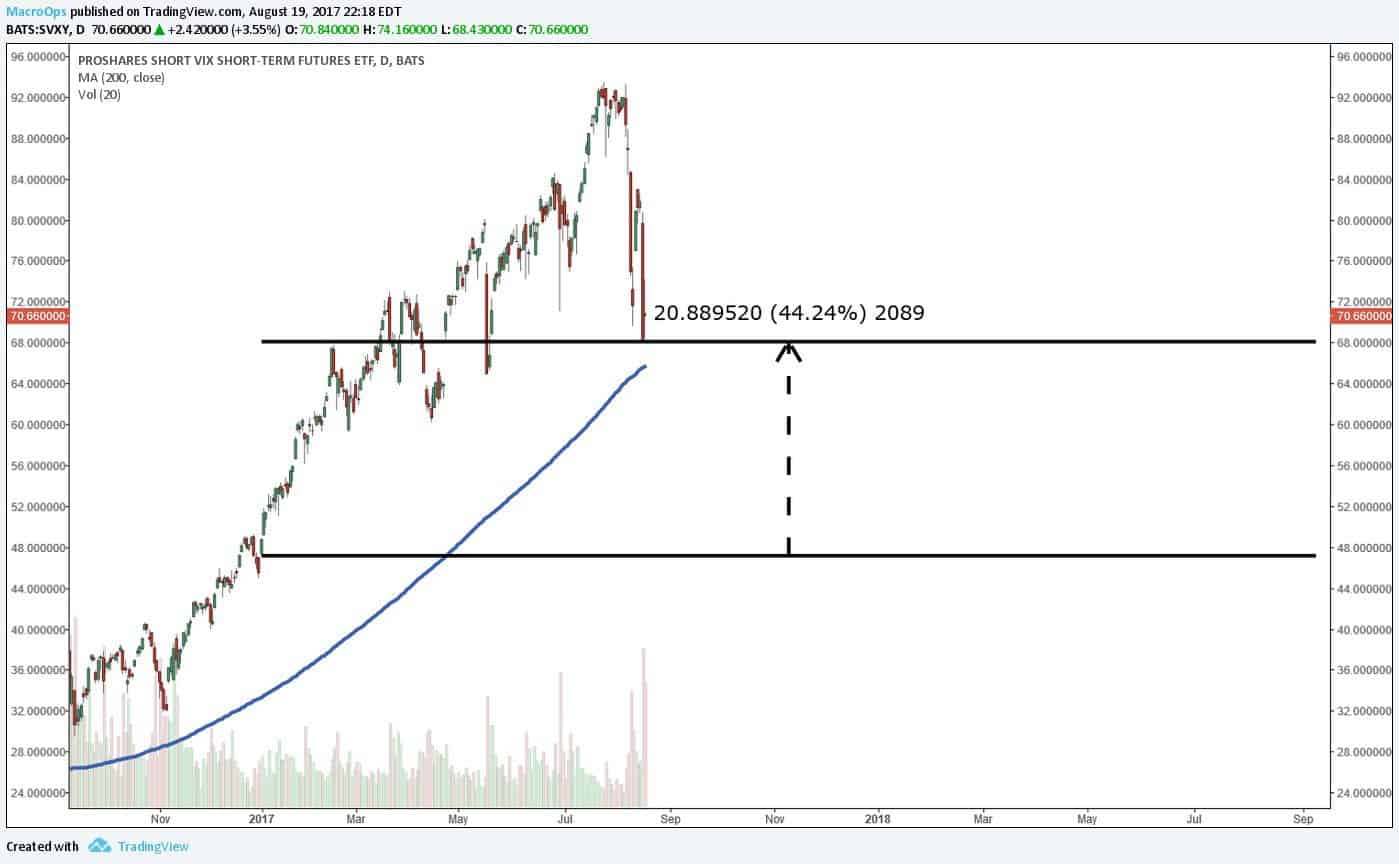
The VIX carry trade in Spec Ops hasn’t made nearly as much as SVXY, but that’s because it uses much less leverage — a must for anyone planning to survive vol selling over the long haul.
Overall I’ve been pleased with how this section of the portfolio has performed since implementation. But due to where we are in the overall market cycle, the plan is to aggressively hedge tail risk in all my future short vol positions.
You can already see the VIX is starting to get more whippy than normal because of low levels and crowdedness. We don’t want to be the guys caught with our pants down the next time ES futures go limit down, causing the VIX to open at 50.
Long Vol
When I tell people we’re also up money on our long volatility trades, they usually think I’m bullshitting them.
But it’s true. Ask any of our Collective Spec Members who received these trades in real time.

The numbers above say there’s about $20k in gains from the long side, but as of today that number is actually around $50k. We just closed a profitable long vol trade in August that wasn’t factored into our mid-year calculations.
The first long vol trade we made was into French elections. It seemed likely traders would buy a lot of volatility to hedge against a potential Le Pen win.
I entered long UVXY a few weeks before the event, and sold out for a nice gain right before results came in.
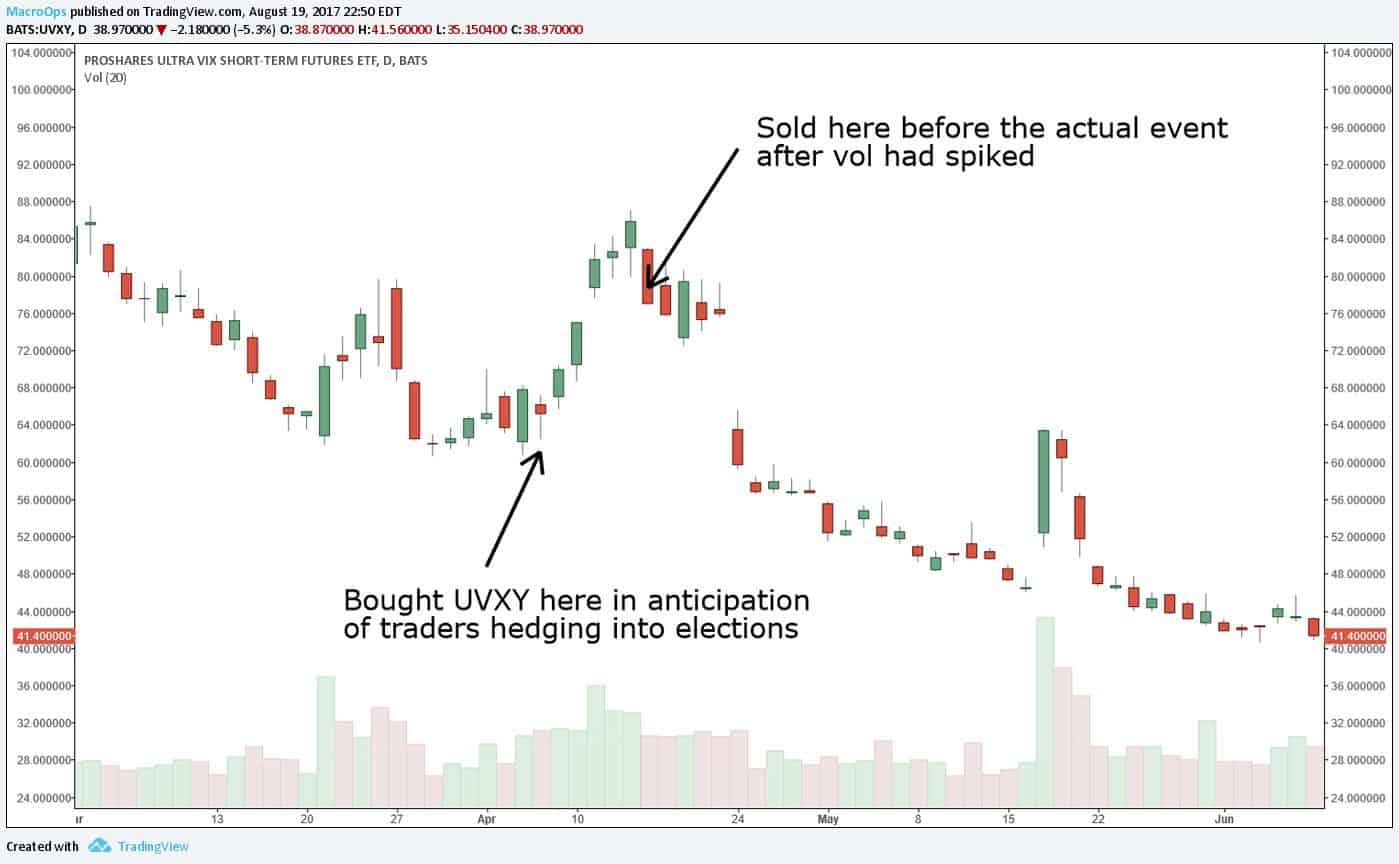
The trade played out exactly how we anticipated it in the quant section of the April MIR.
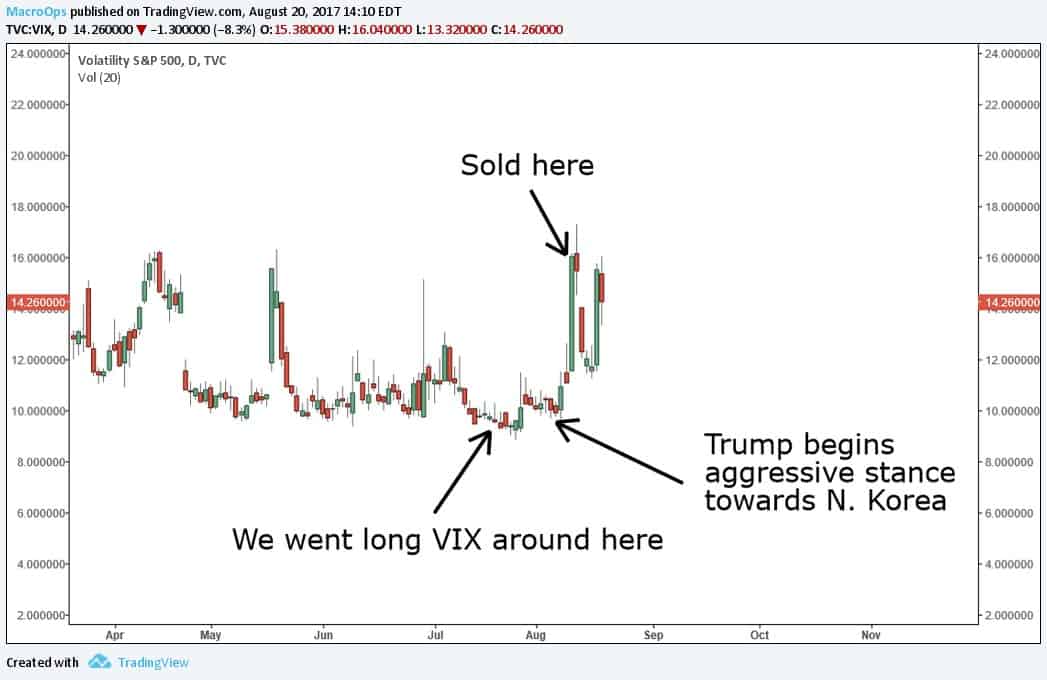
After the benign outcome of the French elections, we didn’t approach the long side again until late July.
VIX was at all time lows going into a seasonally weak period for the S&P. The threat of the debt ceiling was slowly creeping its way into the macro narrative as well. It made sense to suspend the short vol carry trade and instead bet on the long side.
This wasn’t an instant profit maker like the French election trade. We took a little heat holding it over a few weeks, but then caught a break with Trump’s North Korea comments that finally woke the VIX up.
My only regret on this trade was how I expressed it. I used a VIX calendar spread (long the front month futures, short the back month futures) instead of just going long VIX through calls or UVXY.
The spread helps control the slow bleed from a long vol position and also decreases the overall risk. But you can accomplish the same thing by buying defined risk calls or the front month futures on smaller size.
At one point the back month future I was short started to spike much faster than the front month future I was long. This was because N. Korea and debt ceiling risk was getting pushed into September VIX pricing rather than August VIX pricing.
I wasn’t getting paid as much as I should have on the spot VIX spike. I hate that…
If I’m lucky (or good) enough to correctly call a move, I want to get well compensated for it.
Many of our Spec Operators who kept it simple did better than me on this trade. The plain old VIX calls went up 200% by the time I issued an exit alert.
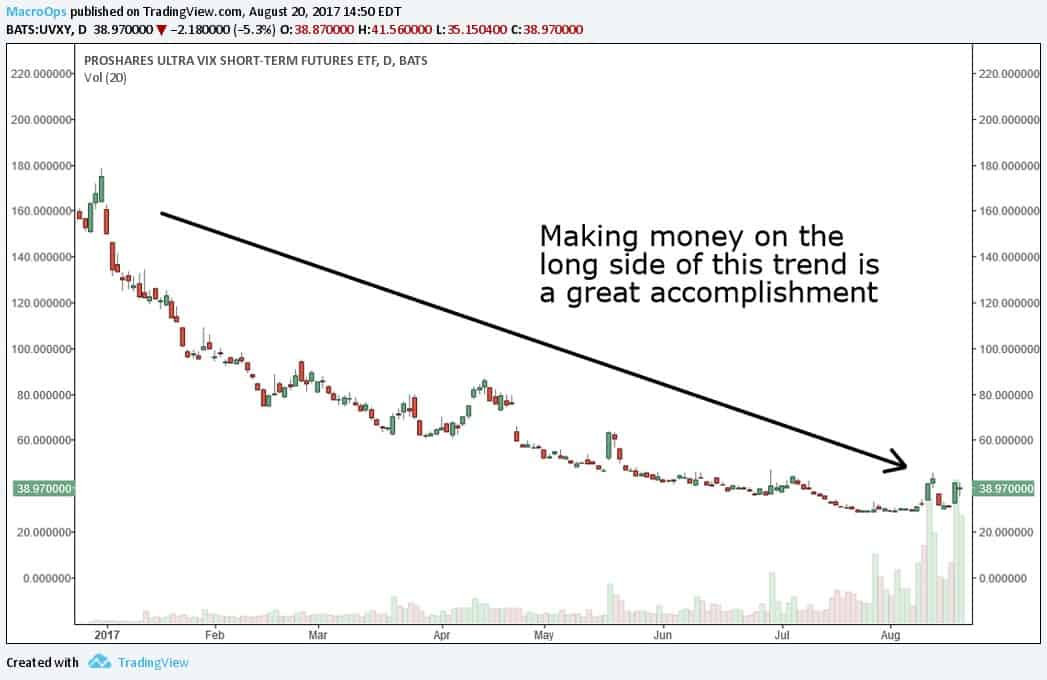
All in all I’m proud of how we traded the long side of vol this year. Fighting the trend is a tough thing to do. You have to have great timing to pull it off…
FOMC

The FOMC trade hasn’t contributed much to the bottom line this year. Low vol has made it tough to hit a nice intraday downtrend.
For those of you unfamiliar with this trade, it involves shorting VIX products into each Fed announcement. Over time it makes money as traders unwind their FOMC hedges post-announcement.
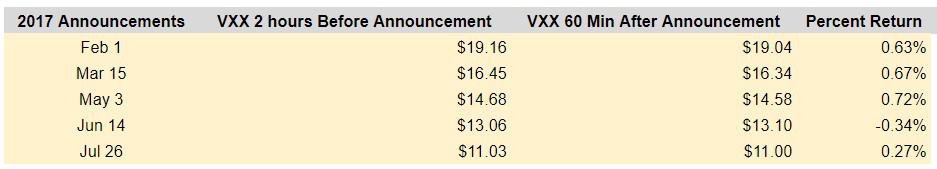
We took the first four trades of the year and had 3 winners and one loser.
We skipped the last trade because VIX was so incredibly low already. There was little money to be made on the short side if right and a lot of money to lose on the long side if wrong.
Full results for the FOMC trade can be seen in the table below:
It looks like we’re going see higher VIX in the second half of the year, so I expect the next few FOMC meetings to be really profitable.
Dip Buy

There ain’t much to be said about the dip buying the spoos this year. There have barely been any buyable dips!
We usually like to buy some SPX calls when the volatility term structure inverts. But that has only happened once this year during the French elections.
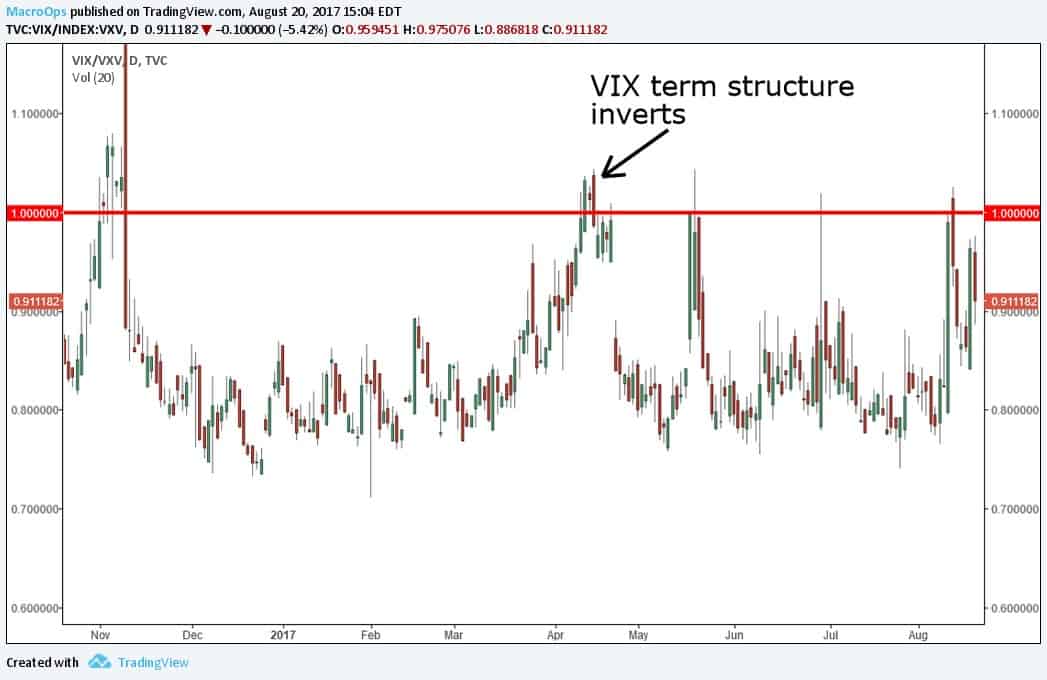
After we bought the calls, SPX grinded slowly higher rather than doing its classic v-bottom. This wasn’t good for the trade so we sold those calls off early for a scratch.
Normally if these dip buy trades don’t show an immediate profit, they’re not going to work out. We’re quick to cut a dip buy if it’s not showing us a nice size gain within a week or so.
Hopefully we get one more sizeable dip into the debt ceiling deadline at the end of September. That would create a perfect setup to get long into the last three months of the year — a seasonally strong period.
Opportunistic

“Opportunistic” trades are basically special situation trades. They don’t come around often and they’re scattered across various markets.
So far there have been 4 categories of opportunistic trades this year. In two of these categories we did very well, and in the other two, not so much. But by keeping losses small on the bad trades, we still managed to squeak out overall gains.
Grain Trades
In May I decided to take the Soy-Corn trade Operator Jose wrote up for the team. We were bearish on the spread. (Original write up here.)
The first trade went exactly as planned. We shorted the retrace of the original breakdown and covered for a nice profit.
But the second trade didn’t work at all. The USDA Acreage report released on June 30th surprised the market. The spread ripped sharply against me, causing a larger than anticipated loss.
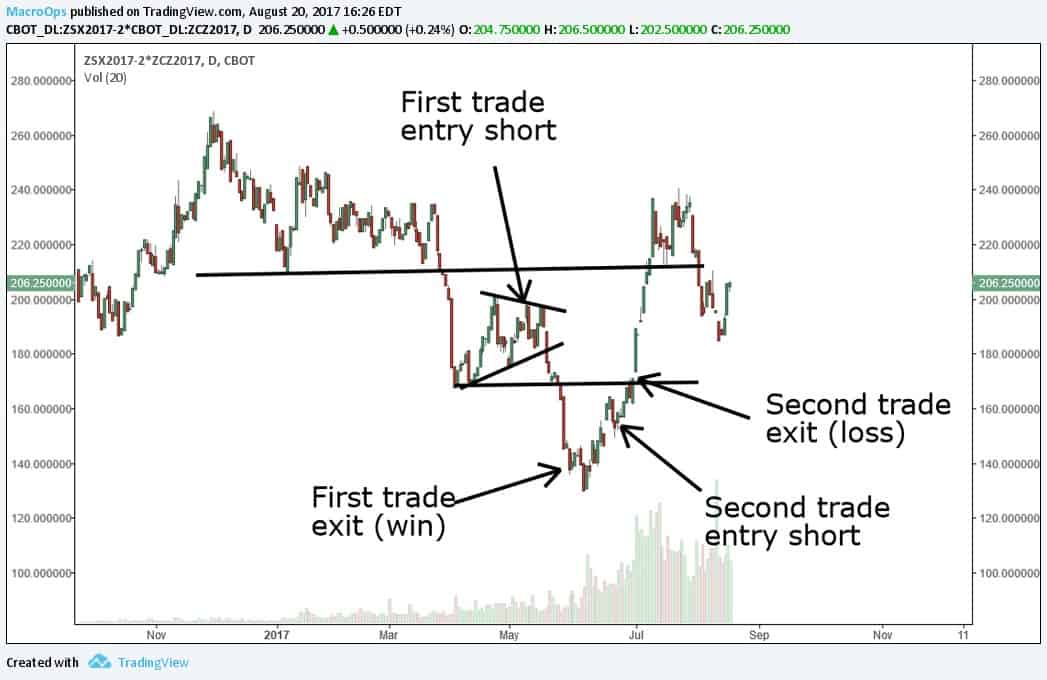
Even with the second one losing, I should have came out with a net gain between the two trades. But instead I booked a loss because of poor position sizing.
We risked 50 bps on the first trade and made 100bps. On the second trade I risked 100 bps and lost 180 bps.
This is the problem with variable position sizing. Bad sizing can completely erode positive expectation if you end up sizing larger on your losers than winners.
It takes an incredible amount of experience to know when to lever up and lever down a position. If you’re dealing with unfamiliar markets, it’s best to stick with static position sizing. You can start playing around with sizing after you’ve developed an advanced feel for that market.
Admittedly, I’m not too familiar with the grains market. I still have a long ways to go there to develop an advanced feel. Knowing this, I should’ve sized both trades the same. That would’ve produced a small win instead of a modest loss.
Brazilian Volatility
We took two trades under this theme and both were winners.
The opportunity arose when news broke that Michel Temer, Brazil’s president, was being investigated for corruption. Brazilian investors dumped both equities and the Real on the news. This caused the Brazilian ETF, EWZ, to have a huge gap down.
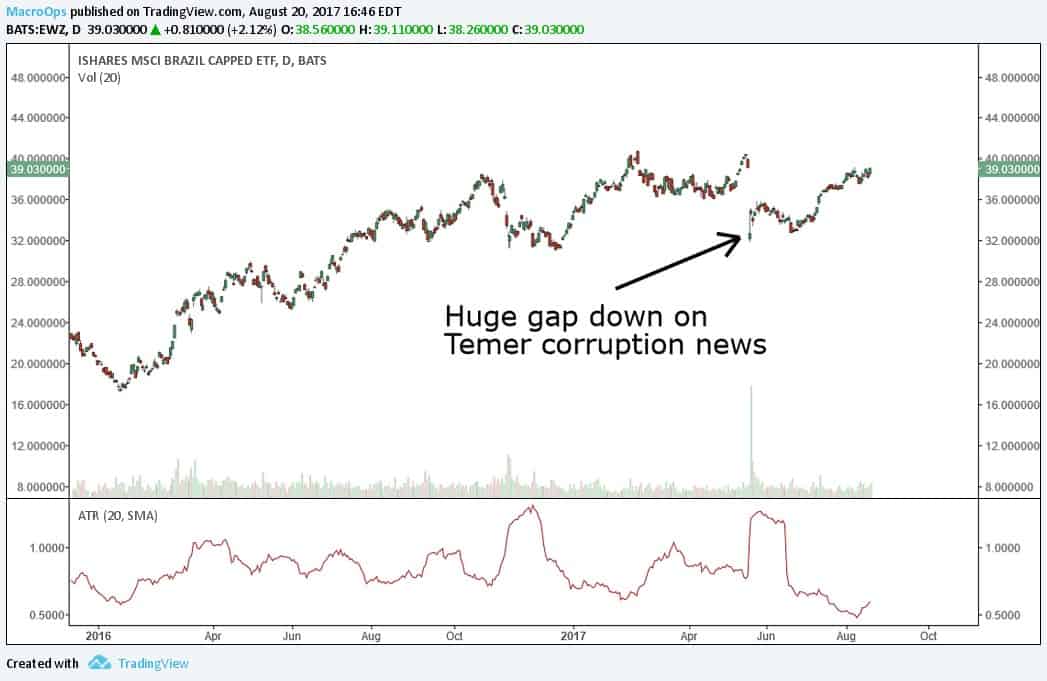
Implied volatility spiked big time, making the options on EWZ an attractive sale.
Our viewpoint was that favorable liquidity conditions over the summer would overpower the negative sentiment surrounding Temer. This dynamic would keep EWZ in its trading range rather than sending it even lower.
Right after the news broke we immediately sold the weekly straddle on EWZ. It ended up being a full winner.
And when the market retested the lows of the breakdown, we sold some puts because volatility was still rich. EWZ rallied and the puts also expired for full profit.
On both trades we stayed on the small side, only selling 100bps worth of premium. We kept it small because these EWZ options were correlated to the other trades in the Spec portfolio at the time.
Going forward I’m thinking about taking more size on trades like these. They don’t come around that often and I need to press the edge when it’s there.
EURUSD Straddle
This was another fantastic winner outlined in our April MIR.
Low volatility combined with a tight range in the EURUSD created the perfect buying opportunity for the ATM straddle in FXE.
An ATM straddle benefits from trends in either direction. This was great for us because I didn’t have confidence in which way the Euro would break, but I had a hunch it would break some way.
The Euro ended up rallying and breaking the top end of the range after Macron won the French election causing everyone to become bullish on Europe.
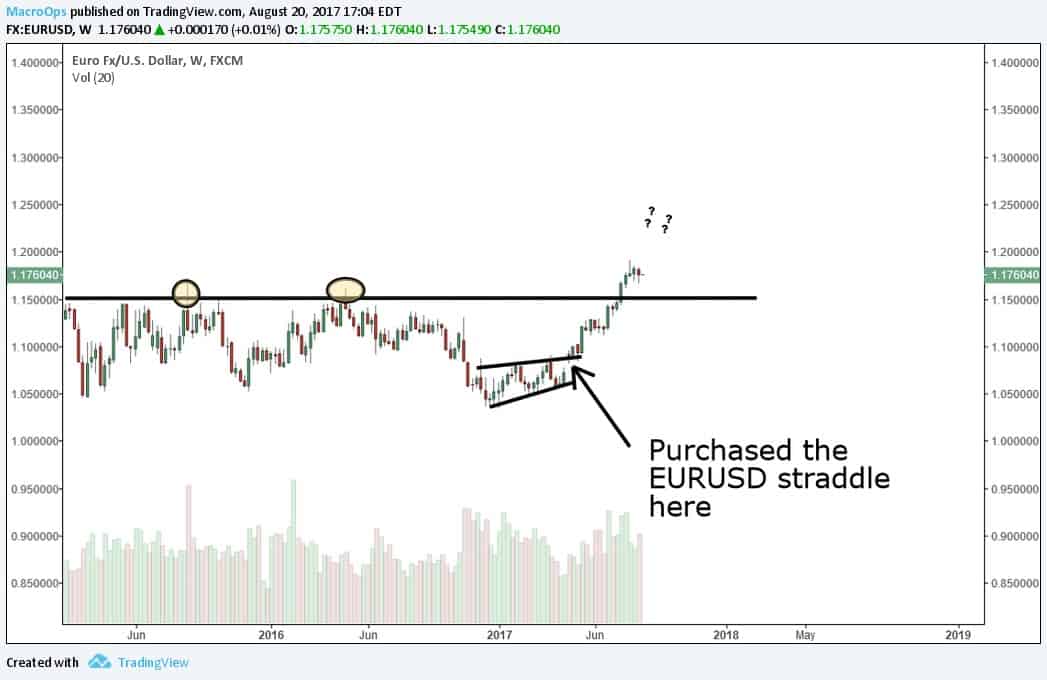
The options don’t expire until Jan. 2018, so the trade is still on our book. We’re up about 50% on it and I think we can make 100% if the Euro completes its upside targets.
The tough part of this trade was sizing. I have a hard time sizing long-term positions. For this one I chose 5%, which was probably on the lighter side.
It’s really rare to lose 100% on a straddle. It’s much more likely you lose around 50% of the premium paid.
In that case, at our 5% position size, the realistic loss on this trade was only around 250 bps. That’s a lot if the trade lasts a week. But if it’s over an entire year, that number becomes a lot less intimidating.
Using a 10% position size would have probably been a better play here and more in line with the overall portfolio volatility we’re trying to target.
One of my main areas of research at the moment is how to size long term option positions. I plan on publishing my findings to the Collective later this year.
Nat Gas Carry
I have to say this was probably my worst trade of the year. I wanted to get short natural gas because of a technical breakdown and steep contango in the new term futures. The reasons to get in were sound, but I butchered the execution.
When the goal is to suck out some yield from a contango curve, you have to be prepared to hold for a long time. That carry isn’t going to come all at once. It trickles in week by week.
I set myself up for failure here at entry. My stop was too close, which created a position that was too levered to hold for the long haul.
The price of UNG, the natural gas ETF, is still right around where I originally entered. But because I went in too big, I had to manage risk on small upside spike and eat a $10k loss.

Just like with the long-term option trades, I need to put more effort into figuring out position sizing on these commodity carry trades.
Overall all my opportunistic trading ideas had positive expectation, but I made much less money than I should’ve thanks to janky position sizing. A lot of people overlook the importance of position sizing. But in my opinion, the single largest source of edge for traders is their ability to size correctly.
Finding great signals, through whatever method, can only take you so far. To get to the next level in performance you have to intimately
All the market wizards had an uncanny sense for when to press their bets and when to take them off the table. Go back and read the Schwager interviews and you’ll immediately notice it.
COT
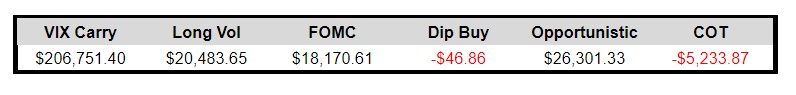
This last category is “COT” trades. It’s the newest addition to the Spec portfolio.
Over the last few years I’ve seen the same pattern frequently occur:
A macro trend will begin —> hedge funds and other speculative traders all pile in —> the move accelerates —> price action starts to go against the trend —> all the levered hot money covers at once —> price reverts back to the mean
Here are a few example of what I’m talking about.
Pound

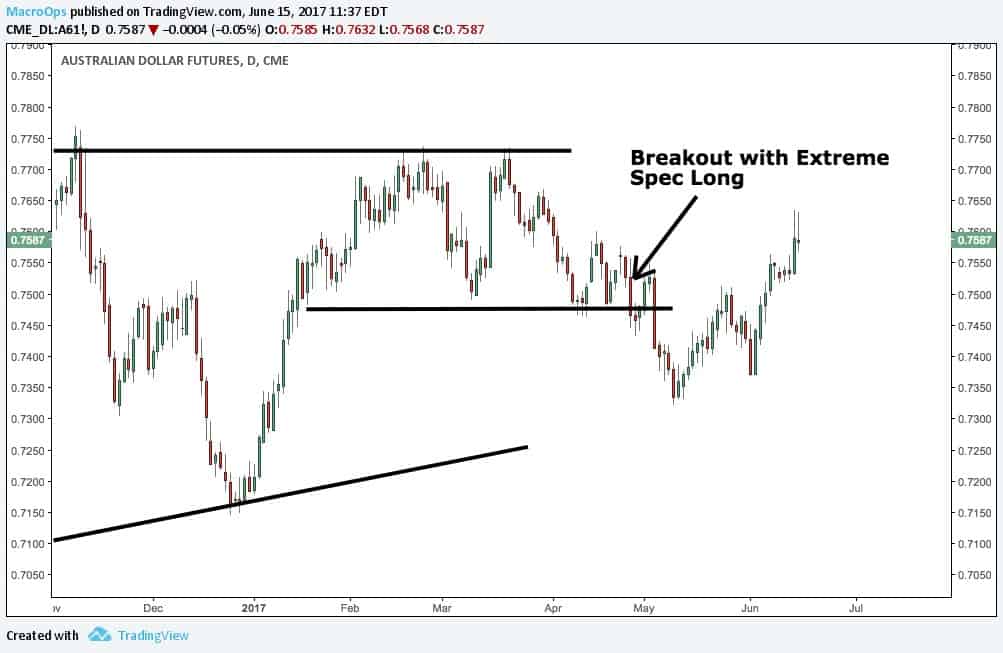
Aussie Dollar
Oil
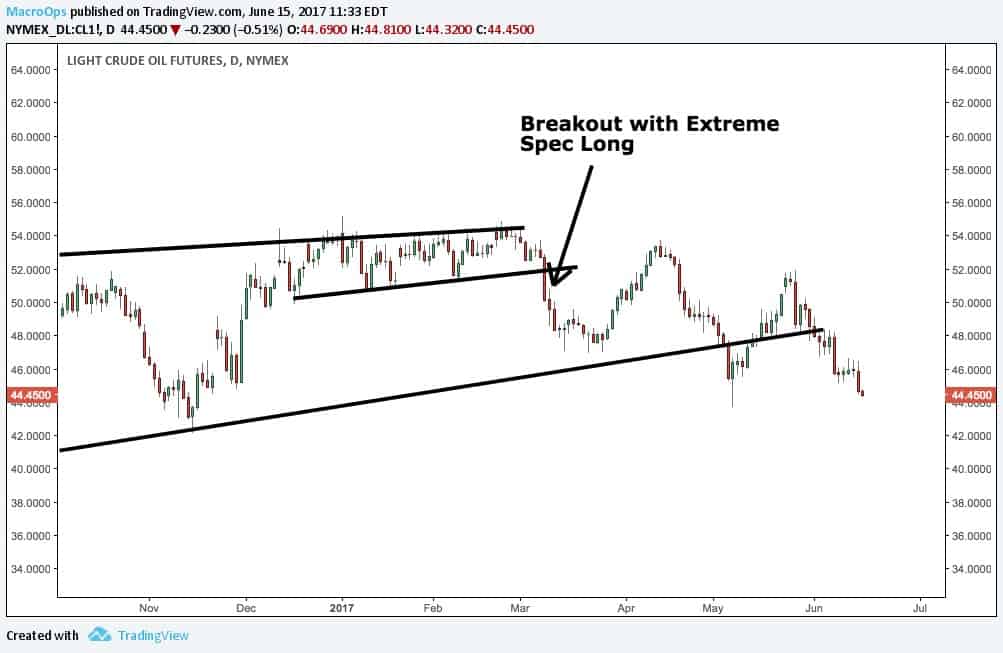
You can see how the overcrowded positions lead to sharp unwinds.
Before 2017 I had a tough time tracking which macro markets were getting “overcrowded”. It was an arduous process of headline reading and going through tons of charts.
But luckily for us our friends at freeCOTdata.com created an easy to use dashboard that uses COT data to show exactly what markets are crowded on the short and long side.
Now I constantly have an idea of what trends might be overcrowded and ready to snap back the other way.
So far this year I’ve identified and tracked 15 different setups of overcrowded markets combined with counter trend breakouts. Results have been pretty good.
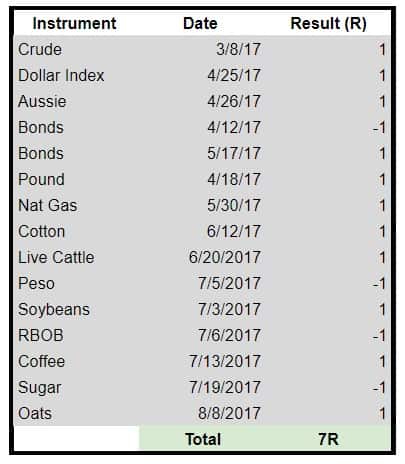
There were 11 winners and 4 losers for a total net gain of 7R. Had I trusted the baseline system and taken 100bp risk on each trade, I would of tacked on an extra 7% to this year’s results.
But as you can tell from the journaled P&L results at the beginning of the section, I actually lost around 50 bps trading these overcrowded setups.
This comes from trying to cherry pick the most “attractive” one. But my intuition added no value. It actually subtracted value.
So going forward I need to stay more mechanical on these trades.
I still think this overcrowded trading strategy will continue to perform because I don’t see any evidence of a changing hedge fund landscape. The low vol environment has decreased the opportunity set for everyone. This has forced hedgies and specs to crowd into all of the same trends. These guys are all weak hands and will continue to cover on any hint of counter trend movement.
That’s all for the mid-year review of Spec Ops.
I want to take a second to thank all you guys for contributing to our awesome community! Many of these trade ideas came from internal discussion in the Macro Ops Comm Center.
We’ve been able to put together a pretty awesome Collective that’s shown its worth in our results this year. I’m really excited for what the next few months have in store for our team.