The following is an excerpt from our monthly Macro Intelligence Report (MIR). If you’re interested in learning more about the MIR, click here.
The trading community has been yapping away about the VIX trading sub-11 and the extreme number of speculative shorts involved. They’re saying it’s gotta burst higher.
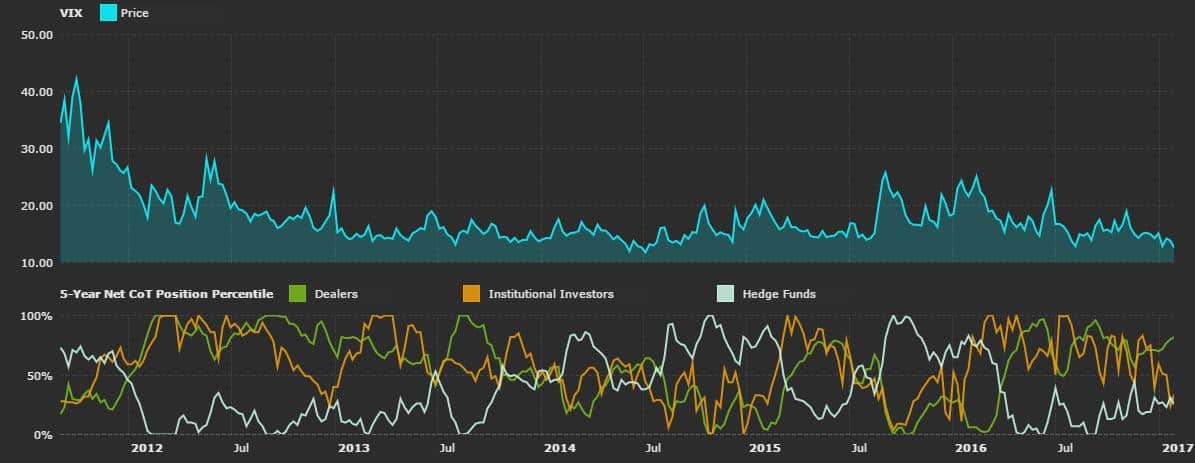
Their proclamations are presented with a chart like the one below which measures net nominal non-commercial positioning.
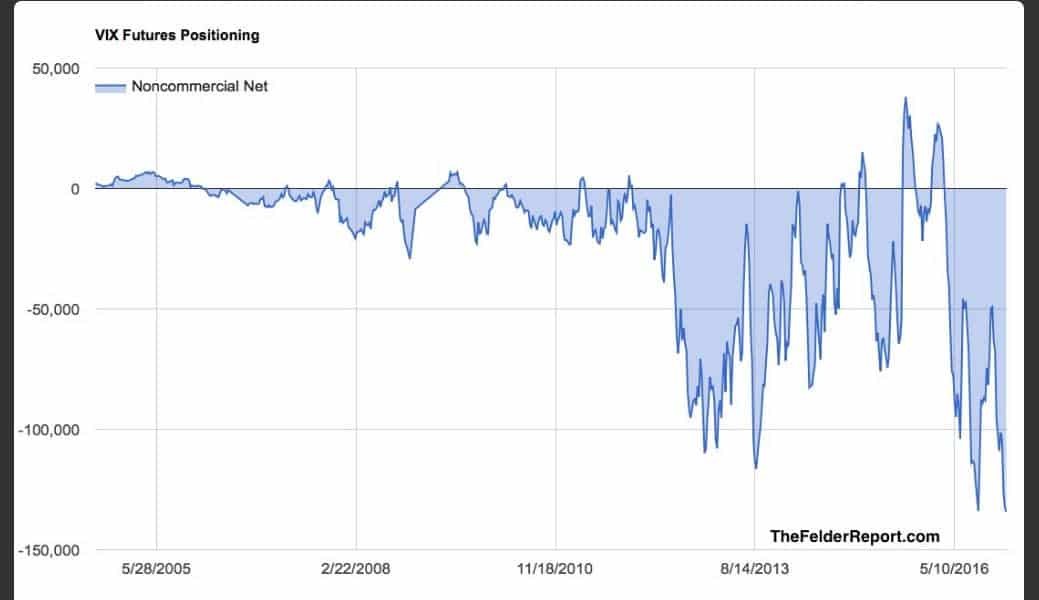
But these positioning charts are misleading. They fail to account for the growth in open interest. The VIX futures in particular become heavily distorted because open interest and volumes have increased 10x since they first started trading in 2004.
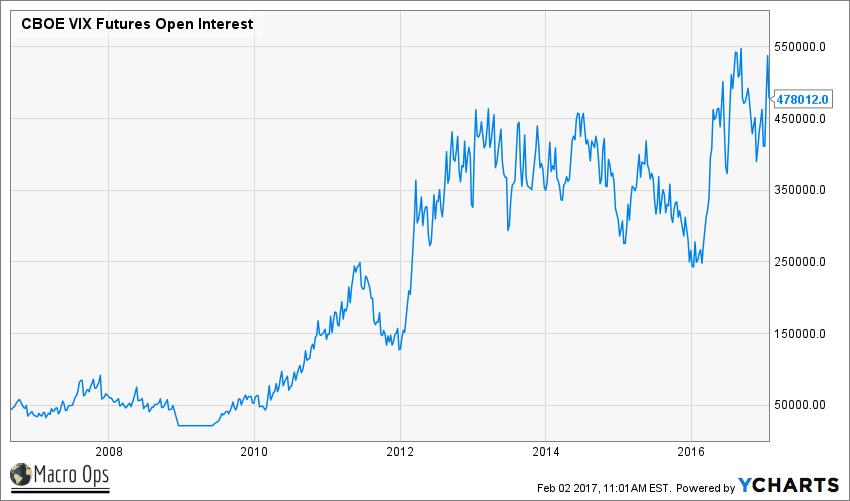
Net nominal numbers therefore mean nothing. Yes, the total amount of net shorts is higher than it’s ever been, but that’s because more people are trading VIX futures than ever before.
It’s easier to see why this is true with a simplified example.
Say they’re 100 open contracts and specs are short 99 contracts. Well obviously that’s a crowded trade. If the specs race to cover, price will squeeze hard. Specs are short 99% of the open interest.
Now let’s say activity grows and there’s 1,000 open contracts. Of these, specs are short 600, or 60% of the open interest. Compared to the prior reading, net short 600 looks a lot bigger than net short 99. But in reality the first situation has a more concentrated spec position. Participants previously were short 99% of open interest instead of 60% of open interest now.
That’s why you need to make sure you’re accounting for open interest.
We know a number of you visit freeCOTdata.com to look at positioning. We emailed the site owner Adam to ask if he was accounting for changes in open interest or not. As of now he is not accounting for them. But he’s rolling out an update soon to reflect the changes. After that update, the charts should give us a better idea of whether or not we’re at a true speculative extreme.
It’s worth noting that even without the update the 5-year percentile in VIX futures is not at an extreme. All the fuss on twitter was for nothing…
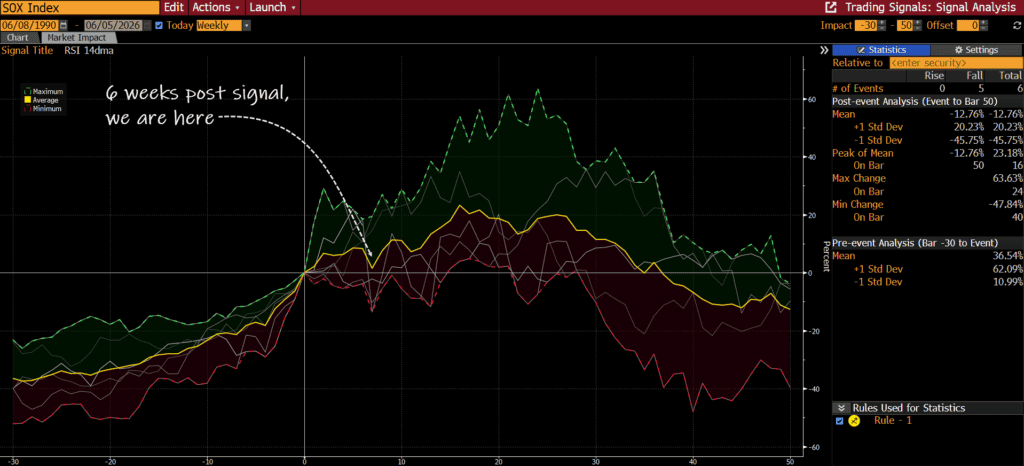
Given that positioning isn’t at an extreme (money managers are way too afraid to short vol in the Trump era), we’re in agreement with Goldman on what these low VIX readings mean. The data shows that low vol begets low vol, not high vol. Goldman conducted a study going back to 1990 to find out what happens to VIX and the market after VIX crosses below 11. The specifics of the study are shown below:
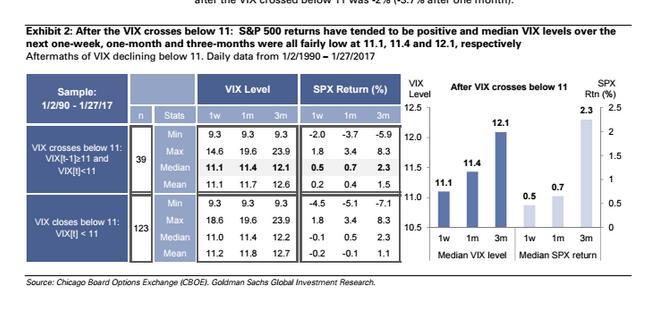
The median VIX level is only 11.4 one month after VIX crosses below 11. And 3 months after it’s only 12.1.
SPX tends to have positive median returns over the same period. The return for SPX is 0.7% after one month and 2.3% after 3 months. The worst observation showed a loss of only 5.9%.
Respecting these stats requires us to play for a continued grind higher in US equities and a low VIX. Resist the attempt to buy vol just because the VIX is low. This is a bad trade to make, especially when there are no foreseeable macro events in the coming month.
On top of the Goldman stats, implied volatility is currently trading at a high premium to the actual market. Look at the chart below of 60-day ATM implied vol (in green) plotted against 60-day realized volatility (in purple). The red histogram below the chart plots the spread between the two. A positive spread means equity index options are pricing in more volatility than what’s actually occurring. A negative spread means options are underpricing market moves.
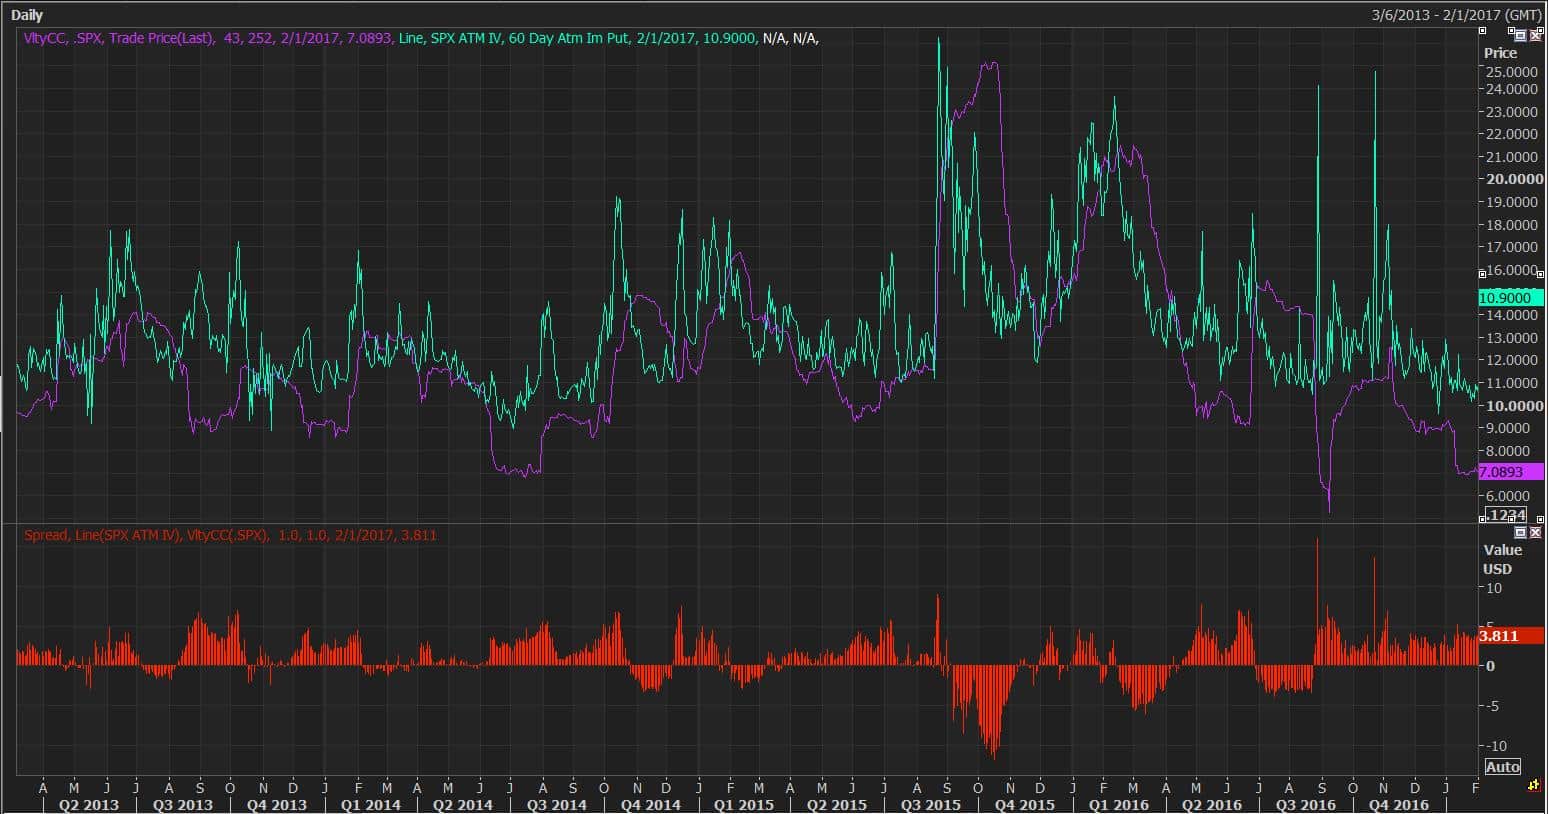
Right now implied vol is trading at 10.9% which is low. But realized vol of SPX is only 7.08%, even lower! Option sellers are charging a hefty price for long volatility exposure in relative terms.
This is what makes long vol trades so hard to execute profitably. The volatility risk premium (the spread) also tends to be even larger when the VIX is at low levels. The result is a strong negative carry that’s almost impossible to overcome.
And the election of President Trump has only exacerbated this negative carry problem. Chris Cole at Artemis Capital put it perfectly:
Trump is a protectionist bull in a china shop. Trump will keep the price of uncertainty high, and high uncertainty is very good for the business of dynamic volatility trading, but oddly poses a challenge for traditional hedging and tail risk funds.
In anticipation of a volatile U.S. presidential term, investors have drove the cost of hedging to historic highs. You can measure this by skew, implied volatility premium, and volatility forward premium.
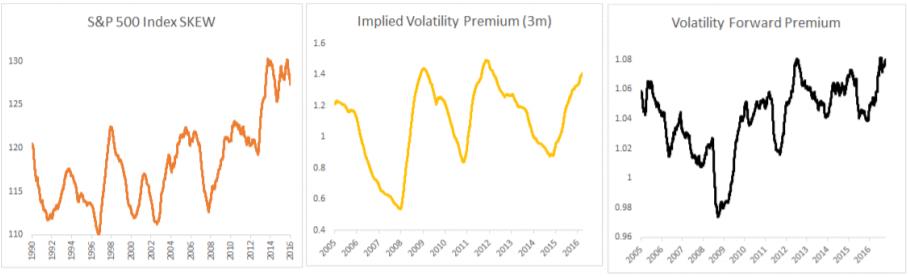
Charts by Artemis Capital
Out of these three graphs, the CBOE SKEW Index is the most interesting. For those of you unfamiliar with SKEW, it’s a measure of how much perceived tail risk there is in the market. High readings mean far out-of-the-money puts are rich and investors are pouring money into tail hedges. Low readings are the opposite — investors are complacent and not worried about an outlier event.
Plotted to the right is the 1-Yr moving average of the SKEW Index. Usually it oscillates in a well defined range. But since 2008, the SKEW Index has trended straight upward.
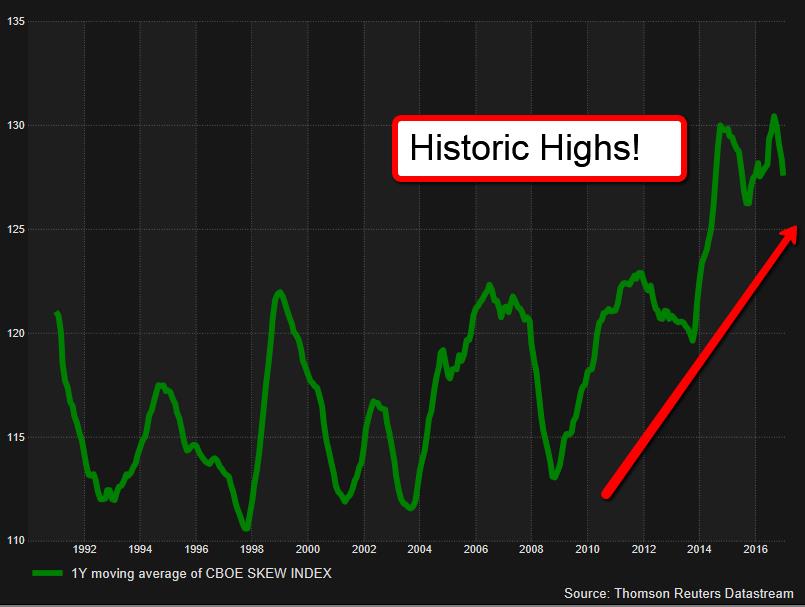
Maybe investors are still having nightmares about the 2008 crisis. Or perhaps Taleb’s black swan theory has become so mainstream that everyone’s protecting against the “fat tail.” We’re not sure why we’re seeing this mean-reverting oscillator break down and start to trend, but this change in investor behavior is interesting. Hedging a stock portfolio is now more expensive than ever before.
We’ll likely continue to climb the “wall of worry” until institutions get sick of losing so much money hedging their equity downside. Our team at Macro Ops will be staying clear from tail hedging for the time being. Insurance ain’t cheap today.
The above is an excerpt from our monthly Macro Intelligence Report (MIR). If you’re interested in learning more about the MIR, click here.