“Bullishness is born as hope in the midst of despair. Hope swells to confidence and confidence swells to euphoria, and the process contains the seed of its own destruction and the birth of its opposite, fear. Fear is nurtured by falling prices and the two feed on themselves until they swell to despair. And so the cycle is completed -and ready to begin again with the birth of hope. This is both the way things are and the way they have to be.” ~ John Percival “The Way of the Dollar”
Good morning!
In this week’s Dirty Dozen [CHART PACK] we look at investor flows, bitcoin extension, USD positioning, EMFX sentiment, inflation indicators, and an Ag-tech play, plus more…
Let’s dive in.
***click charts to enlarge***
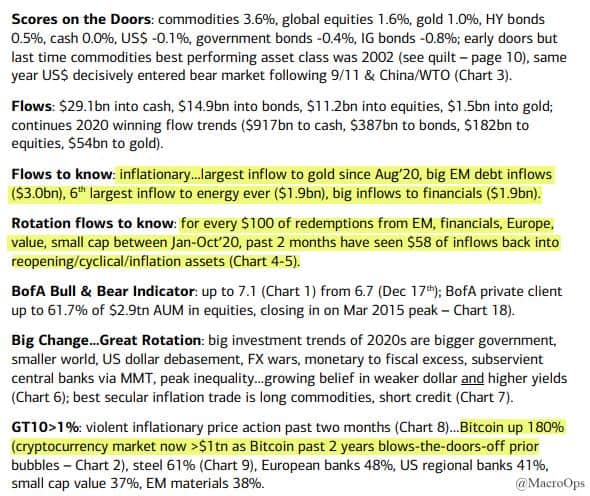
- BofA’s latest “Flow Show” noted that investors piled into gold at their quickest pace in months last week. Other highlights are below.
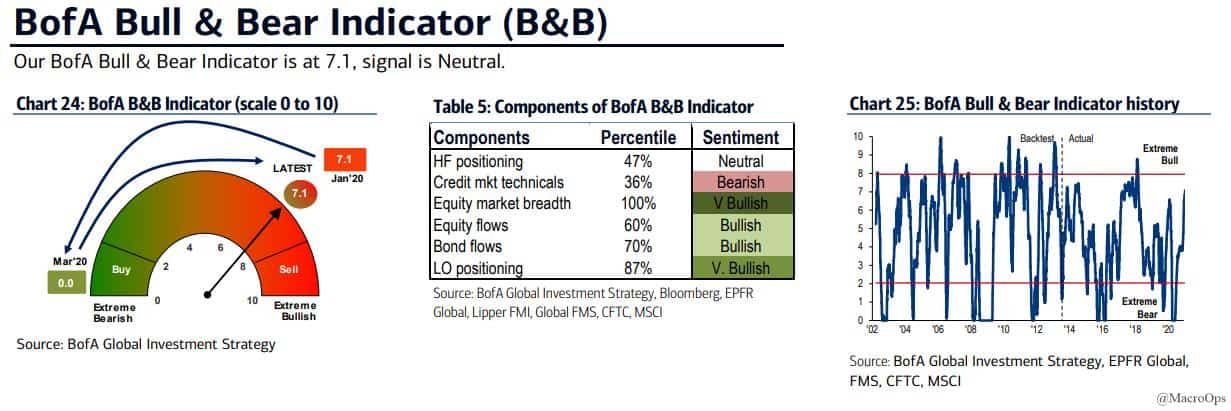
- Their Bull & Bear Indicator is at 7.1 showing sentiment is strongly bullish… this is still below levels that trigger a sell signal though. More upside is likely over the next few weeks.
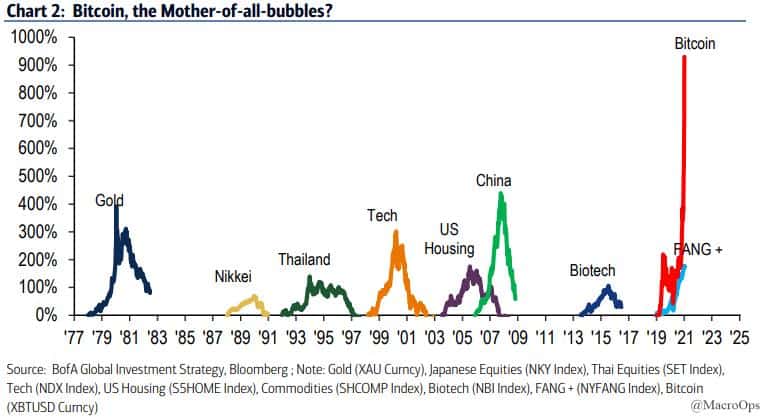
- The run in bitcoin is something to behold.
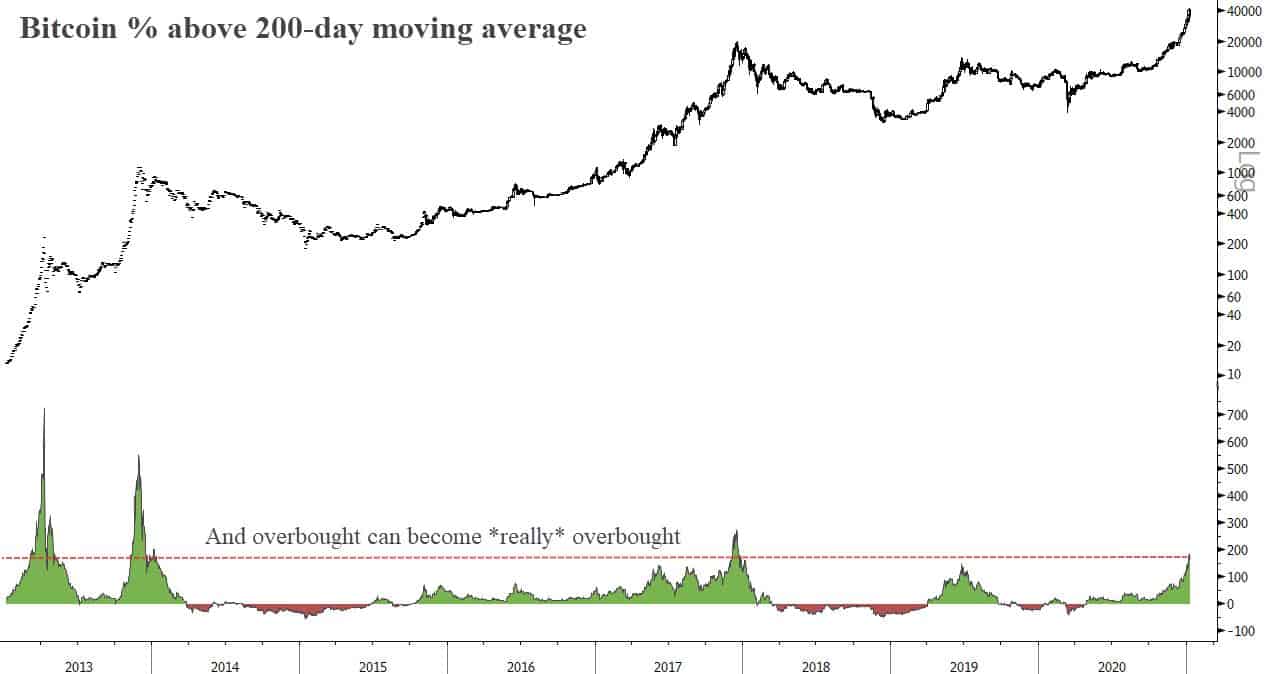
- Top calling is a costly endeavor in a trend such as this (I know, I thought myself smart taking half-profits 50%ish ago). The near-term chart shows bitcoin is incredibly extended from its 200-day moving average.
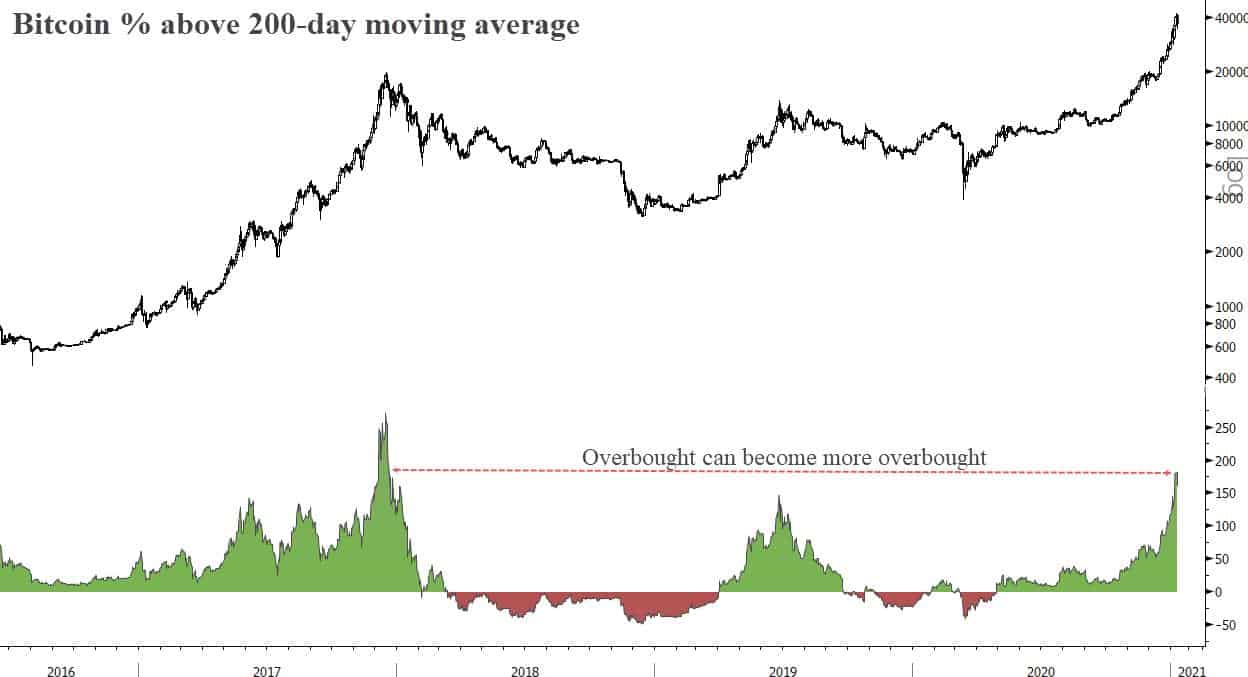
But overbought can become *really* overbought.
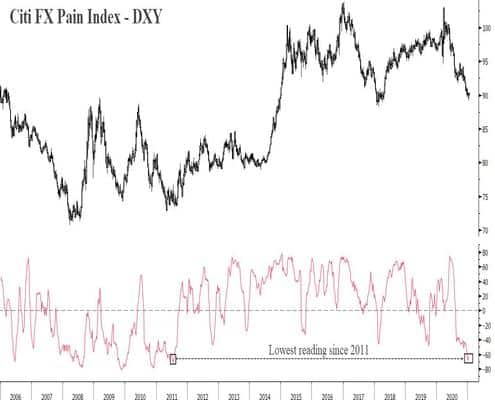
- The US dollar is down at its 2018 lows, an area where it may finally find some support. Citi’s FX Pain Index shows FX Funds haven’t been this short US dollars since the DXY 2011 bottom.

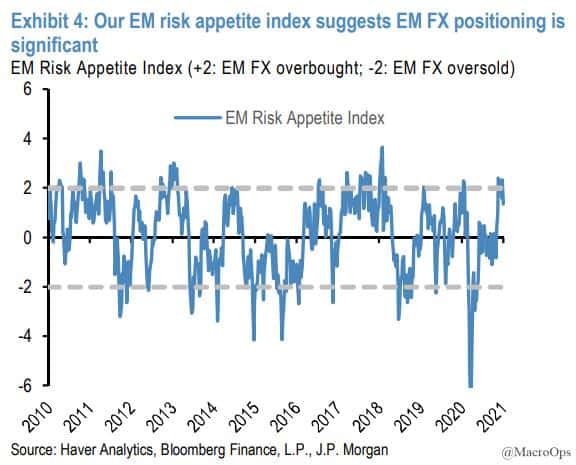
- JP Morgan writes “our top-down EM FX positioning indicators imply that EM FX positioning is comfortably above historical averages. Our EM FX risk appetite index combines several key technical indicators into a headline measure using a PCA approach, including local EM bond and equity fund flows, direct foreign investor EM local bond and equity purchases, Commitment of Traders positioning data, FX implied volatility, and RSI indicators(Exhibit 4). Traditionally the indicator has served as a good mean reversion indicator at its extremes of +/-2 score.”
We’re keeping an eye on US real yields as they should lead any reversal in this reflation trade.
- Speaking of EMs, the MSCI Emerging Market Index just hit an all-time high.
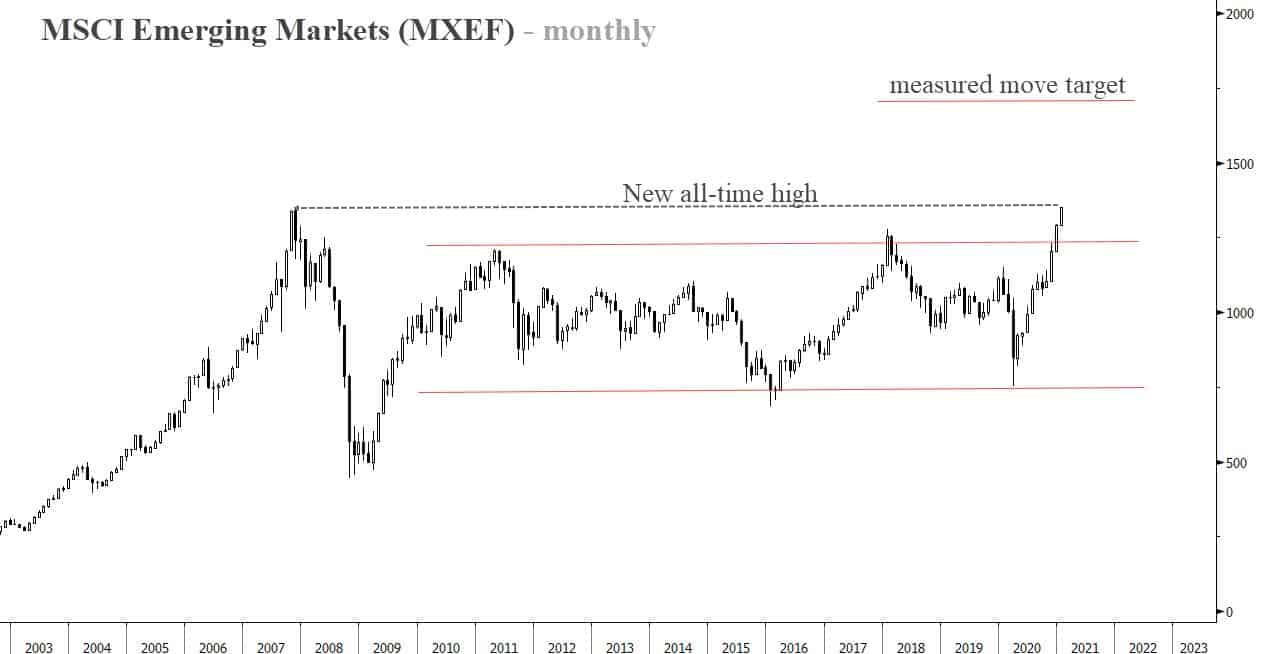
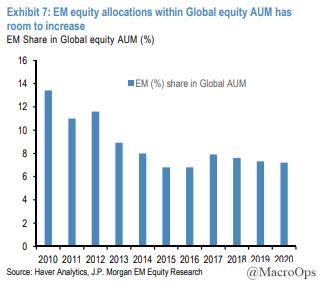
- While we’re due for a washout in the short USD/long reflation/EM trade sometime in the near-term, the long-term capital concentration dynamics still strongly support an enduring bull market in EM.
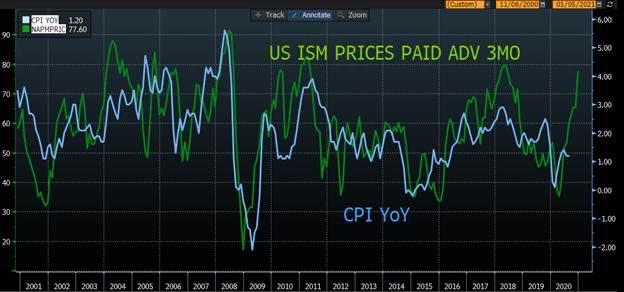
- Higher inflation is coming… ISM Prices Paid are a good leading indicator of CPI (h/t Gavin Baker).
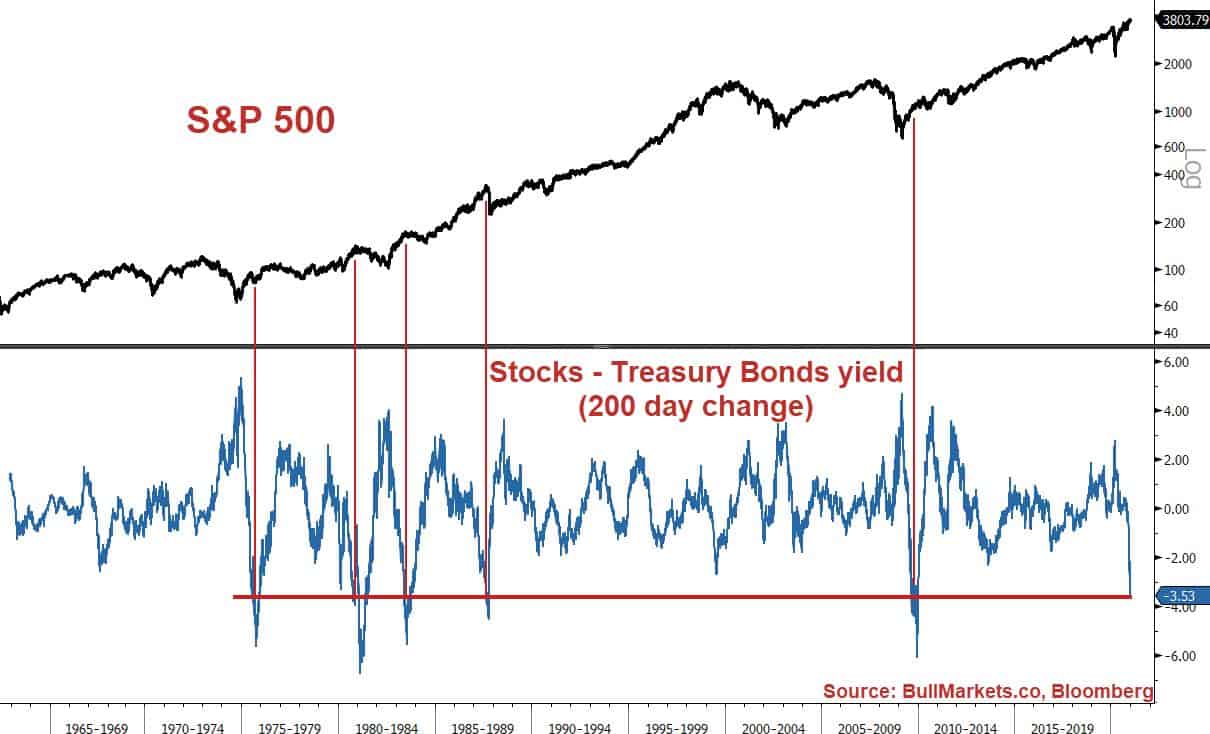
- The rally in stocks combined with the fall in bonds has driven the SPX earnings yield – UST yield 200-day rate-of-change to a recent low. A period of volatility has shortly followed past instances (h/t @bullmarketsco).
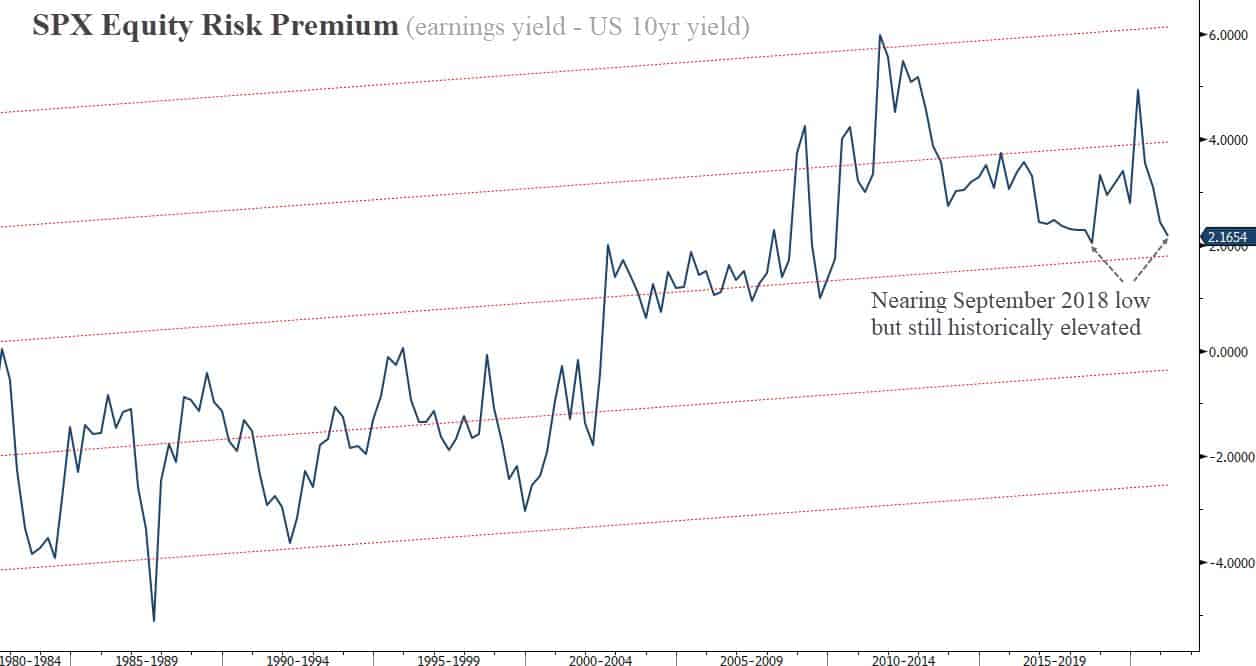
- The SPX’s Equity Risk Premium is at cycle lows. The last time we were here was in September 2018, which happened to precede a large market selloff. There is a case to be made though that with the paradigm shifts in Fed and government fiscal policy we’ve seen, the ERP is going to compress further closer to historical averages.
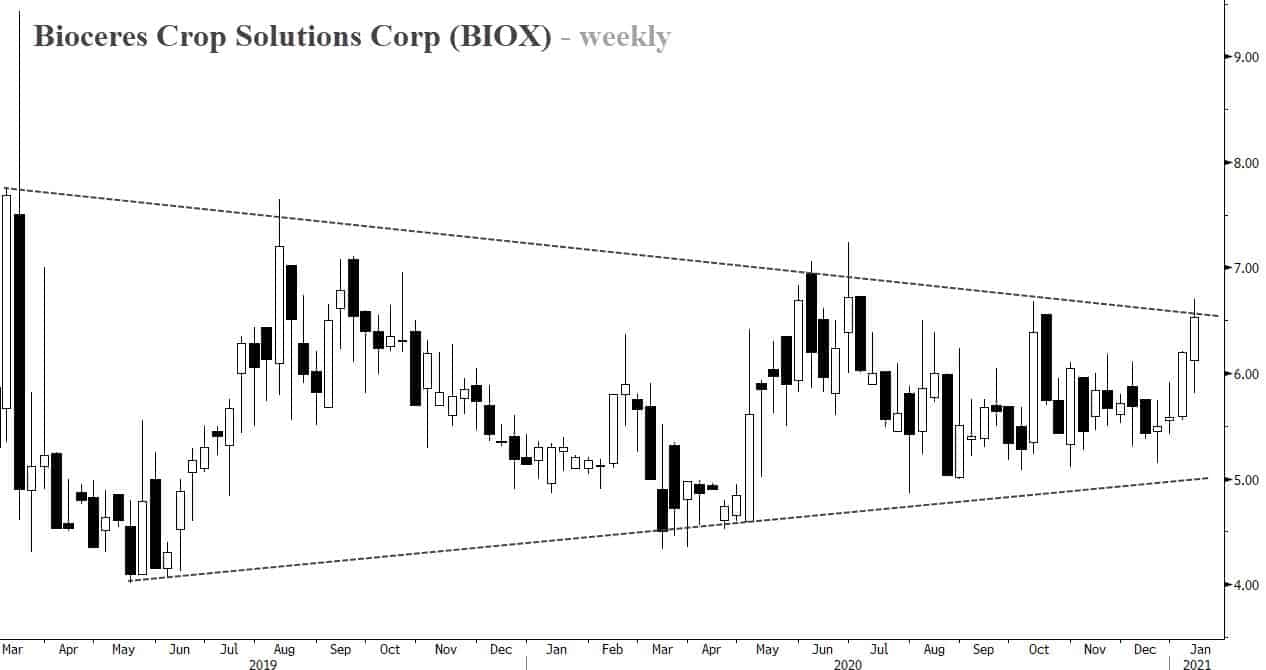
- Ags are in the early-innings of a bull market. We’ve been going through a list of names, looking for opportunties. BIOX is a company we’re digging into this week. It’s an Argentinian based Ag-tech company that operates through three segments: Seed and Integrated Products, Crop Protection, and Crop Nutrition.
The weekly chart is forming a multi-year base and is on breakout watch.
Stay safe out there and keep your head on a swivel.