I’m going to try something new over the next few weeks. Consider it a little experiment in replacing the weekly Dirty Dozen. Instead of the DD, I’m going to share my notes on the market going into the week. I’ll cover whatever is grabbing my attention, the key risks and core indicators I’m tracking, the trade setups I’m watching, as well as some general riffing on an idea or thematic I’m noodling over.
Give me a few weeks as I iterate to find a format that works. But, feedback is welcome, so if enough of you prefer I stick with the DD, please let me know. And I will gladly revert to my old ways.
I’ve just been doing the DD for many years now and thought I’d try a little change.
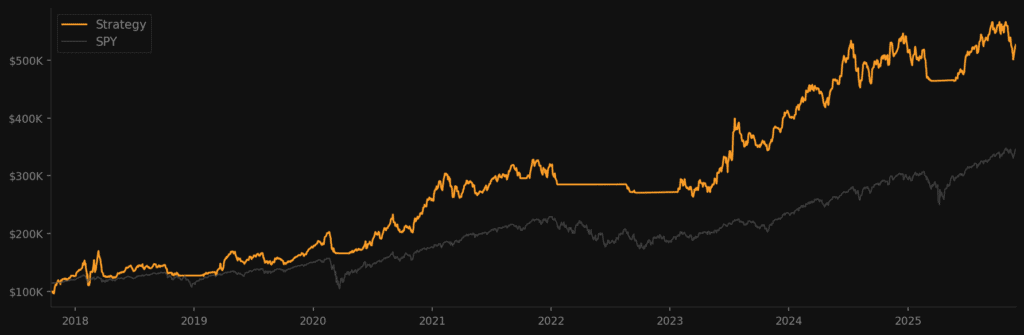
YTD Portfolio Performance: +27.8% ytd
Current Positioning / Open Orders:
- Futures: Long S&P 500, Mexican Peso, Gold, Silver & short Japanese Yen
- FX: None
- Equities:
- 22% notional exposure to Defense & Aerospace
- 36% long exposure to Metals & Mining
- 8% long exposure to Energy
- 17% long exposure to BTC
- 7% long exposure to Other
Join Our Collective
Primary Macro View:
To have a strong macro view right now is like trying to play Frisbee in a hurricane. It’s just a plain bad idea, and you’re likely to lose your shirt… So instead of grand macro narratives, we’re focusing on what we can know, what we can confidently tease from the whole of the data, while always making sure we’re listening to the market for signs we’re on the right trail of crumbs, or are getting lost in the forest.
- A persistent bid: SPX companies set a new record with nearly $300bn in Q1 buybacks. Expected Fed rule changes this Fall could unlock another $70bn from the six largest banks for buybacks and dividends. This strong bid is expected to persist through year-end. Read here why this matters.
- CAPEX-Profit reflexivity: Big tech expected to invest approx $392bn in CAPEX this year alone. The Levy-Kalecki equation shows that investment is the dominant driver of aggregate corporate profits. And this CAPEX-Profits relationship is circular. For instance, if AMZN buys $250 million worth of chips from NVDA, NVDA records a profit of $200 million. While AMZN doesn’t book the whole cost for this year, because it’s a depreciation and amortization charge. Which, using datacenters as our example, get expensed typically over a 5yr period, so maybe $50m in expenses gets booked this year. That’s $150m in net investment/profits for the tech industry. And since big tech are customers of each other’s services/products and these stocks account for the most concentrated weighting in the S&P 500’s history, we can see how this circular CAPEX-profit reflexive relationship plays out. And these juiced profits end up where? Read the first bullet point above, again…
- AI Boom-Bust: The AI narrative game allows expectations over net profits from these investments to be extended way out into the future, and the potential (however small or unlikely it may be, in this author’s opinion) of AGI means that the players have to go all-in or risk becoming irrelevant. And this means we have all the trappings for a classic Soros-style reflexive Boom-Bust process.
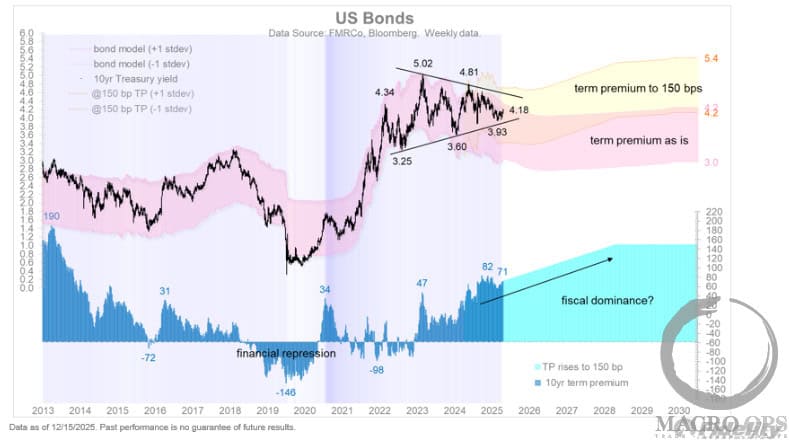
- US tax cuts of $234bn in 26’ will help to offset some of the declining US fiscal tailwind (see chart below). This fading fiscal impulse will begin to be felt starting in Q4 and going into 26’ — remember, it’s not the level but the rate-of-change that matters!
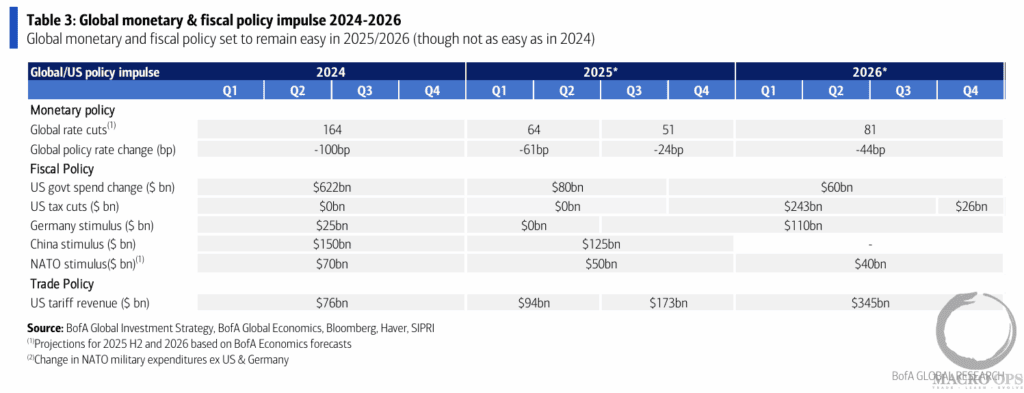
- Tariffs… who knows? Not me. The current expected negative impact of the tariff tax increase is from $76bn in ‘24, to $161bn in ‘25, and $345bn in 26’, according to BofA.
- Two points on this: (1) Trump has midterms he wants to win next year, so I imagine he’ll be quick to reverse course, TACO, and stage a “winning” retreat when he gets scared (2) the forcing function here is markets. Trump showed his colors this Spring. He’s watching stock indices and bonds, and while he’s okay with a bit of vol, he doesn’t want big chaotic sell-offs, especially in the bond market. Oh, and (3) the Trump reaction-market function seems to cut both ways… if markets are ripping while he’s doing his agent of chaos bit, then that’ll likely embolden him to press harder. The risk here is that he overplays his hand. This is what we’re seeing right now.
- Recession risk has been overstated all year. The labor market is slowing, but not cracking. Which is important, because it means that better policy signaling and a removal of the economic uncertainty could stem the leak and get companies hiring again. However, more hip shooting tariff announcements, could just as easily tear the leak wide open and push us into a policy-induced recession. TBD.
Primary Trend View
SPX’s April low was a significant bottom, and US equities are now in a major primary uptrend. This bottom was confirmed by numerous high signal breadth thrusts that typically lead to excellent 12m forward returns. Expect this primary trend to continue well into the end of the year.
Bonds are in a 30m+ sideways consolidation. I can make arguments for eventual breakouts in either direction. Too much will depend on policy moves and economic impacts. For now, I expect sideways chop and vol to continue.
Precious metals are in the very early innings of a cyclical bull market. In fact, the standard cyclical bull hasn’t even started yet. It’ll kick off once capital starts fleeing in force from the overvalued US market out to the RoW. I expect gold to rise above $7k before and silver over $65/ozt his bull cycle ends. The current trend is mostly driven by central banks and sovereigns diversifying their holdings. Retail flow has hardly joined the party yet. This remains my strongest conviction and long-term macro call.
DXY is likely at the very start of a cyclical bear market. But we expect this first leg to be volatile with large retracements, before a clear trend is established in early 26’.
BTCUSD is in the middle of a cyclical up-trend that started in 23’. I expect it to rise above $300k before it tops out.
MO Heads-Up-Display (HUD) Indicators:
- Trend Fragility and Risk Cycle: Two measures of short and long-term risks (ie, leveraging, FOMO chasing, etc…) in markets continue to give the all clear and support the broader uptrend. However, a few of the individual components that measure short-term risk-taking are starting to heat up. Not yet in Sell Signal territory, but they bear watching.
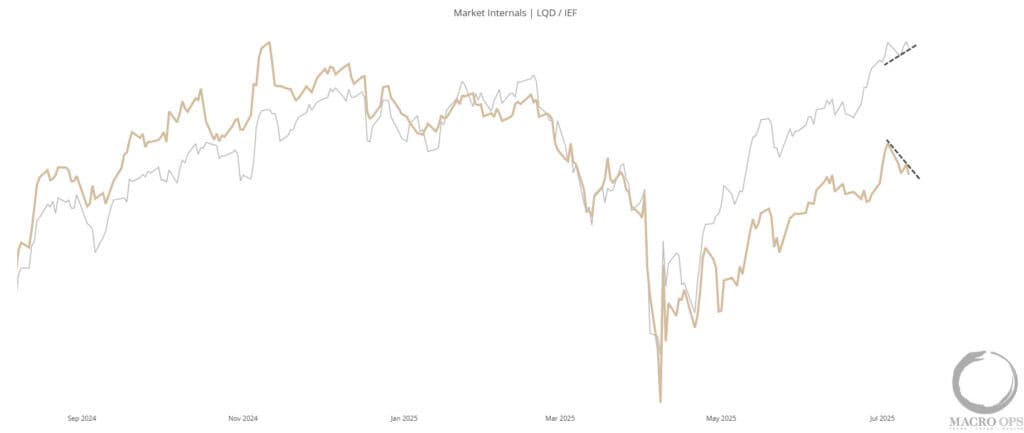
- Market Internals: Generally remain supportive of the broader uptrend though we are starting to see some negative divergence in credit spreads, momentum, and Qs versus the SPX. Nothing to be concerned about yet. Just need to track to see how it progresses.
- MO Liquidity indicator: Still flush, though it fell from 88% down to 72% last week. It will take a few more weeks of readings to see if this is a trend change or noise.
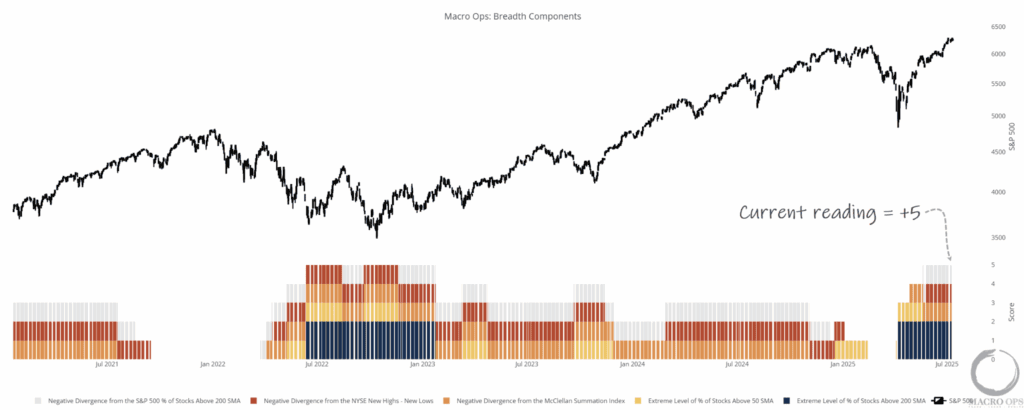
- Aggregate Breadth: The indicator remains strong at +5, while readings near +1 or 0 have historically signaled major tops, and levels below four typically indicate corrections within broader uptrends.
- CoT Positioning:
- Commodities: Crowded longs in feeder cattle and crowded shorts in soybean meal, sugar, rough rice, cotton, and corn.
- Equities: Crowded longs in Nasdaq 100 and crowded shorts in Russell 200
- Currencies: Crowded longs in JPY and crowded shorts in AUD and DXY
- Debt: Crowded longs in 30yr UST bond and crowded shorts in 5yr UST Note
Weight of the evidence: The primary trend in risk assets is up. The data above supports this view. However, this bull leg off the April lows is getting extended. This doesn’t mean it’s time to sell, or even time to stop adding risk. It just means we need to remain aware of how our key data points evolve — markets can stay extended longer than you can remain patient, or something.
A few market internals, as well as some short-term sentiment/positioning indicators, are suggesting we’re getting closer to the corrective phase of this bull trend. I expect rising yields to be the catalyst for this correction. The 10-year level I’m watching is 4.5%. If yields rise above there, then stocks should start to feel the pinch and react accordingly.
Due to the broader backdrop, we expect this pullback to remain muted, in the 4-7% range. Our book is loaded up, so we’re moving up stops for partial profits and being very tactical when adding risk-on correlated trades. We view any correction as a buying opportunity, barring a significant surprise on the trade war front, which is a real risk that is starting to look underpriced with the Aug 1st deadline coming up. So we’ll have to be nimble around developments on this front.
What I’m tracking:
Price can correct through time, space, or both.
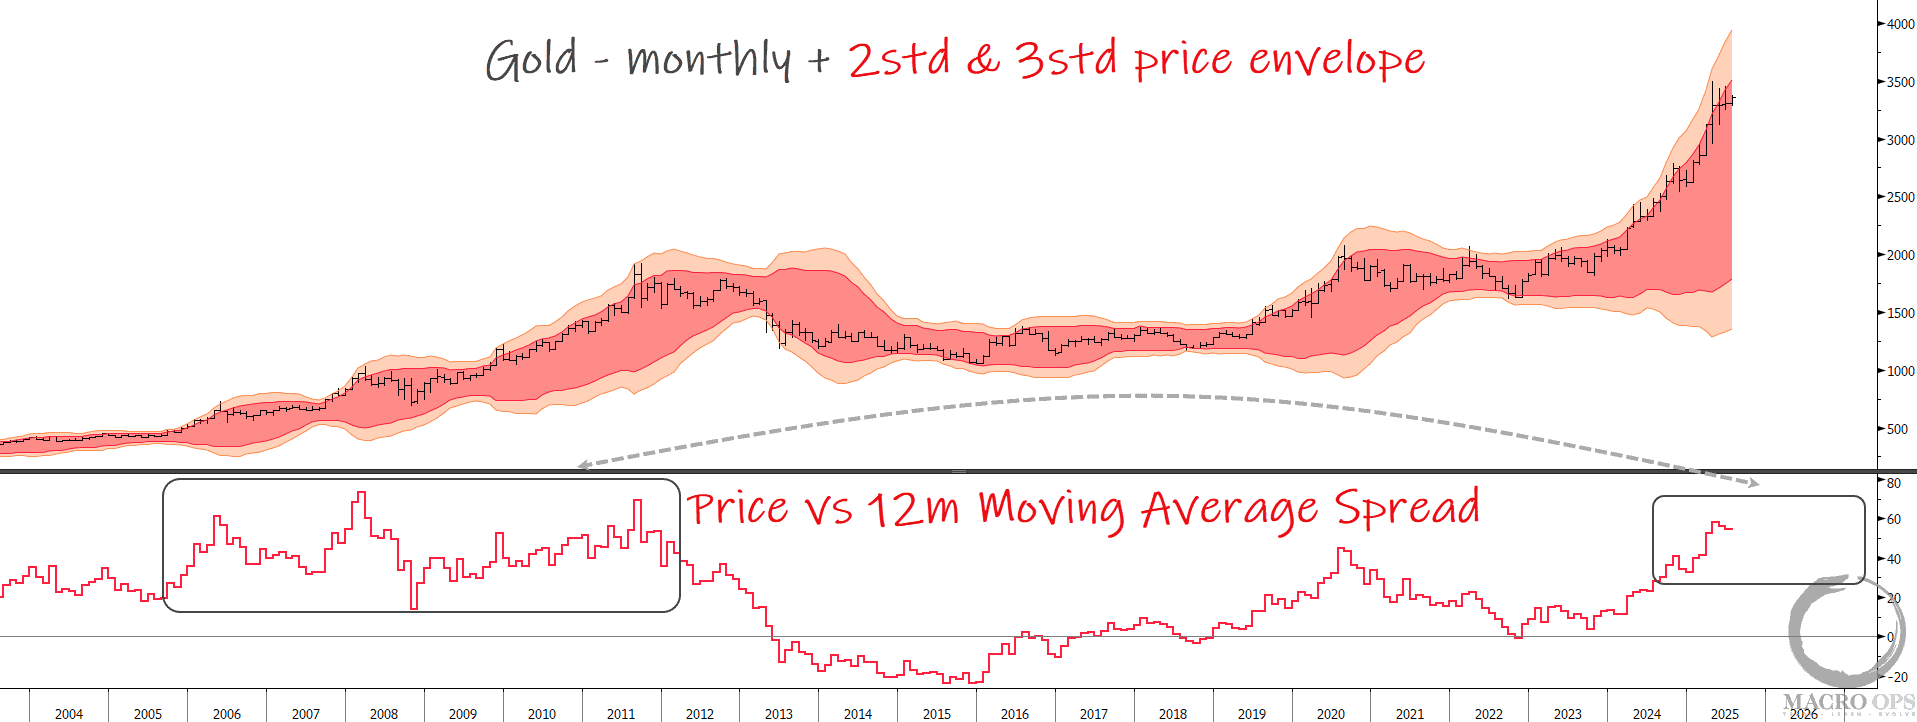
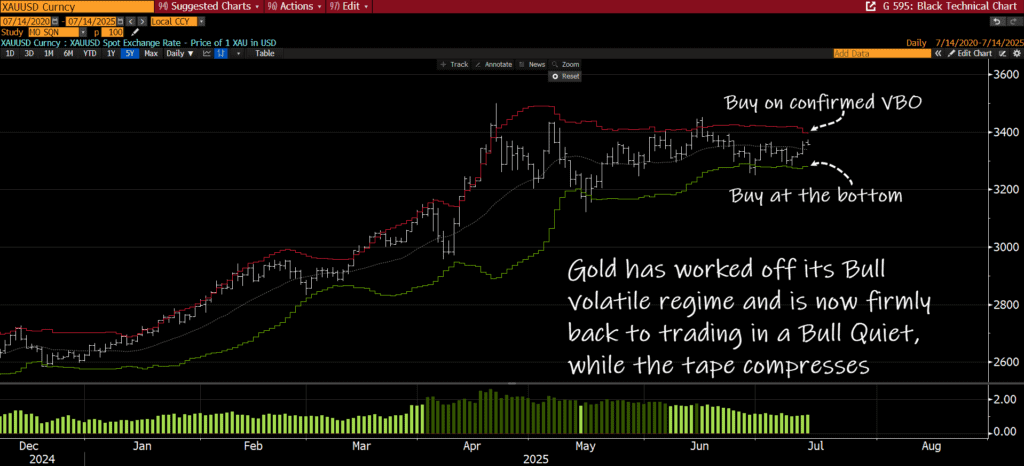
Gold, as we can see on the daily chart below, is correcting through time. This is a sign of underlying demand strength, especially considering how extended the trend is across both weekly and monthly timeframes.
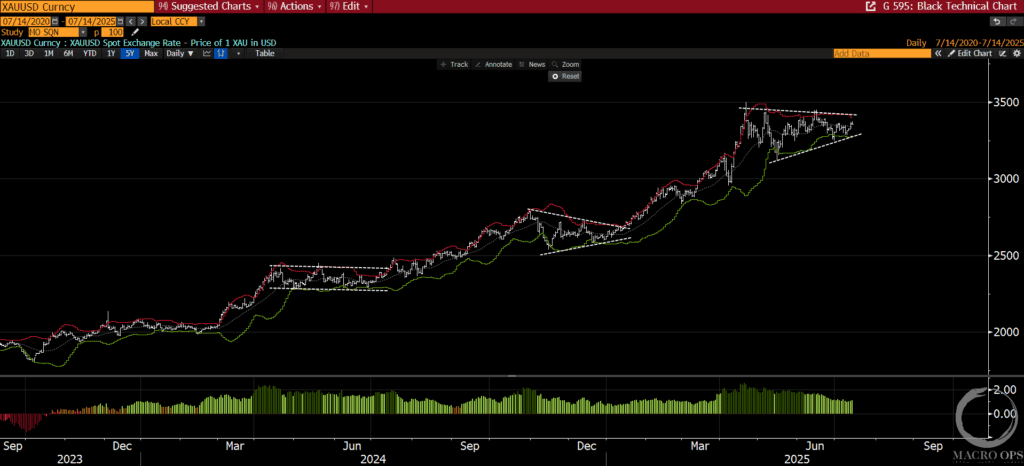
Instead of seeing a large volatile corrective period, which is what you’d expect after its monster ytd run-up of 33%, it’s quietly consolidating in a sideways compression regime.
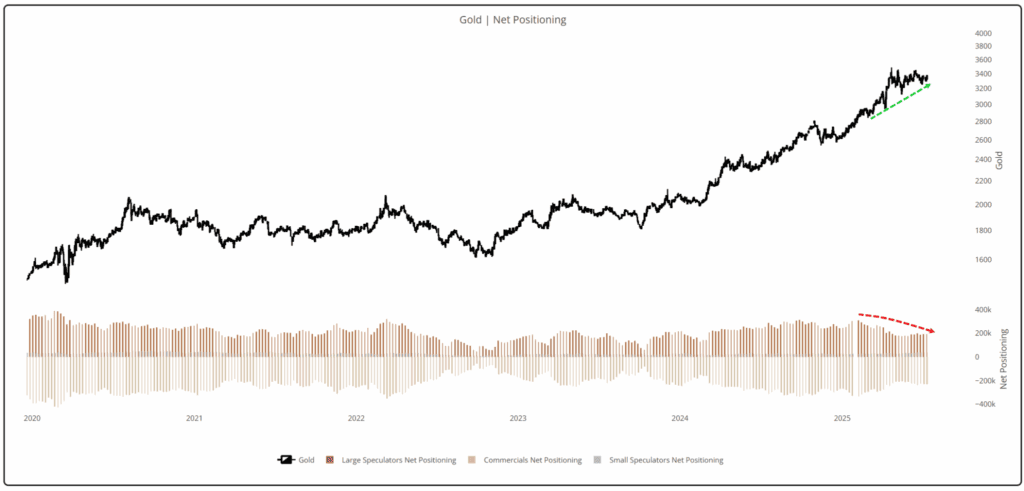
This tells us that strong hands (central banks) are holding — and likely buying more — which is why we’re seeing this compression sideways.
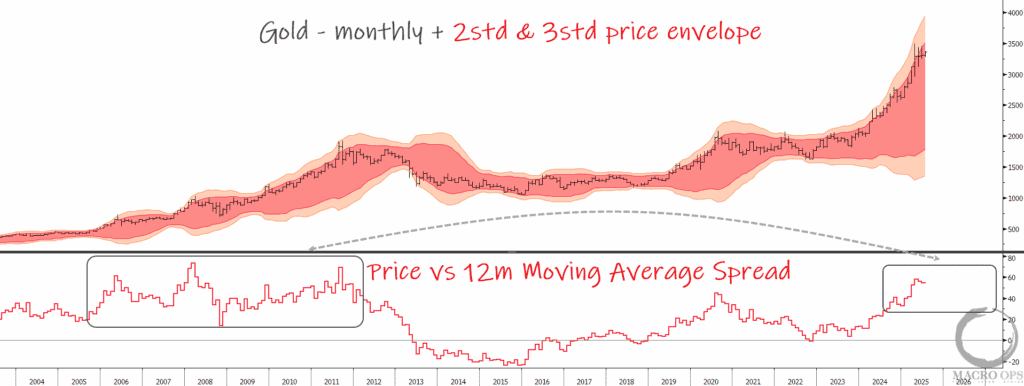
Gold peaked on this latest leg once it traded into the 3std zone. It hasn’t been this extended from its 12m moving average since the 2011 peak of the last bull cycle. However, as we can see from that period, overextension persisted for years, indicating that it’s often a characteristic of a strong bull market in bullion.
Despite gold and gold miners being the leading assets ytd, we’re just not seeing the regular retail crowd hype or goldbug chatter that you’d expect following this type of run. This is great for those of us who are long.
We’re long gold and are buyers at reversals off the lower bands and confirmed volatility breakouts (VBOs) above the upper band. Remember, gold is in a 3-month compression regime, and compression regimes often precede fast trend breakouts. So stay on your toes with this one.
We got long silver last week. It broke out of its multi-month trading range.
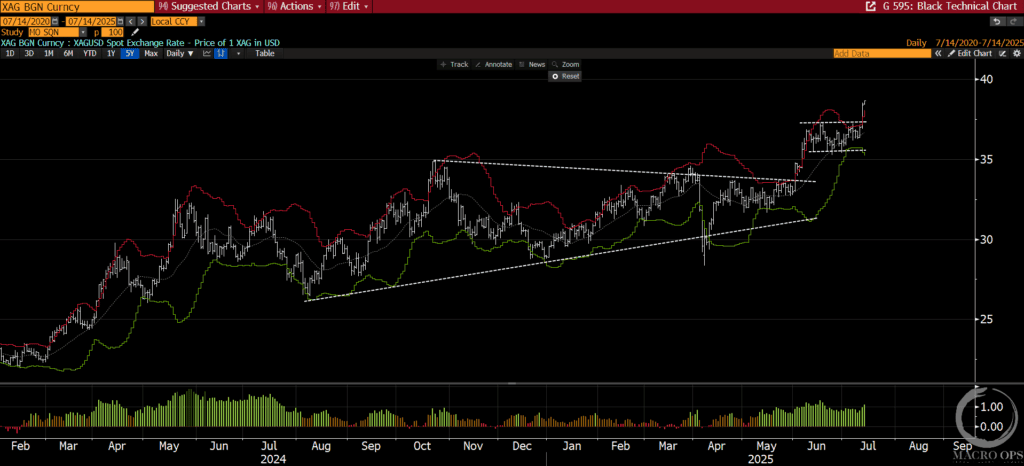
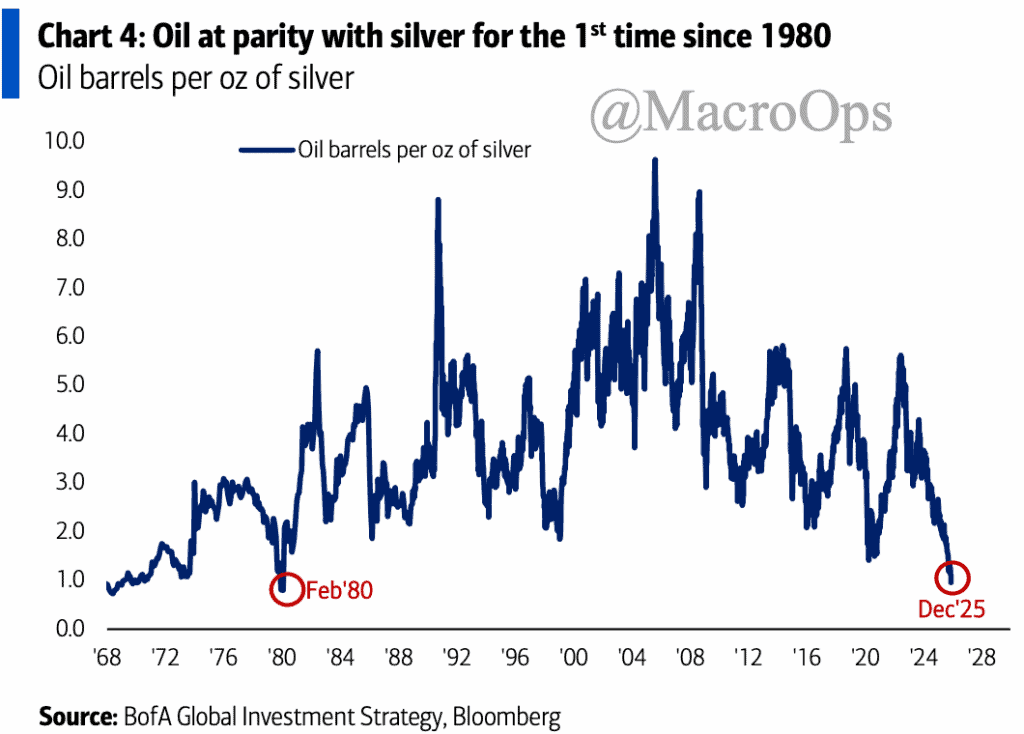
The silver-to-gold ratio is near its historic lows.
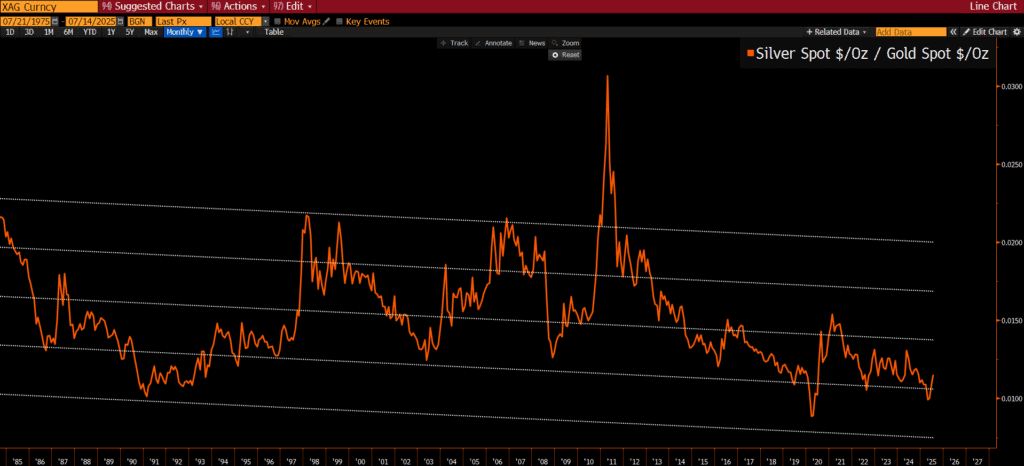
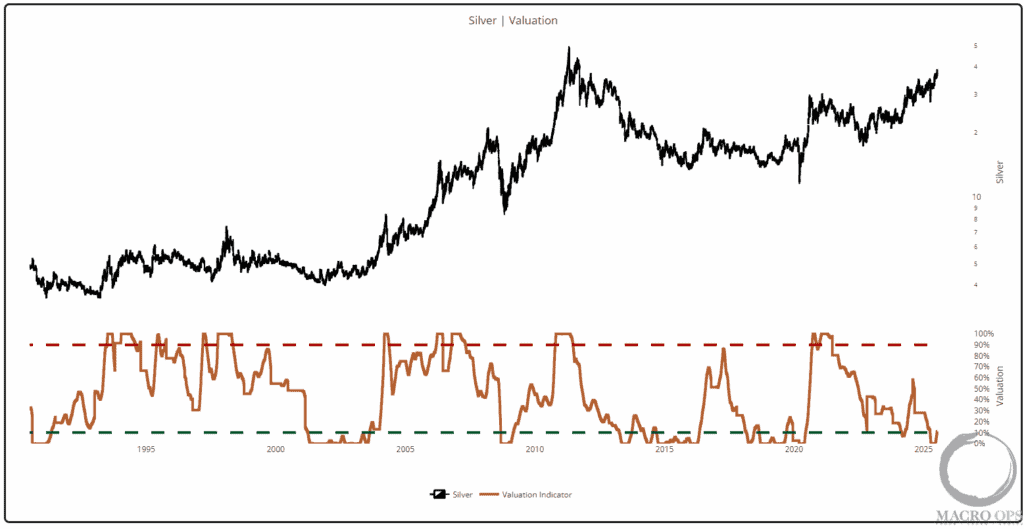
And its valuation is coming off the zero percentile, showing there’s a lot of pent-up mean reversion energy ready to drive silver higher.
Our preferred way to play PMs is through futures. But we’re also long a few miners, including the silver miner Andean Precious Metals (APM.TSX), which is our favorite of the bunch (and up over 300% since Brandon first profiled them last year).
I continue to watch USD, looking for a potential reversal. We have a small tester position in long USDJPY, where positioning is crowded. But this is a counter-trend trade, and those trades are a bit like spitting in the wind, so I fully expect to get stopped out. But… if we see supporting price action this week or next, I’ll look to quickly press the bet as the dollar bearish narrative has grown fairly consensus.
We might take a small flyer on Sugar this week. Sentiment and positioning are washed out. Seasonals are neutral. Relative valuation has flatlined in the 0th percentile.
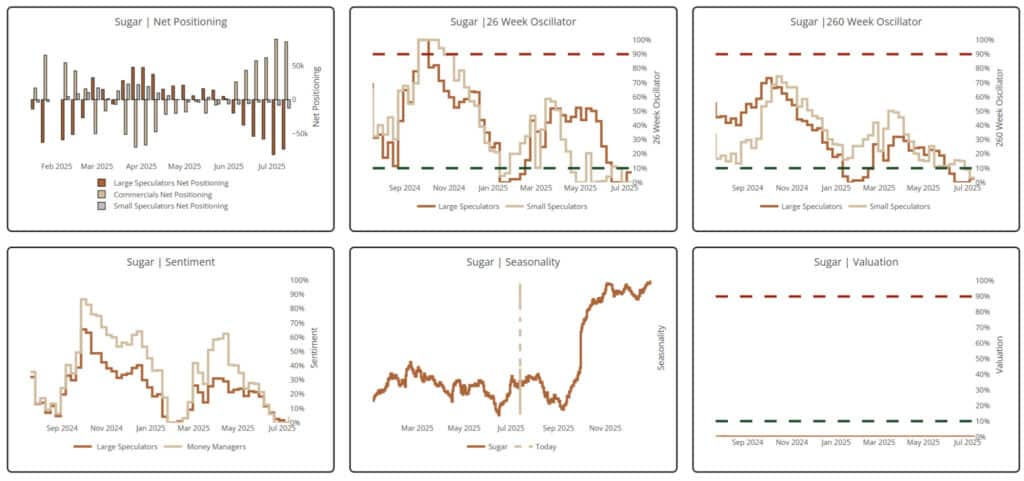
The technical setup is neutral, so I’d size small.
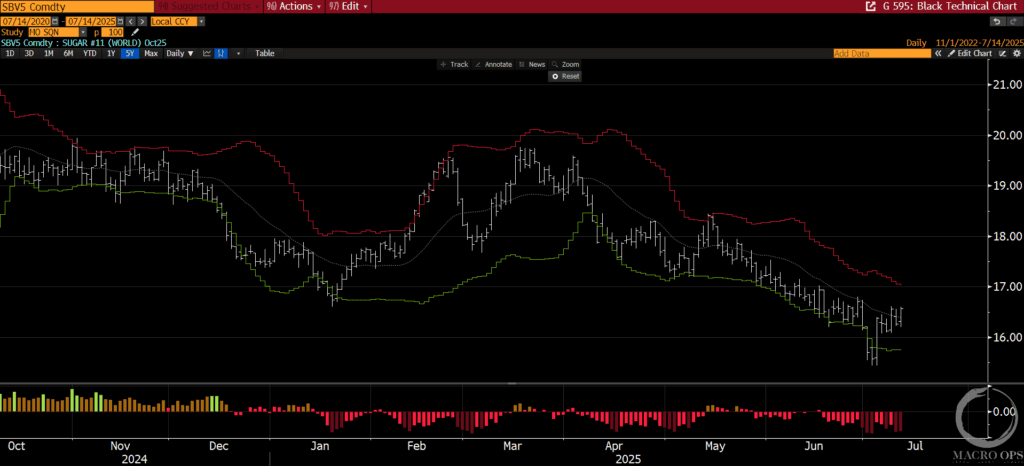
We have a V-bottom reversal off its daily and weekly lower band. It’s in a Bear Volatile regime, which is where bottoms occur. And there’s good odds that Trump will slap 70% tariffs on a major sugar-producing country, just to spite the leader for not respecting his authority.
***The MO port is up +27% ytd, and we’re not seeing a shortage of great opportunities in this market. If you’d like to join me, the MO team, and our Collective of sharp, supportive investors and traders as we navigate these markets, then click the link below. I look forward to seeing you in the group.***
Join The Collective
That’s it for this week.
Until next time, stay frosty and keep your head on a swivel.