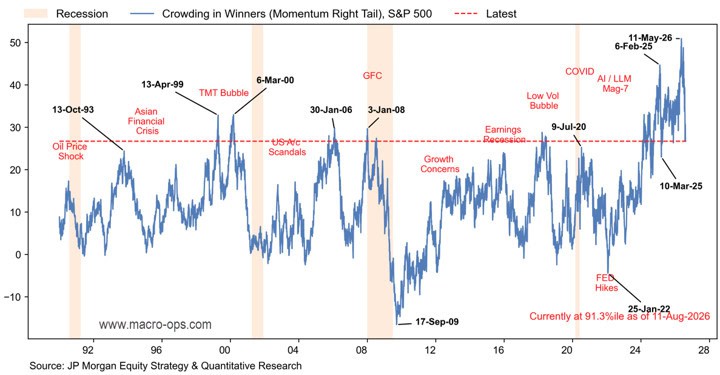
Summary: Same story as last week, the week before that, and the week before that… Path of least resistance for the SPX remains up. Advance/decline lines keep leading the charge higher (not bearish). Most internals confirm — except credit, which has a longer lead. Buybacks and earnings keep the bid coming. Short-term positioning and sentiment are still a ways from frothy, though longer-term measures show crowding. SPX flipped into a Bull Volatile SQN regime last week. These regimes produce some of the fastest rallies — and the bigger tops.
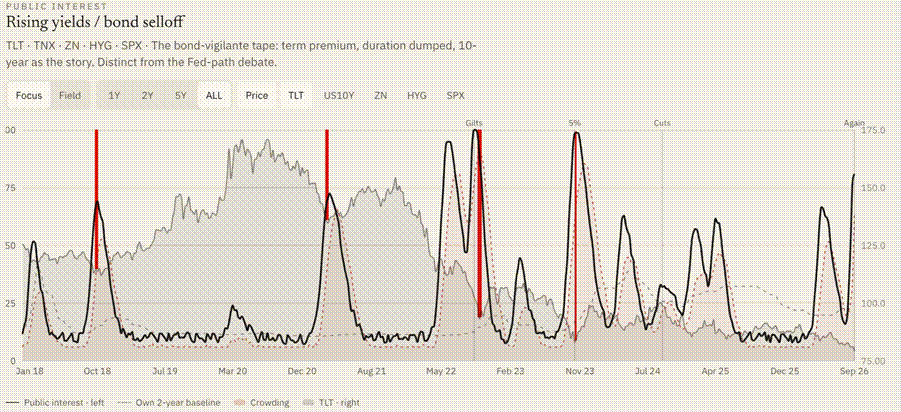
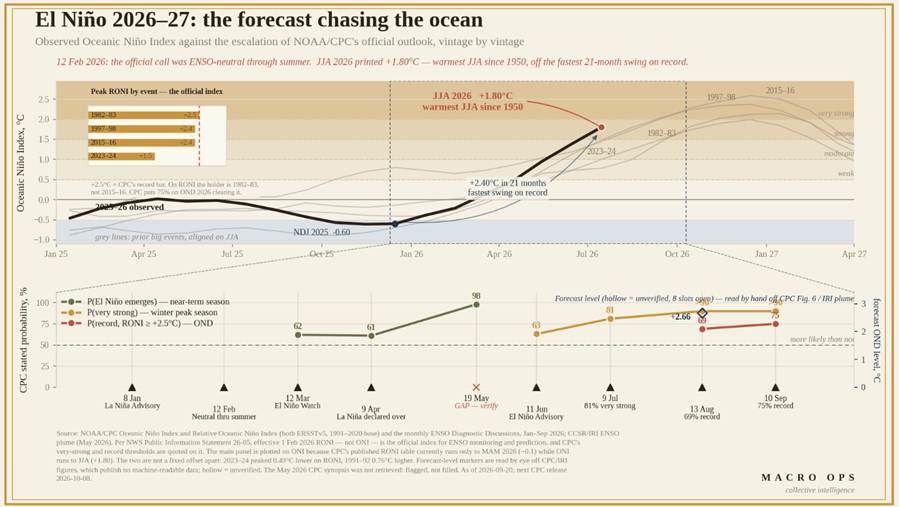
Long bonds are dancing on a significant level. Momentum’s cheap now (relatively) and looks to have put in a durable low. This El Nino is shaping up to be a once-in-200-year+ weather event, and the market isn’t pricing it right. We look at a few Ags as a way to play it. Then we close with a bonus chart on gold miners showing a 100% 6-month hit rate, plus more.
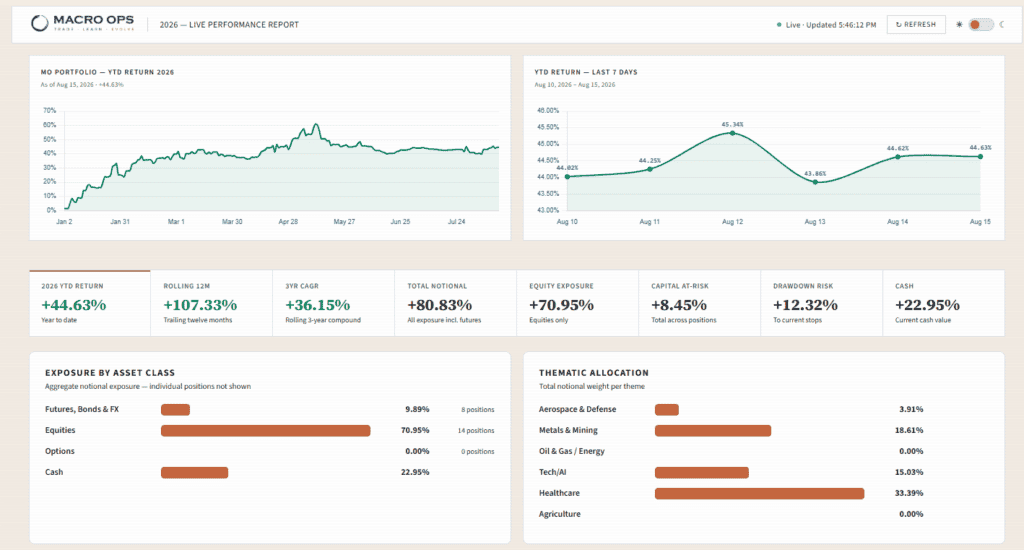
***The MO port is currently up +44.6% ytd in 26’. The Collective is where we discuss the theory behind the positioning, publish the differentiated research, track the book in real time, and argue it out with a global group of serious investors. If that’s your kind of room, join us in Slack. ***
MO Portfolio & Trades
1. The portfolio rose +147 basis points last week, leaving us +44.63% on the year, below our ytd high-water mark of +61%. We’re long PMs, EUR and MXN, short long bonds, short dow, long ETH and short BTC, long tech, semis, robotics, biotech, and defense.
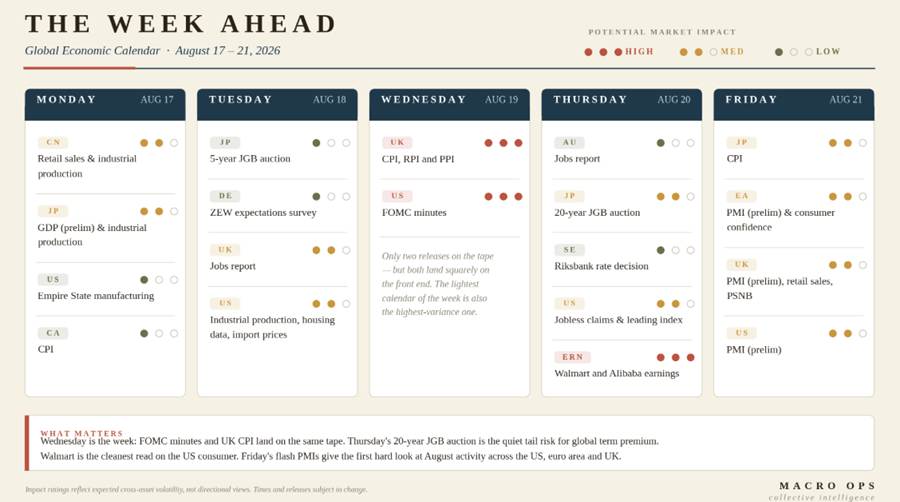
2. The week ahead in data: quiet until Jackson Hole.
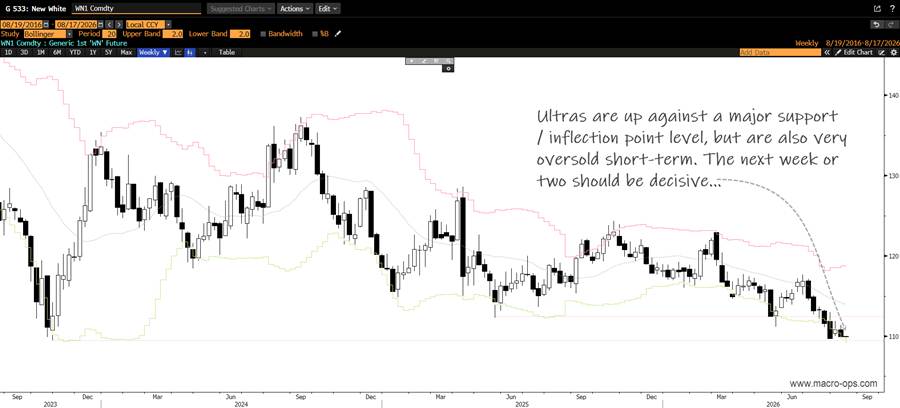
3. Ultras are dancing on their ’23 swing low. Next week or two should tell us if this breakout holds. We’re short, waiting on further confirmation to add.
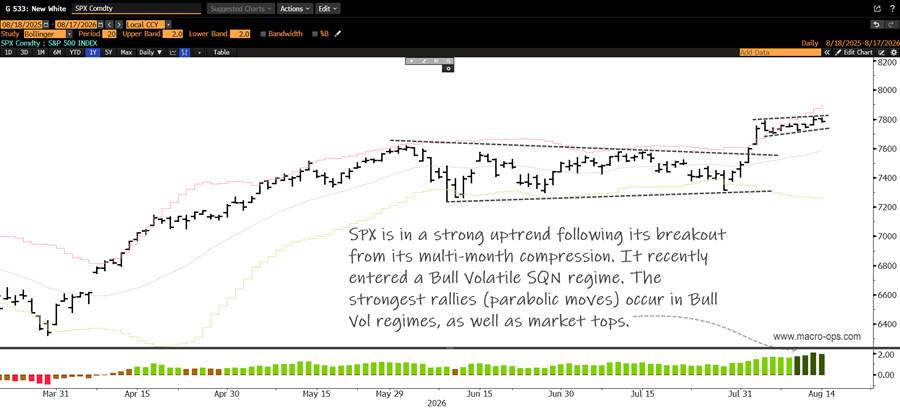
4. SPX is in a strong uptrend off its compression breakout. Flipped into a Bull Volatile SQN regime last week — these produce some of the sharpest rallies, and some of the bigger tops. Stay on your toes.
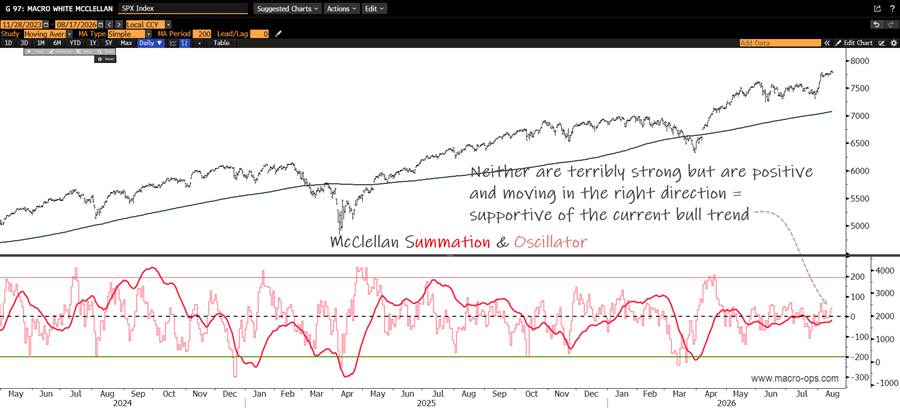
5. Our preferred short-term breadth measure, the McClellan Summation Index and Oscillator, isn’t blowing the doors off, but it’s positive and moving the right direction. For now.
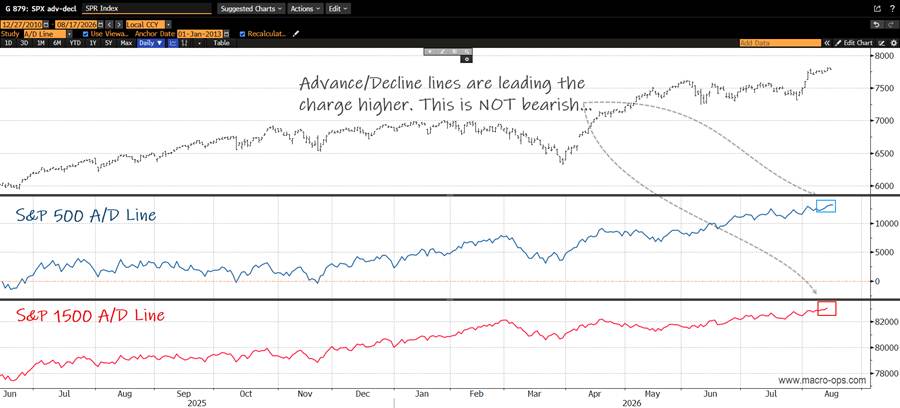
6. S&P 500 / 1500 advance-decline lines keep leading price. This is not bearish.
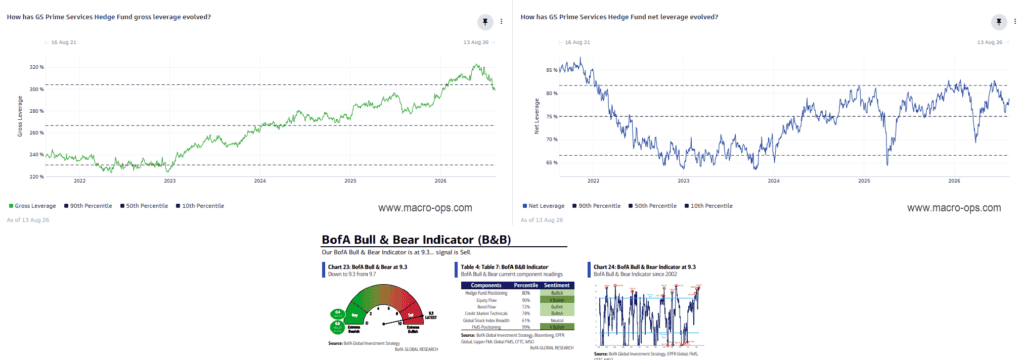
7. From GS: “Overall book Gross leverage -0.2 pts to 299.5% (44th percentile 1-year) and Net leverage +0.7 pts to 78.2% (45th percentile 1-year). Overall book L/S ratio +0.6% to 1.707 (45th percentile 1-year).”
Short-term positioning and sentiment still support risk assets. Longer-term measures — BofA Bull-Bear below, NYSE Margin YoY — show froth.
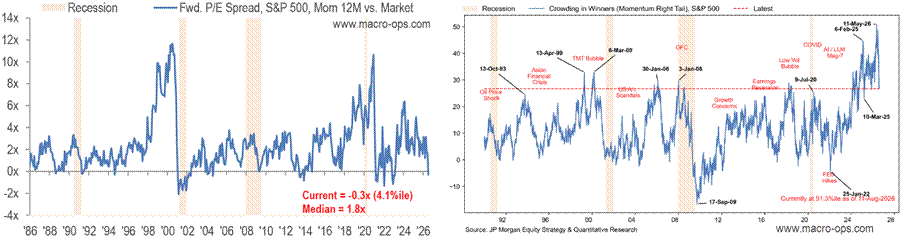
8. Momentum’s come off its historically crowded levels — still elevated, though — while relative valuation has fallen to the 4th %tile. Same picture as positioning: short-term bullish on momentum and risk assets, but the intermediate-term and out keeps getting tougher.
What to do?
Keep it tactical. Read: nimble and light.
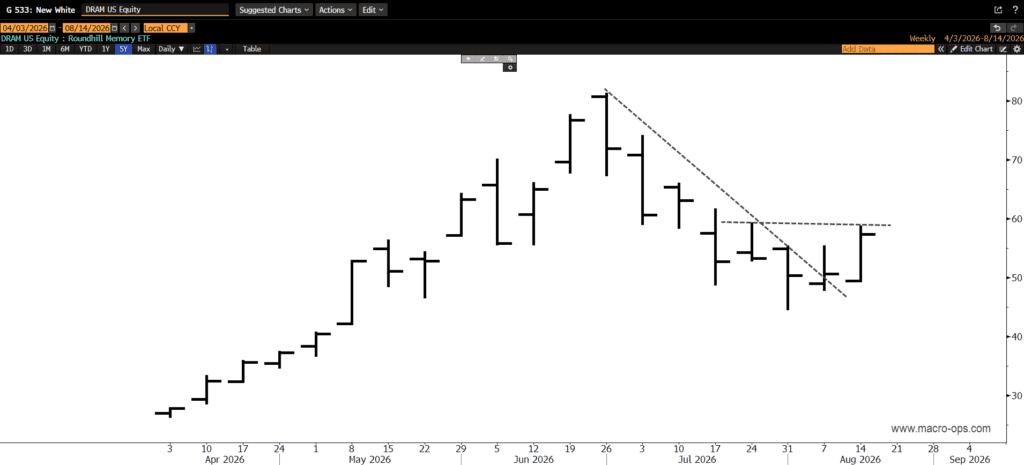
9. Memory ETF DRAM looks to have put in a durable bottom. We’ve got a small long and will add above this recent horizontal level. Tactical position, nothing more.
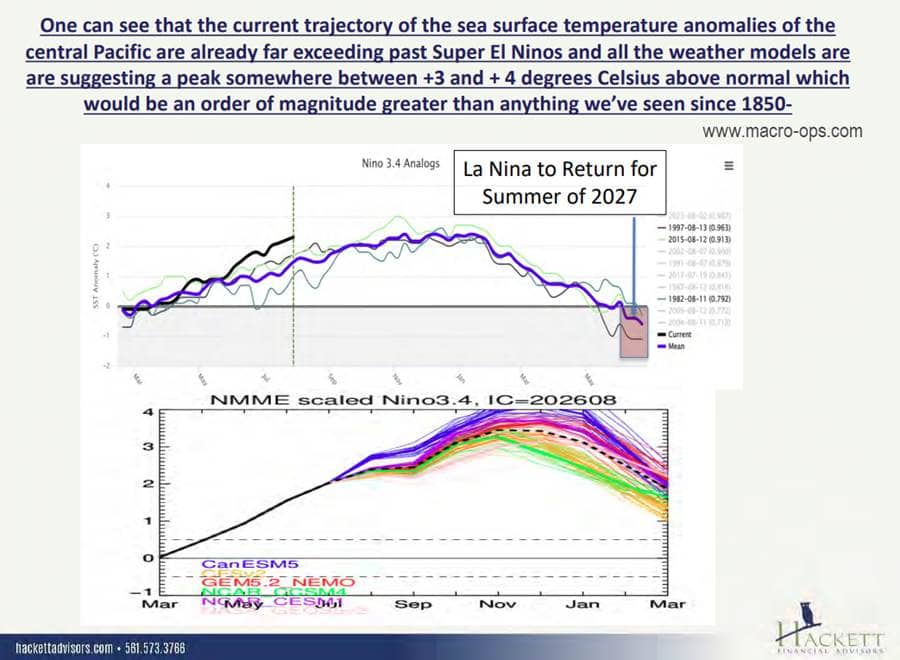
10. Historically, I’ve been dismissive of grave weather warnings and their market impact. That’s served me well — most of the time it’s just doomers talking their book. But we’ve got a genuinely no-BS meteorologist in the Collective, Steve, and hyperbole isn’t his style. So when he posted in Slack that “Latest observations and models have have gone bonkers – now forecast to be the strongest EL-Nino in 200 years,” my ears perked up.
If you’re not caught up on what’s coming weather-wise and what it means for markets, here’s a recent video presentation from Hacket, plus the slide deck.
I’ll be interviewing Steve later today and sharing my notes with the Collective.
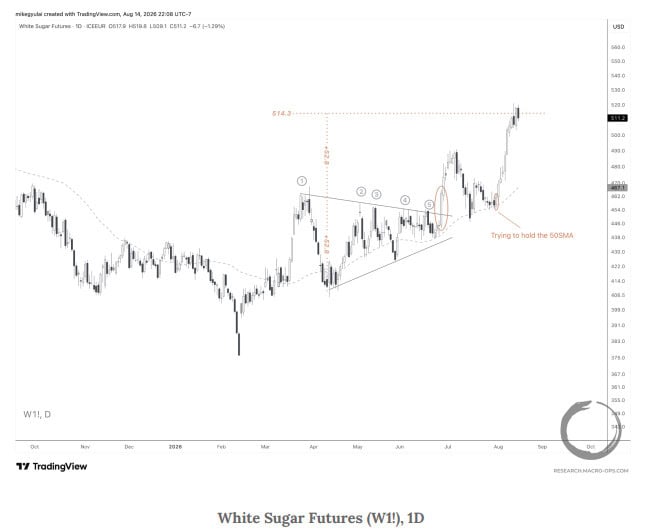
11. Sugar looks like one of the markets most poised to benefit from this multi-generational weather event. Mike G called the setup in his latest weekly (link here): “In the August 1, 2026, issue, we highlighted White Sugar futures’ retest of the 50-DMA. This week, price hit the 3-month symmetrical triangle’s 1x measured move target at 514.3.”
We’ll be buying on any pullbacks.
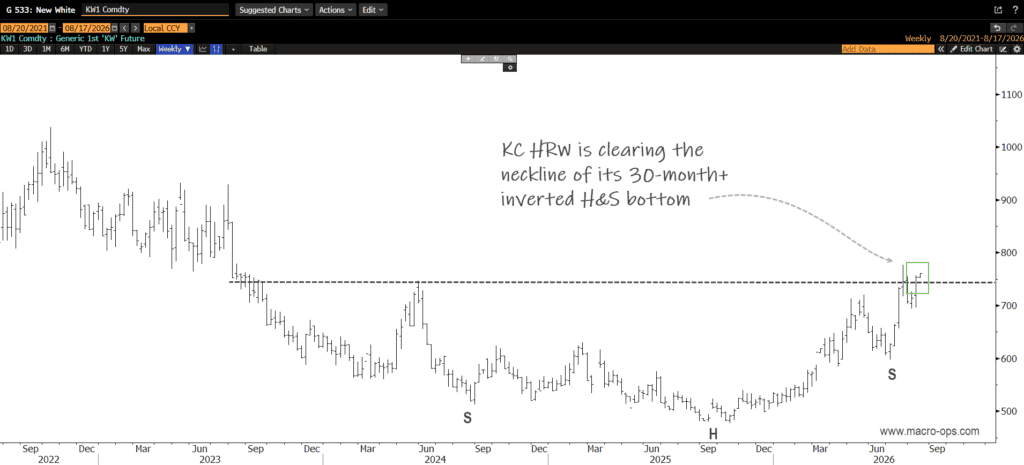
12. Maybe it’s the unending war, the SoH that keeps not opening, DM fiscal largesse, or now El Nino — but Ags and commodities broadly have great long-term charts. Here’s the setup in KC hard wheat: price breaking out of a multi-year inverted H&S bottom.
Also, the BCOM Index (BCI etf) is bull flagging on the monthly. May be time to get long for the second leg up.
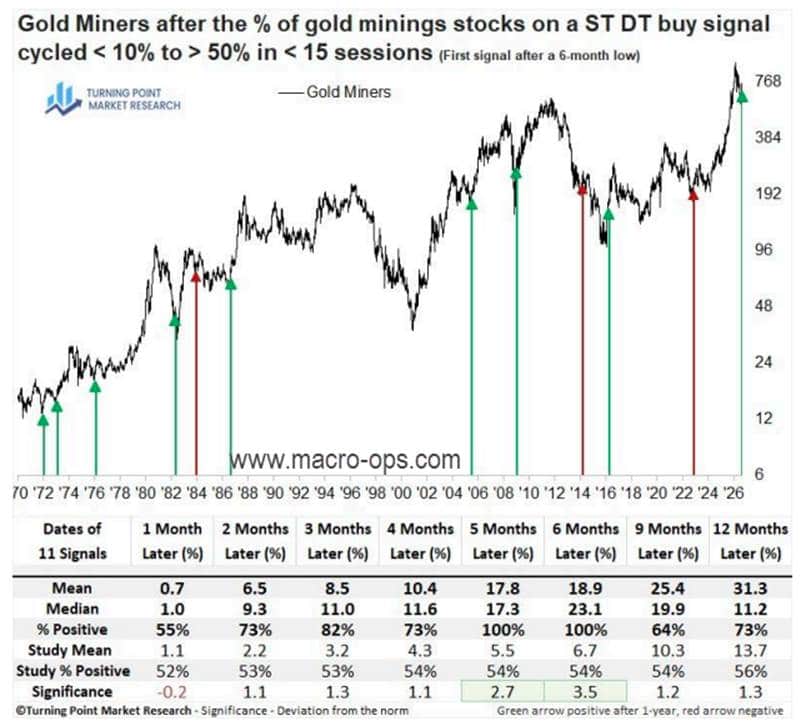
13. Bonus chart from our new teammate Dean Christians of TPMR. I’m no stats guy, but a 100% hit rate on miners, 6 months out — that’s bullish, no?
Thanks for reading.