To be an active investor, you must believe in inefficiency and efficiency. You need inefficiency to get opportunities and efficiency for those opportunities to turn into returns. ~ Michael Mauboussin
A limited amount of alpha exists out there in the trading universe. And these excess returns come from errors, missteps, and knee-jerk reactions from the market collective.
I like to think of active trading as a large poker game. Each day before the bell, traders from all over the globe take their chip stack to the exchange and bet on the returns for the day. The ones who were correct on that given day receive money from those who weren’t.
Just like in poker, luck determines performance over the short-term, but over the long-haul after many iterations and trades, those with skill over the others — those with an edge — come out ahead. These winners earn alpha at the expense of other less skilled market participants. Succeeding in trading requires a clear understanding of edge.
In order for one trader to have an edge over the market, a market inefficiency must exist. Trading Great Ed Thorp said:
There is a market inefficiency if there is a participant who can generate excess risk-adjusted returns that can be logically explained in a way that is difficult to rebut.
Generally the more liquid the market, the less inefficient. If you’re into macro trading like us, you’re playing one of the hardest games out there. Full dedication to the craft is merely table stakes for macro traders.
Now here comes the million dollar question, how do we create a trading edge?
In his latest research paper “Who Is On The Other Side?” Michael Mauboussin, one of the world’s leading thinkers on market game theory, organizes available market edges into 4 different categories using the acronym BAIT. I’ll break them down one by one from here.
The B in Mauboussin’s acronym stands for Behavioral.
Behavioral edges come from a trader exercising superior emotional control over the market collective. These edges are extremely robust since from the dawn of markets, the herd’s emotional response to price movements has largely remained the same.
How can a macro trader effectively take advantage of behavioral inefficiencies?
This requires a careful examination of market sentiment.
This is because once the crowd has fully committed to one side — there is only one way to go, the opposite way. Mauboussin explains this concept in further detail (emphasis mine):
For a crowd to be wise, the members need to have heterogeneous views. To be more formal, consider the diversity prediction theorem, which says that given a crowd of predictive models, the collective error equals the average individual error minus the prediction diversity. You can think of “collective error” as the wisdom of the crowd, “average individual error” as smarts, and “prediction diversity” as the difference among predictive models. In markets, price veers from value when investors come to believe the same thing, or act as if they do. In other words, when investors lose diversity markets lose efficiency.
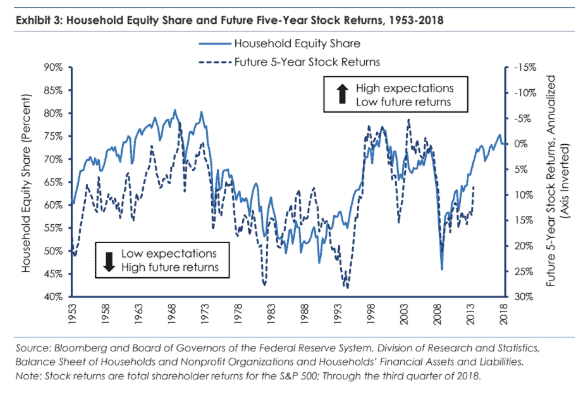
Once the market collective all agrees on a single outcome price has nowhere left to trend. “Greater fools” have all run out and there is literally no one else available to buy (or sell). To correct this market inefficiency, the price will snap back in the opposite direction. The graph below shows just how well expectations of the crowd line up with future returns. The higher the expectations the lower the future returns of equities.
We saw this play out recently in the S&P last 2018. Take a look at the graph below which shows AAII Bull-Bear Sentiment plotted alongside the SPX index.
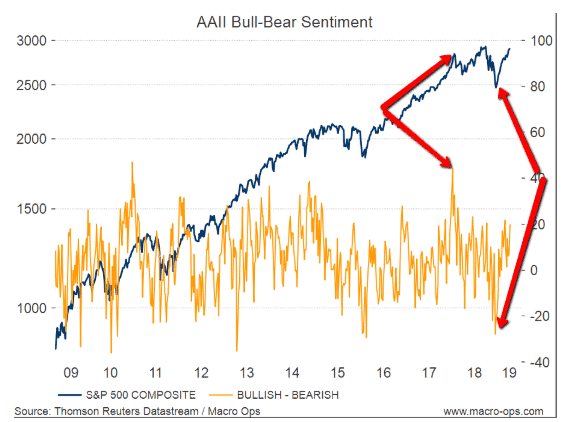
Bullish sentiment peaked at the beginning of 2018 right before the volatility blow up. Later that same year, the market sold so hard into Christmas that bearish sentiment reached extreme (read: consensus) levels. Alex wrote about that at the time here and here.
When there was “no one left to buy” in Jan 2018, the market reversed and fell sharply. When there was “no one left to sell” in December 2018 the market turned around and embarked on an enormous rally.
Sentiment drives a significant amount of macro price action. Some traders can make money focusing on sentiment alone. It’s that powerful.
Sentiment indicators are not a panacea though. A bubble can continue growing in size and the sentiment indicator can go off the charts with it. That’s why it’s best practice to always pair price action with every type of trading edge. It keeps you from buying falling knives or selling into face ripping rallies too early.
The A in Mauboussin’s acronym stands for Analytical.
Analytical edges are created by processing publicly available information more effectively than other market participants.
Weighting information differently, updating your views more effectively or anticipating a change in the market’s narrative quicker than the majority are all examples of how one can create an analytical edge.
People incorrectly weight information due to confirmation bias and recency bias. It’s natural for traders to look for confirming evidence to back up a trade of their interest. Do the opposite to gain an analytical edge. Read the other side’s argument to red team your own trade idea.
Also, it’s easy to fall down the trap of looking at the most recent information and assuming it holds more weight going forward than other conflicting information. Just because an asset has been going up recently doesn’t mean that trend will continue. Analytical edges are created by looking at the entire picture without overweighting information from a particular time window.
Maintaining an analytical edge doesn’t end at trade entry. New information is constantly flowing in, and incorporating that into a trading view is important. Updating beliefs based on new information is called Bayesian analysis. When new data is released, price action evolves, sentiment changes, and the narrative morphs. Take these things into account.
It’s good practice to have predetermined time intervals where you check in to see if your trade thesis has strengthened or weakened. If things have changed its possible to increase your analytical edge by tweaking position size.
Finally, to stretch an analytical edge as far as possible, take a step back from the hard data and look at the market narrative.
Machines can analyze simple data sets extremely well, but they aren’t so great at evaluating market narratives. And at the end of the day, it’s the stories we tell ourselves that drive price.
The I in Mauboussin’s acronym stands for Informational.
Informational edge is one of the more obvious edges. If you knew what Apple earnings were before the market it wouldn’t be that hard to place bets the day of the earnings announcement and instantly pocket a nice chunk of change.
But technology and regulation, in particular, have mainly zeroed out this edge.
Jesse Livermore made a killing by reading the tape because price action data wasn’t widely available and not many people knew how to get it. These days everyone has that data and knows how to read a chart. Fundamental information has undergone a similar transformation. Everyone is a simple google search away from finding the key metrics to gauge a company’s health.
Government has made sure that all of this data is released in a fair and orderly manner to all market participants. Gone are the days where connected and high powered individuals could access company news before the public.
Now the new rage is alternative data. Things like satellite imagery of retail parking lots and oil tankers. Soon this information will lose its efficacy as well.
Information edge is a STRONG edge but it does not last and you need a large technical infrastructure in place to capitalize on it. Any individual or small trader is best served working on the other acronyms in BAIT. Leave the informational edges to the quant firms packed with Ph.D. data scientists.
The T in Mauboussin’s acronym stands for Technical.
Technical inefficiencies describe instances where other market participants are forced to transact in direct contradiction to their own forecast. For example, a trader sells a crashing stock even though he believes it will end up higher from the market price in 3 months time.
Common reasons for these forced transactions include laws, margin calls, fund redemptions, fund inflows, and other regulations. Technical edges often coincide with extreme market stress and they don’t last long.
In A Man For All Markets, trading wizard Ed Thorp describes how he exploited a technical edge during the 1987 stock market crash.
After thinking hard about it overnight I concluded that massive feedback selling by the portfolio insurers was the likely cause of Monday’s price collapse. The next morning S&P futures were trading at 185 to 190 and the corresponding price to buy the S&P itself was 220. This price difference of 30 to 35 was previously unheard of since arbitrageurs like us generally kept the two prices within a point or two of each other. But the institutions had sold massive amounts of futures, and the index itself didn’t fall nearly as far because the terrified arbitrageurs wouldn’t exploit the spread. Normally when futures were trading far enough below the index itself, the arbitrageurs sold short a basket of stocks that closely tracked the index and bought an offsetting position in the cheaper index futures. When the price of the futures and that of the basket of underlying stocks converged, as they do later when the futures contracts settle, the arbitrageur closes out the hedge and captures the original spread as a profit. But on Tuesday, October 20, 1987, many stocks were difficult or impossible to sell short. That was because of the uptick rule.
It specified that, with certain exceptions, short-sale transactions are allowed only at a price higher than the last previous different price (an “uptick”). This rule was supposed to prevent short sellers from deliberately driving down the price of a stock. Seeing an enormous profit potential from capturing the unprecedented spread between the futures and the index, I wanted to sell stocks short and buy index futures to capture the excess spread. The index was selling at 15 percent, or 30 points, over the futures. The potential profit in an arbitrage was 15 percent in a few days. But with prices collapsing, upticks were scarce. What to do?
I figured out a solution. I called our head trader, who as a minor general partner was highly compensated from his share of our fees, and gave him this order: Buy $5 million worth of index futures at whatever the current market price happened to be (about 190), and place orders to sell short at the market, with the index then trading at about 220, not $5 million worth of assorted stocks—which was the optimal amount to best hedge the futures—but $10 million. I chose twice as much stock as I wanted, guessing only about half would actually be shorted because of the scarcity of the required upticks, thus giving me the proper hedge. If substantially more or less stock was sold short, the hedge would not be as good but the 15 percent profit cushion gave us a wide band of protection against loss.
In the end, we did get roughly half our shorts off for a near-optimal hedge. We had about $9 million worth of futures long and $10 million worth of stock short, locking in $1 million profit. If my trader hadn’t wasted so much of the market day refusing to act, we could have done several more rounds and reaped additional millions.
Technical edges can be extremely lucrative but they don’t happen often, so you can’t rely on them for your entire trading process. They should be the icing on the cake.
There you have it Behavioral, Analytical, Informational, and Technical edges. Those are all the possible ways you can make money in the market.
Another thing to keep in mind while searching for edge is that generally the harder you worked for the edge the more robust it will be. Humans have a default mode to seek out the lowest hanging fruit. No one wants to put in extra hours at the office if they can avoid it.
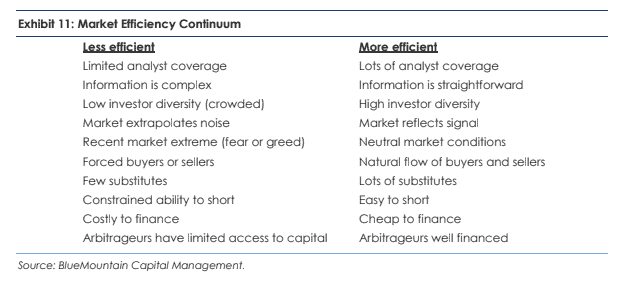
That’s why, as Mauboussin notes in his paper, inefficiency is found in places where few are willing to venture and the information flow is complex.
Finally, before placing a trade think deeply about the question “Who is on the other side?”
If you can’t answer that question in a compelling and concise way, it may mean that you’re playing without an edge and engaged in a game of randomness.
If you want even more market wisdom check out our Lessons From The Trading Greats guide for free by clicking here!


