“When you understand how fear operates in your trading and have conquered it, you will be able to see how fear operates in the market as a whole and then be able to anticipate the group’s reaction to certain kinds of information.” ~ Mark Douglas, “The Disciplined Trader”
In this week’s Dirty Dozen [CHART PACK] we look at small business pessimism, recession like new orders, oil on the ropes with positioning at record lows from hedge funds, plus more…
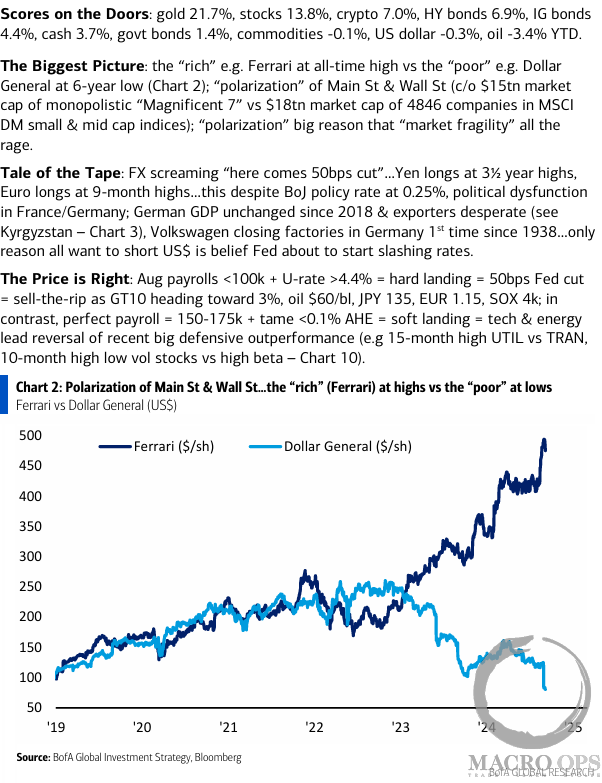
1. We live in an increasingly bifurcated economy where the Haves have much and the Nots, not so much.
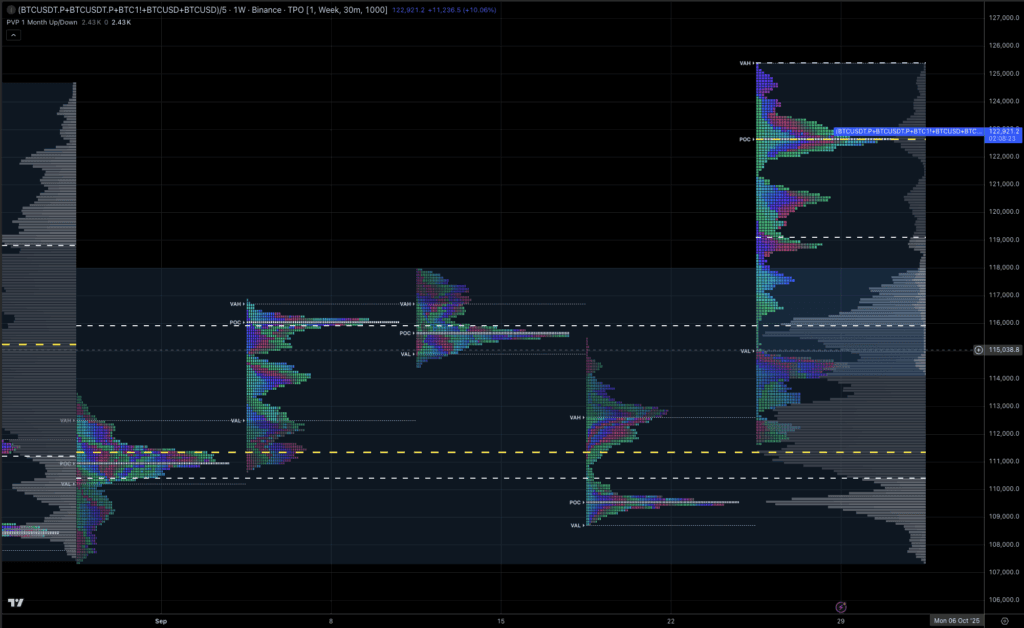
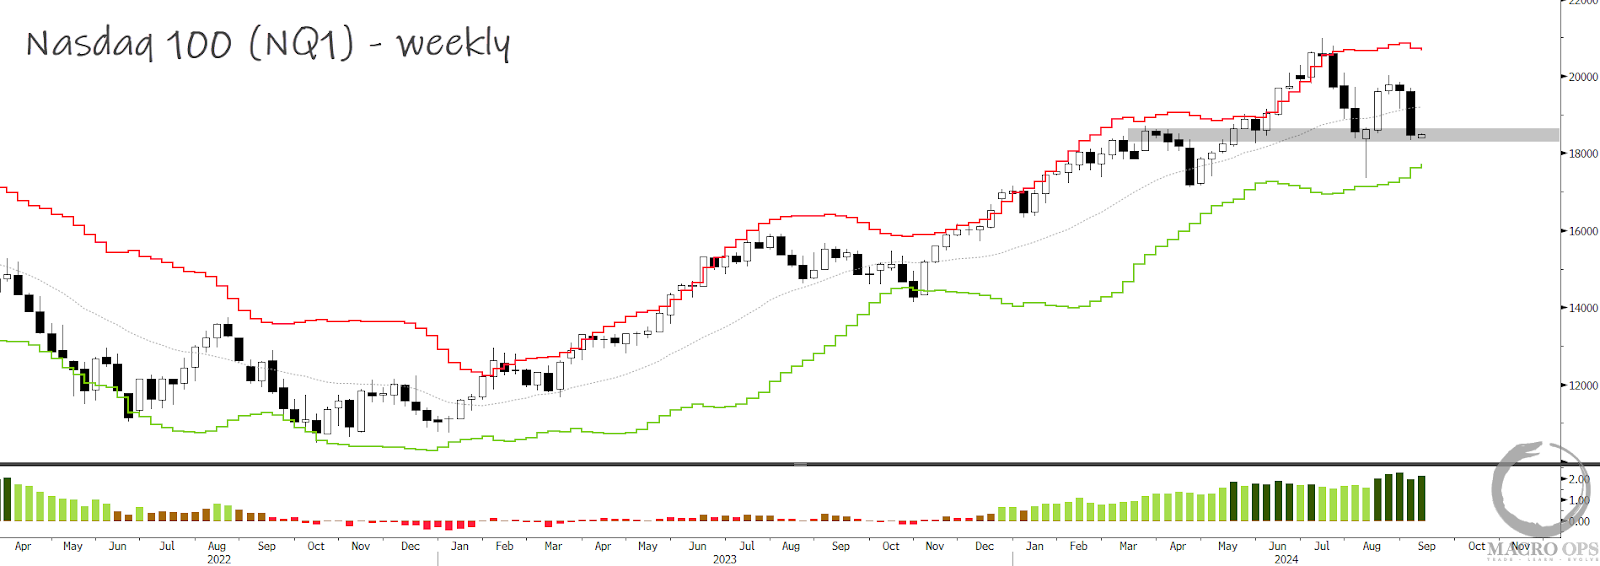
2. The primary trend is still up but short-term signals suggest more chop and vol ahead. It’ll be telling whether Qs hold this level or trade all the way down to their lower weekly band.
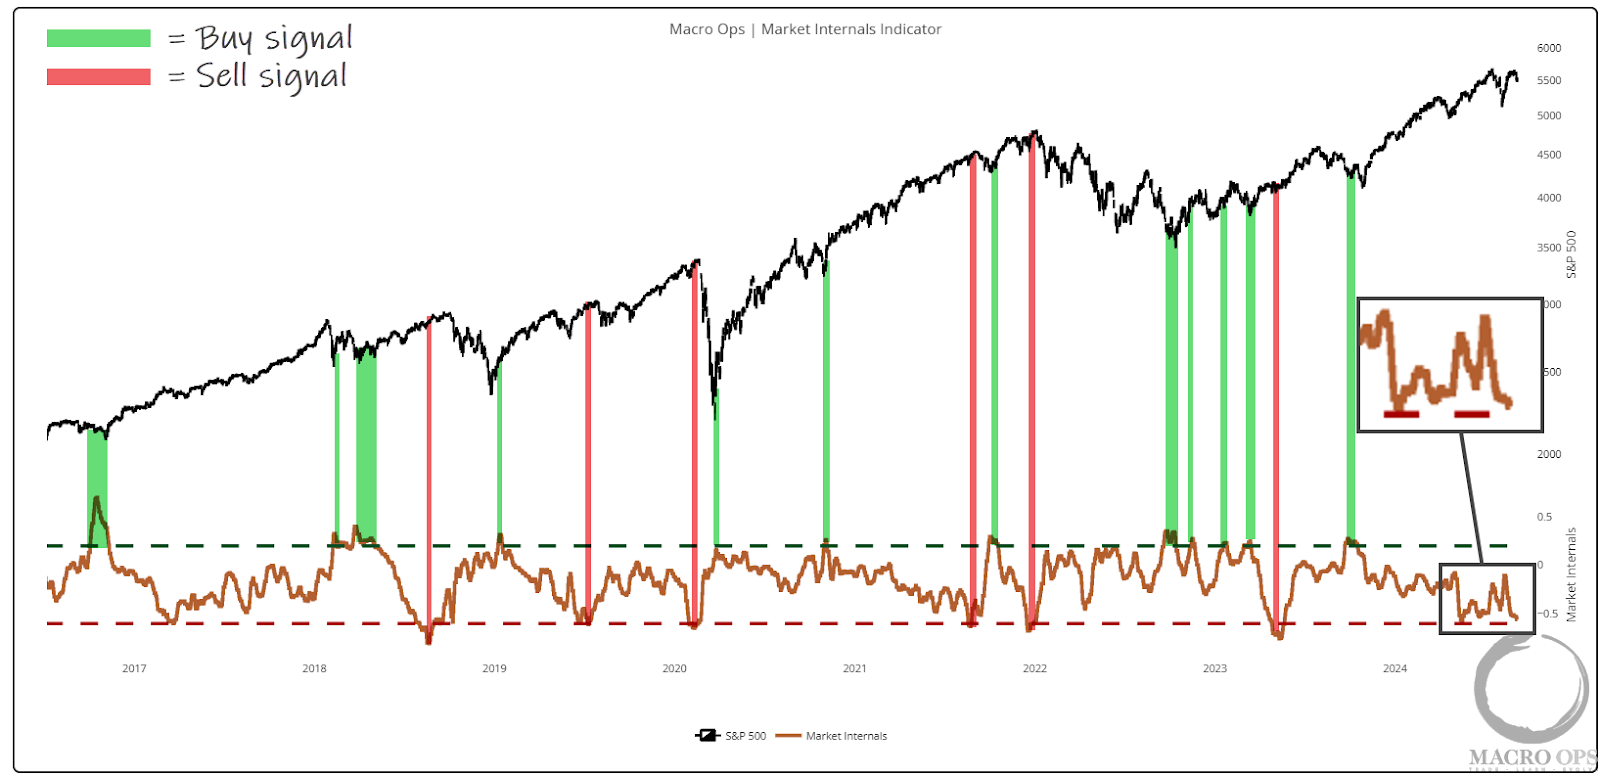
3. Our Internals Aggregator likely triggers a short-term sell signal today or tomorrow. Our key internal groups need to turn around for us to become more actively engaged with the market on the long side again.
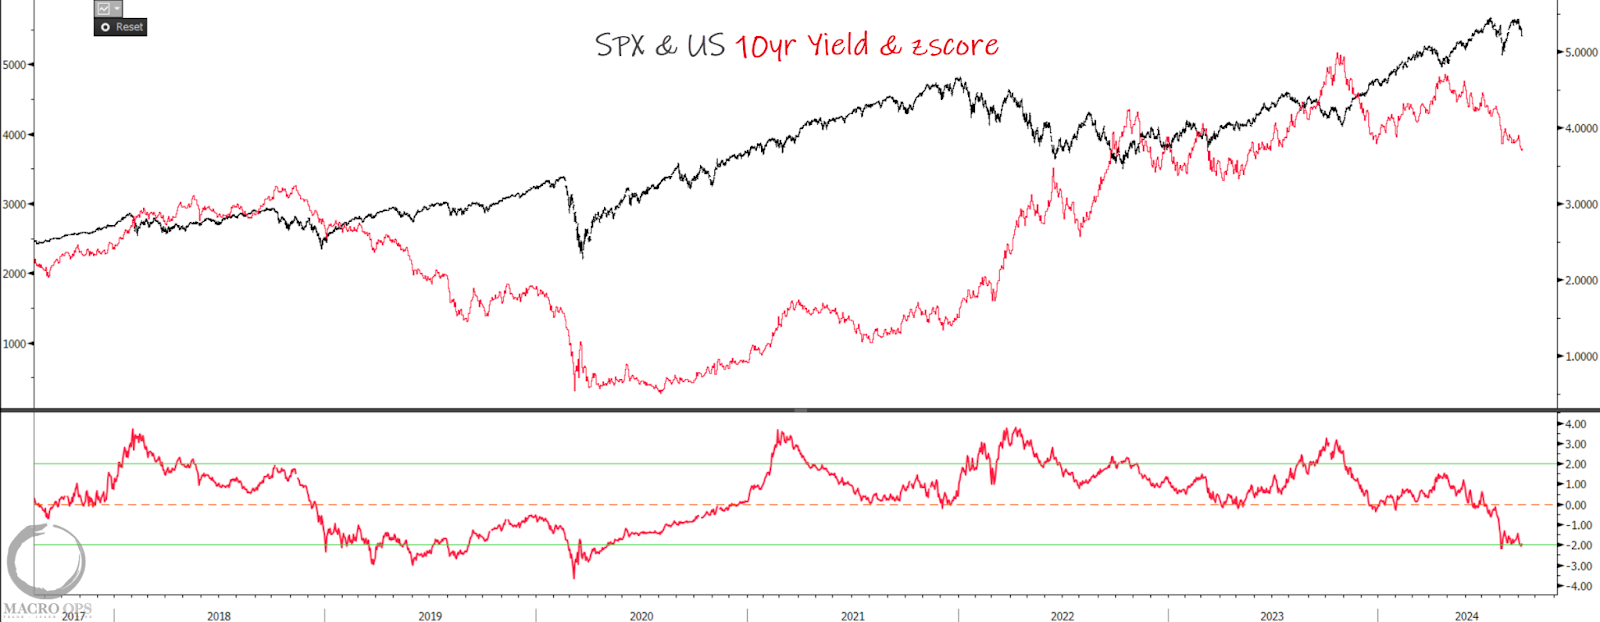
4. But the longer-term setup continues to improve. This chart shows that US10yr yields are now down over 2std. This gives a strong tailwind to equities once they can find their footing again.
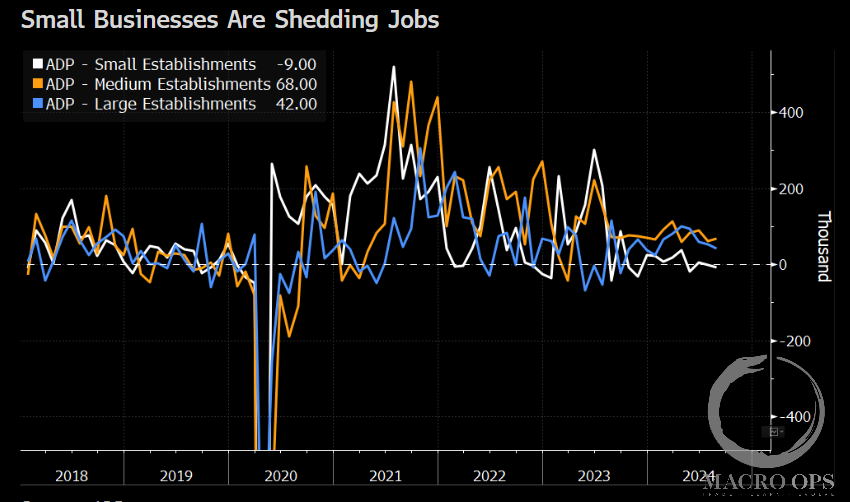
5. We have NFIB small business sentiment coming out this week. BBG writes that “small-business sentiment likely deteriorated slightly in August given that only a net 13% of owners plan to create new jobs in the next three months, according to a separate NFIB survey on employment.”
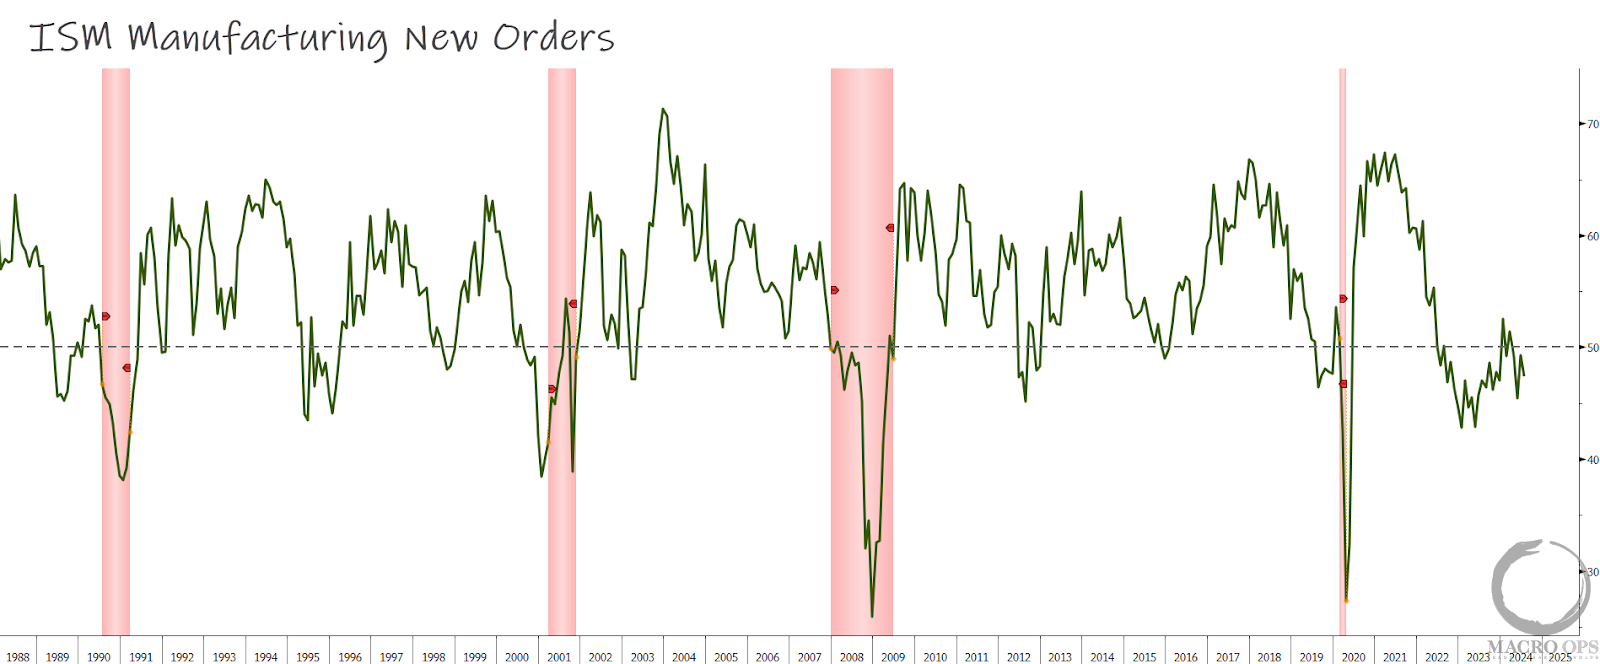
6. ISM New Orders are trading at recessionary levels. The poor readings in 2023 could be explained away as noise due to bullwhip effects from COVID and the goods to services convergence. But it’s difficult to make that same case today. This is now due to restrictive policy. And it means that the Fed is at risk of falling behind the curve should they not go -50bps next week.
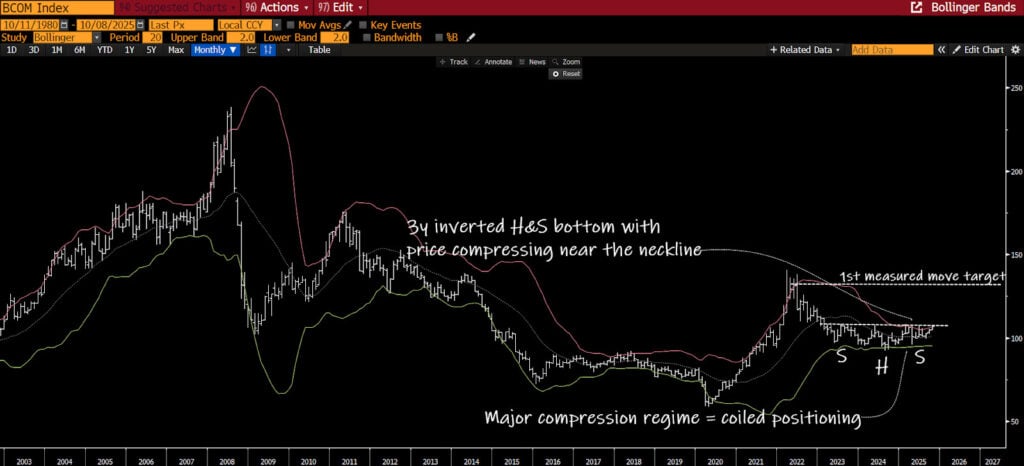
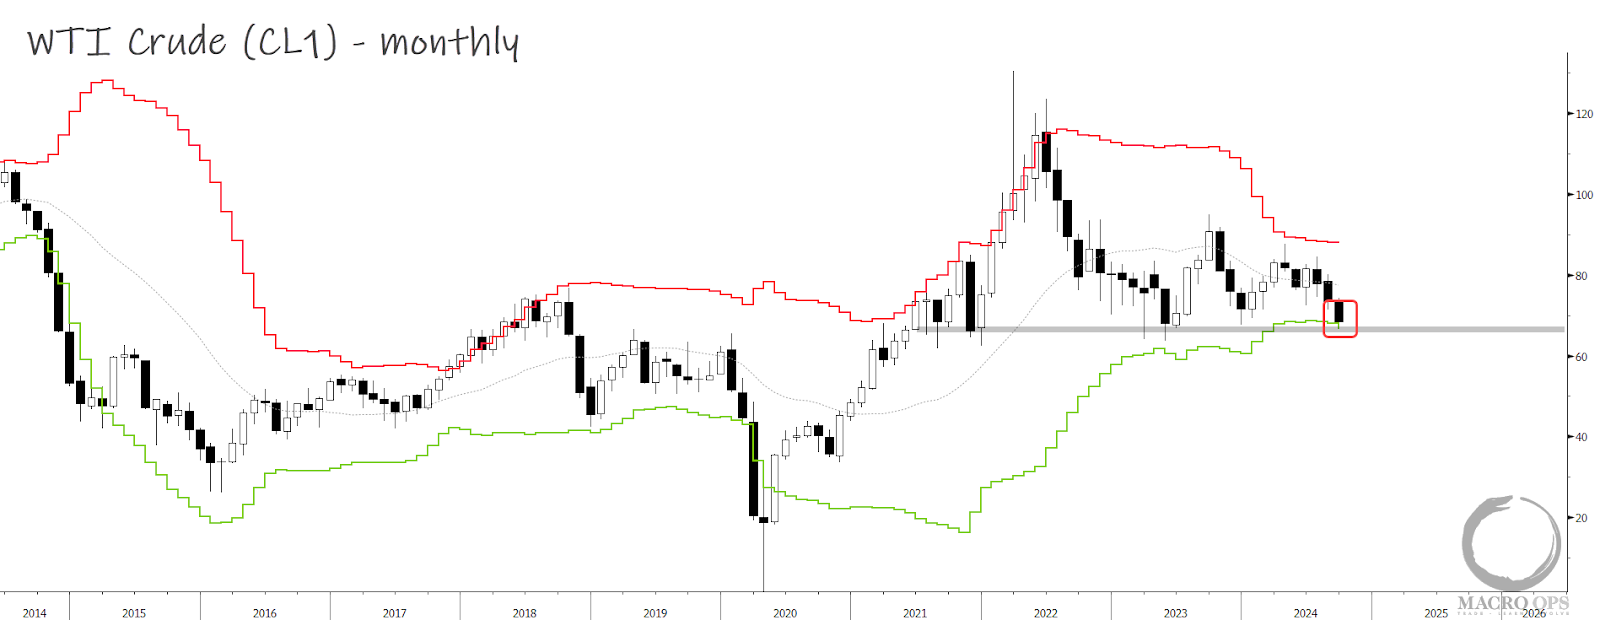
7. WTI crude fell below $70 last week. This monthly chart below shows that it is knocking on key support as well as its lower monthly band.
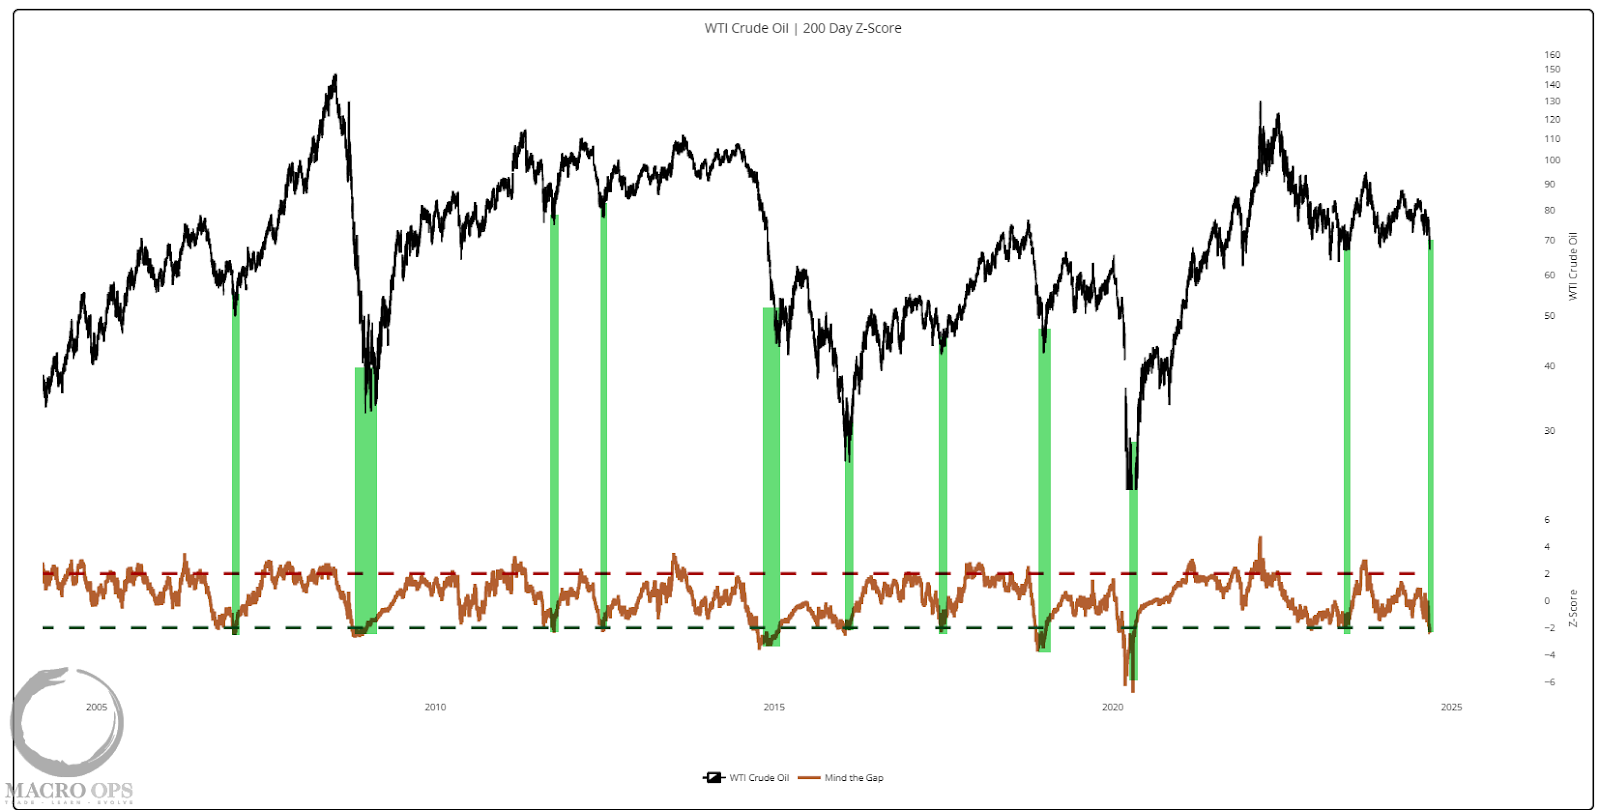
8. Its price to 200dma spread is over -2std oversold. The green highlight marks past instances.
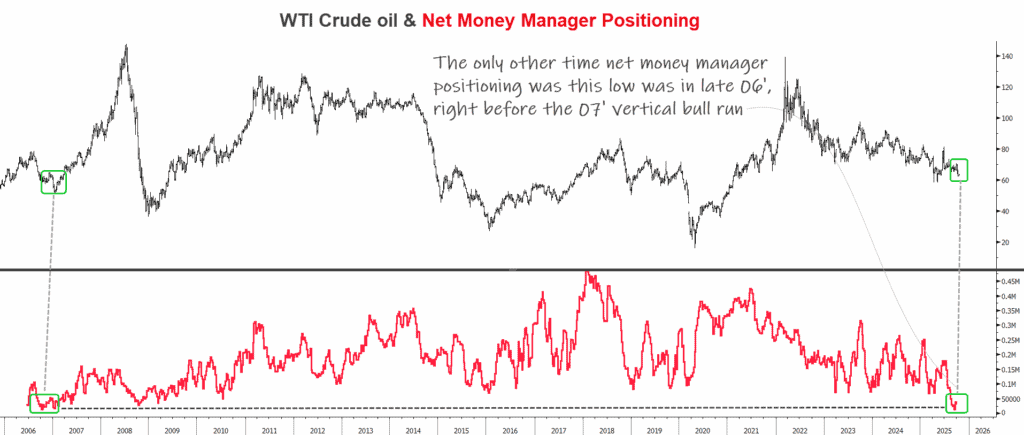
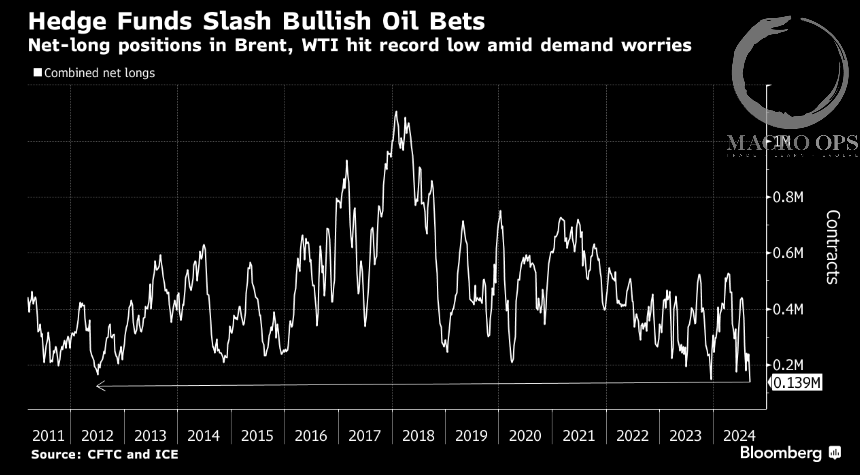
9. At the same time, hedge funds have cut their bullish bets on oil to record lows. Chart below shows net long positioning for both WTI and Brent.
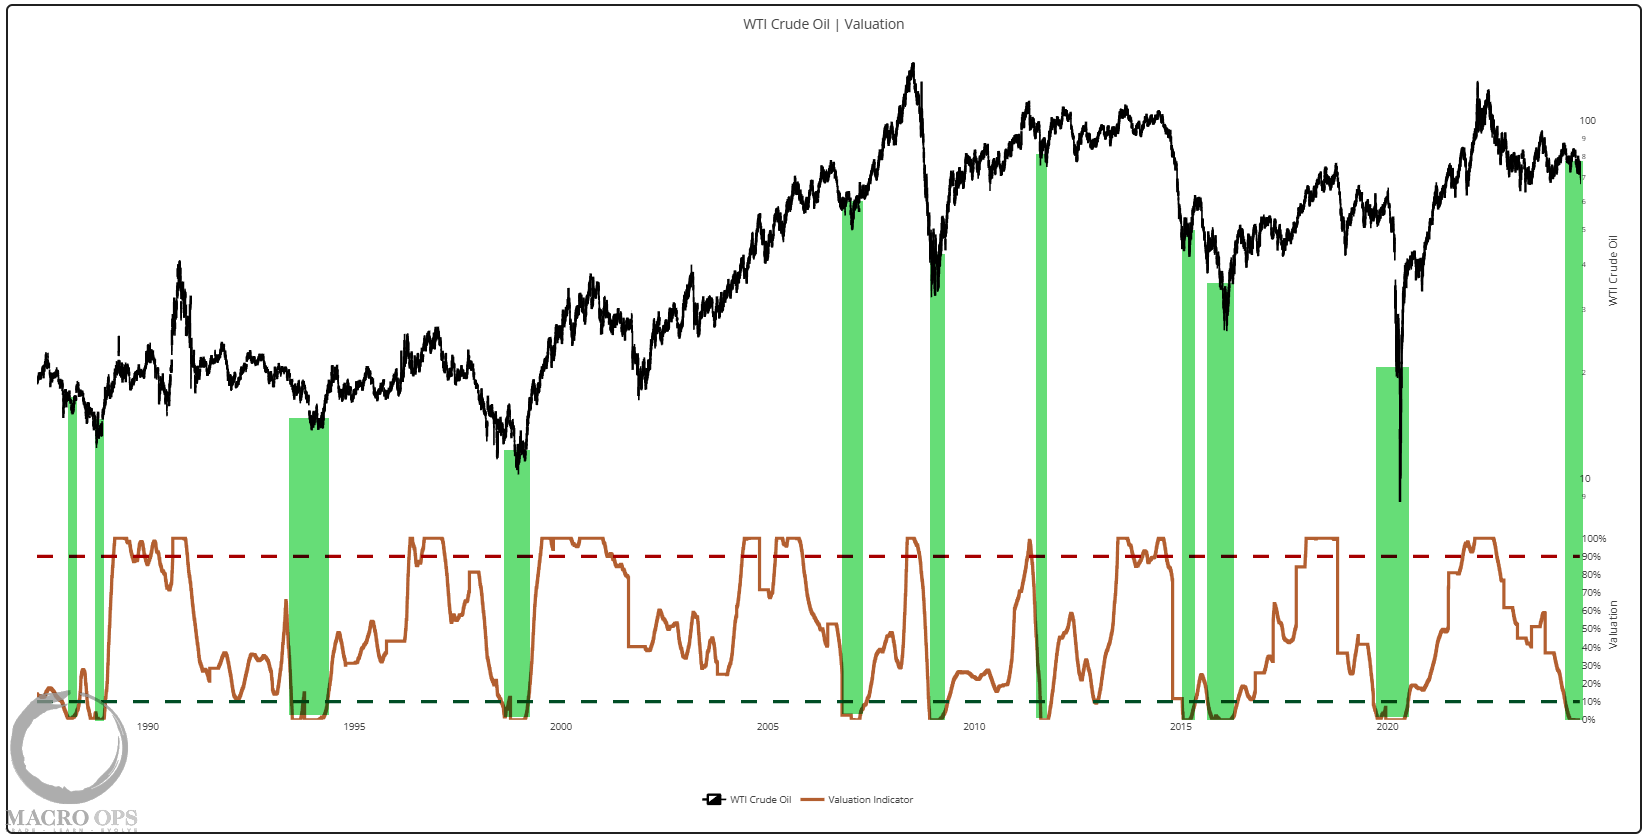
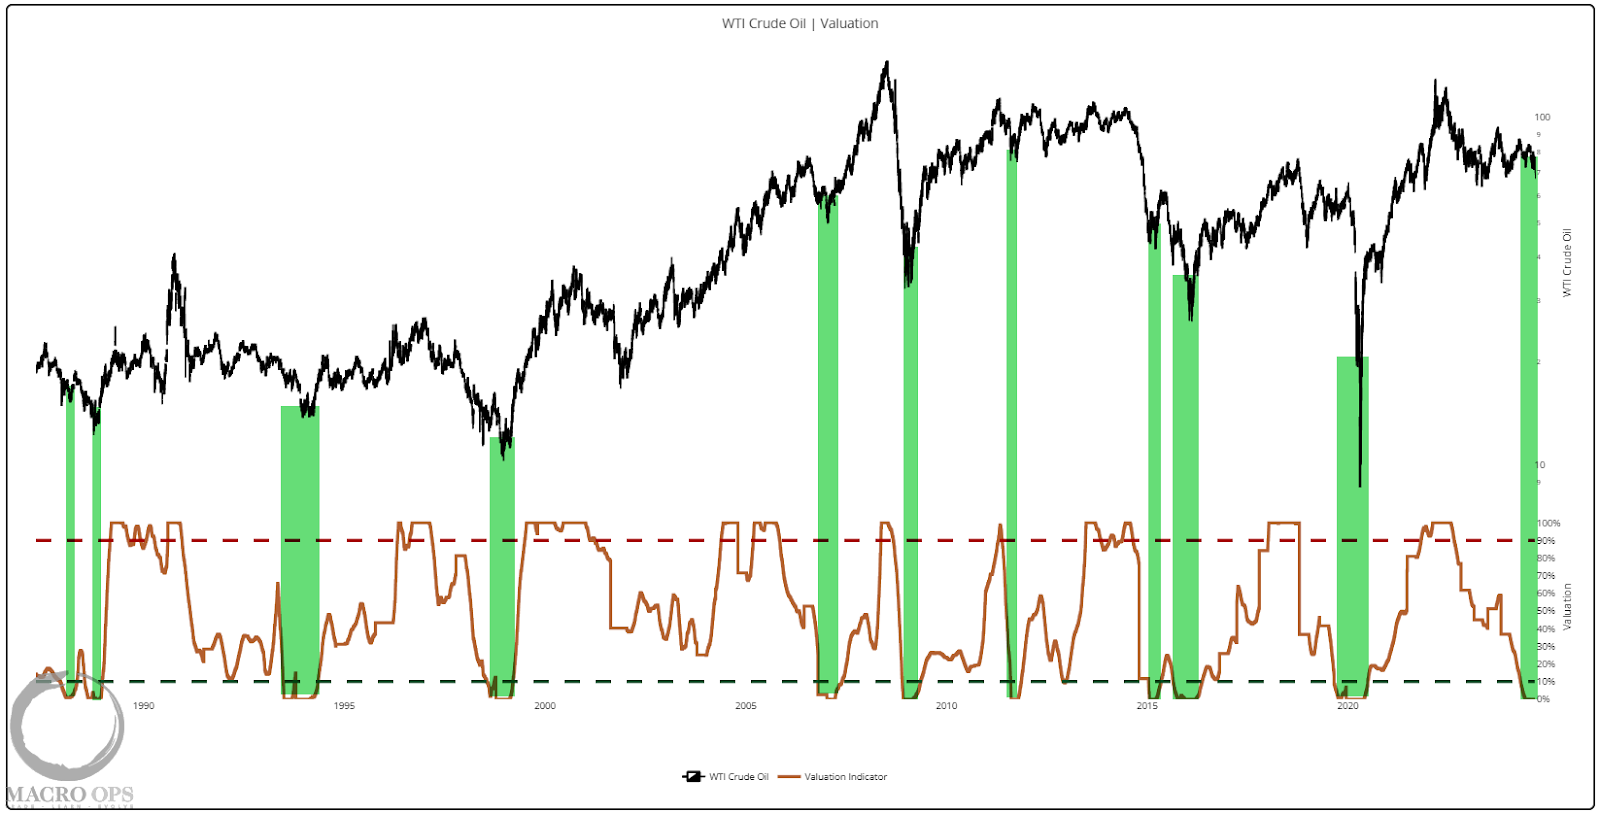
10. And crude’s relative valuation is in the 0th percentile, which typically occurs near major bottoms.
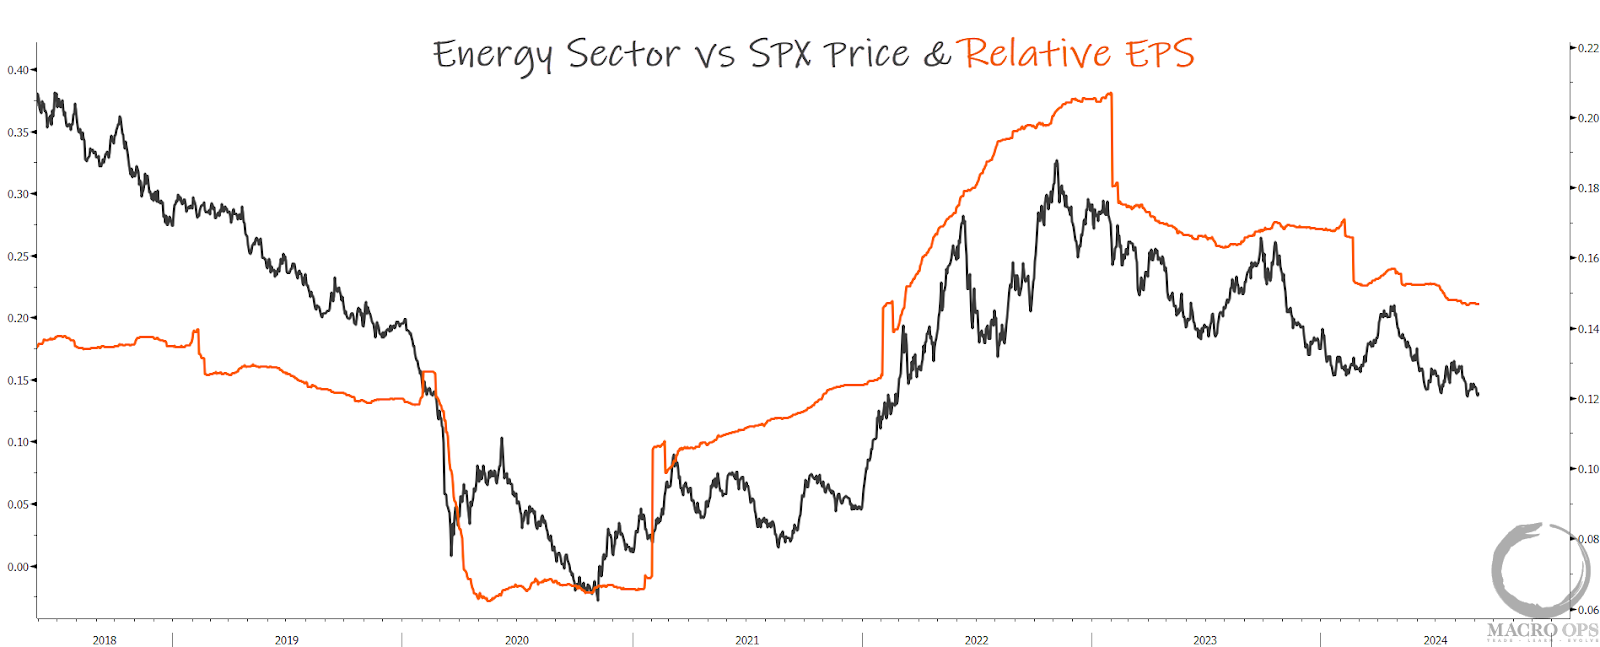
11. We typically see the energy sector’s relative EPS trend turn up when a durable bottom is in, so we’ll be watching this chart closely .
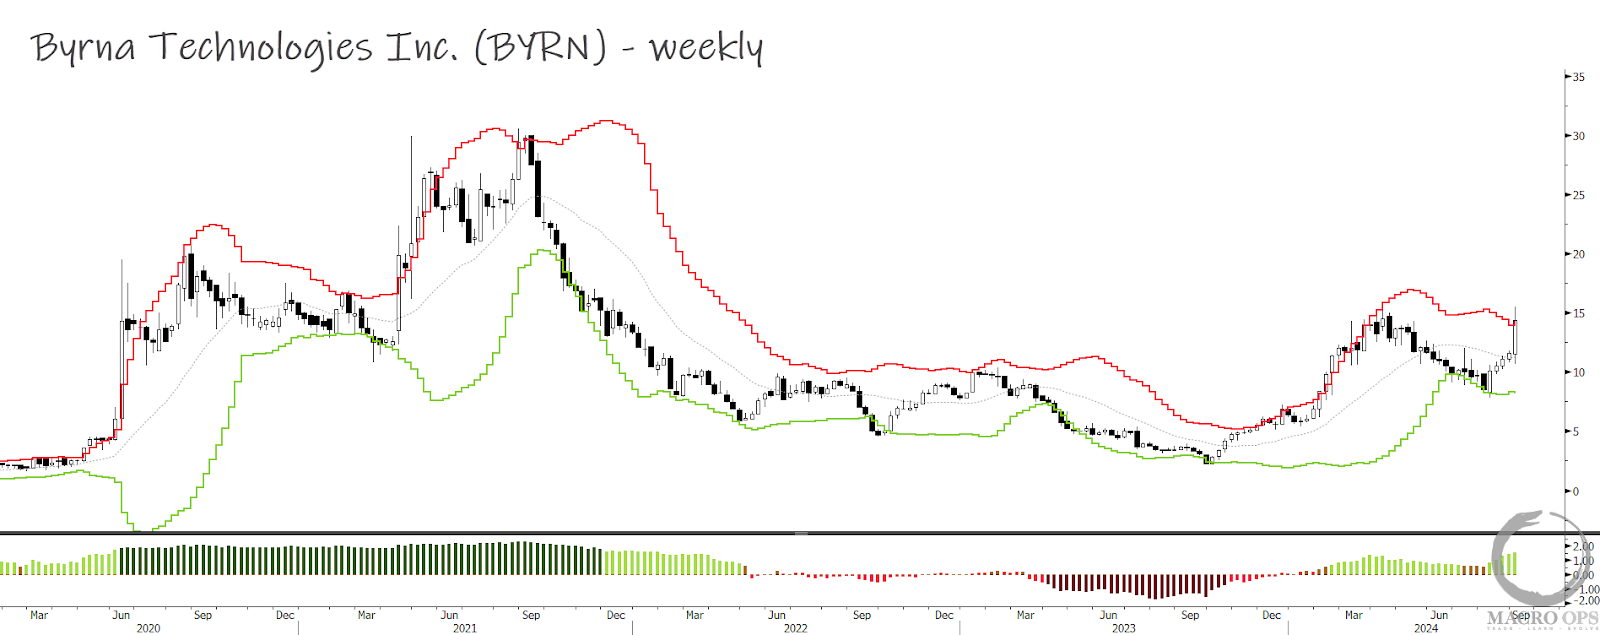
12. One company we’re digging into is Byrna Technologies (BYRN). Here’s a weekly chart below. They make self defense technology with their flagship product being a non-lethal pistol. Here’s a good twitter thread on the stock here.
Thanks for reading.