This is a Necker Cube.
It’s an optical illusion. A simple two-dimensional wire-frame drawing of a cube that was first published by the Swiss crystallographer Louis Necker.
It’s an ambiguous drawing with no visual cues as to its orientation. So it can be interpreted in one of two ways (1) with the lower left square as its front or (2) the front being the square in the upper right.
How the cube looks is ultimately up to one’s perspective.
This decidedly ambiguous rhomboid is apt imagery for today’s macro environment. As we await the much-anticipated jobs report this morning, I thought I’d share a quick stream of consciousness on how I’m orienting to this Necker market and economy.
Let’s start with a short overview of the market.
August put in a large hammer (long lower tail and small upper body). This shows that the bulls remain in control. The market is just off all-time highs. And the long-term trend remains up.
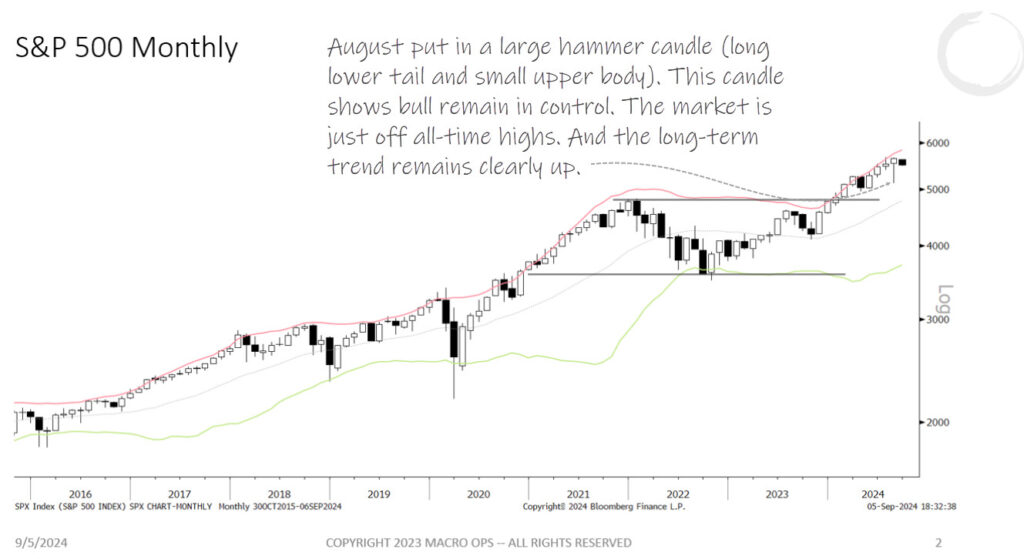
This doesn’t mean we can’t or won’t see selloffs, chop, or volatility. It’s just showing that the trend is up, and trends tend to persist — a trend in motion tends to stay in motion 80% of the time.
Remember, we’re not looking for certainty here or to delude ourselves into thinking we can perfectly divine the future. We care about probabilities and good risk/reward bets. That’s it.
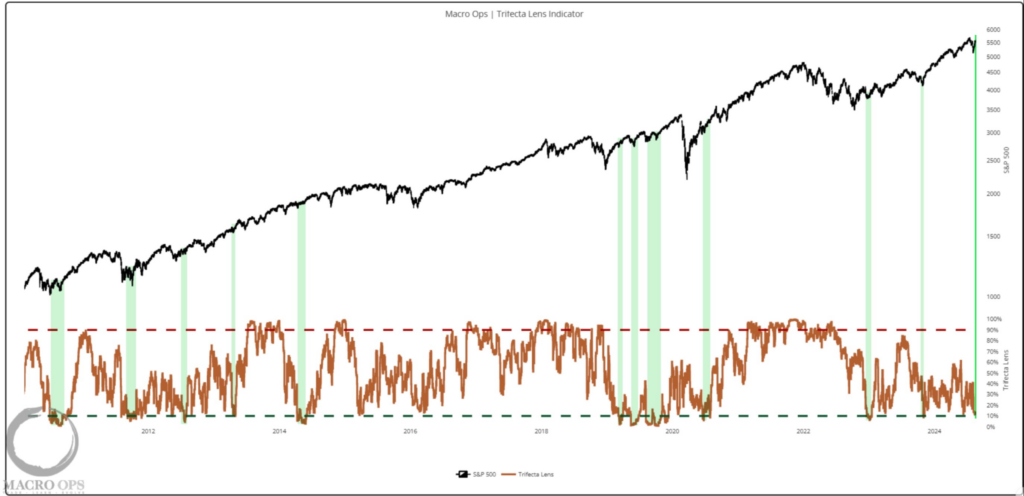
Our Trifecta Lens indicator (a composite of intermediate to long-term macro, technical, and sentiment/positioning data points) dropped below the 10% threshold the other week. This triggered a major buy signal (green highlights show past buy signals).
FYI: This indicator, along with others, is available live on our Heads-up Display (HUD), which is available to members of our Collective. We’re running our annual Labor Day sale this week and offering a 20% discount. Click this link and sign up if you’d like to join our group and get after it with us.
This is a longer-term signal. It says nothing about where markets can trade over the coming weeks.
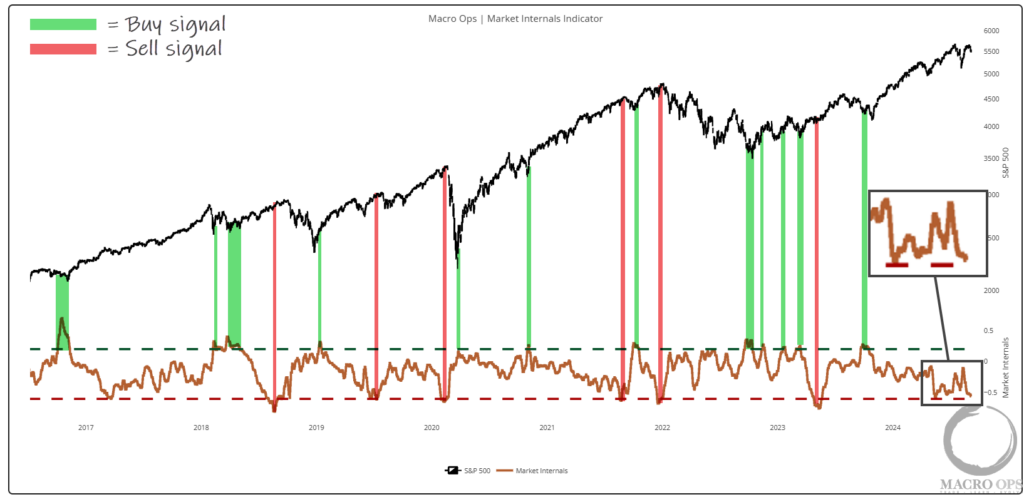
A shorter-term indicator is our Market Internals Aggregator. For the past month or so, we’ve been sharing our concerns over the growing negative divergences in internals (e.g., High vs. Low Beta, QQQ/SPY, Cyc vs. Def, SOXX vs. SPY, Vix 1/3m curve, etc.…).
The current reading is -0.56. A sell signal is triggered on a cross below -0.6 (lower red horizontal line). This likely triggers today or Monday.
Vertical red highlights show past instances.
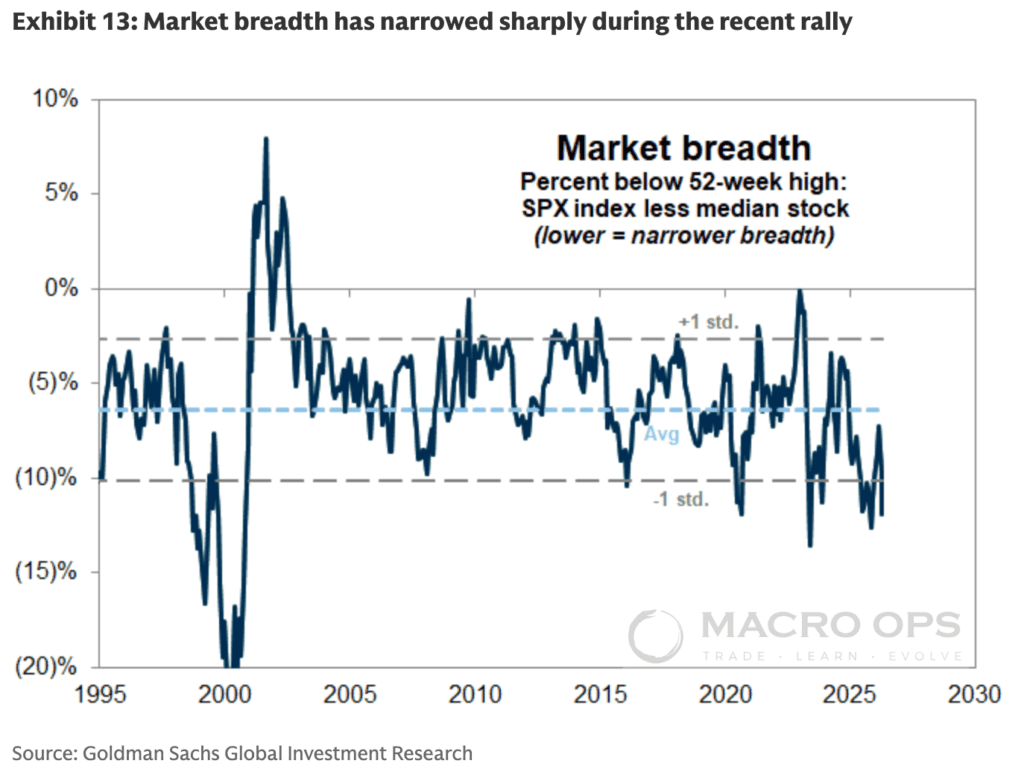
Long-term breadth is strong across the board.
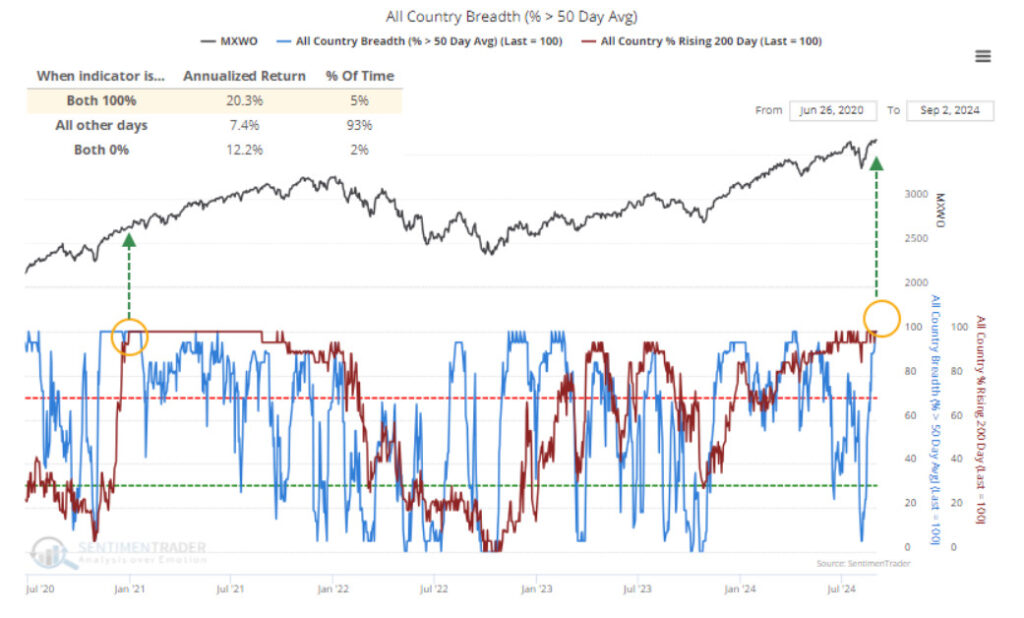
Here’s a chart from SentimenTrader showing all country breadth. The % > 50 day avg in blue and % rising 200 day in red.
ST pointed out that “among nearly two dozen (mostly) developed markets, every single one was in a medium-term uptrend within long-term uptrends. The last time that happened was nearly four years ago… when both indicators were at 100%, developed markets returned an annualized +20.3% (high positive momentum)
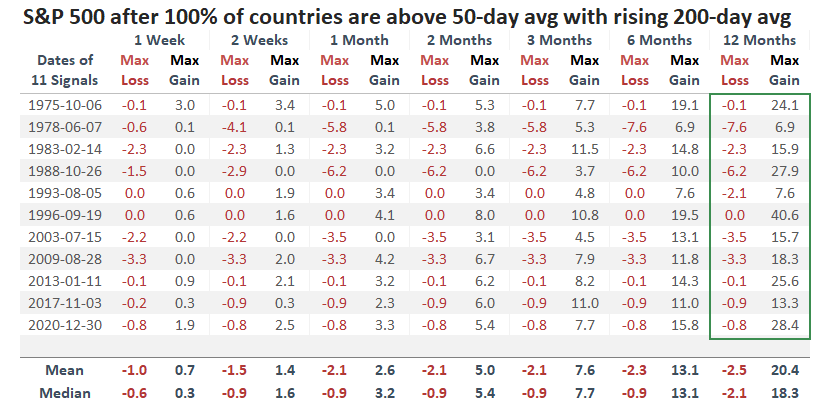
And here’s the SPX’s historical returns following such signals. There have been 11 other instances over the past 50 years. The SPX was higher 12 months later, 100% of the time. The average loss was -2.5%. The avg gain +20.4%.
Not too shabby…
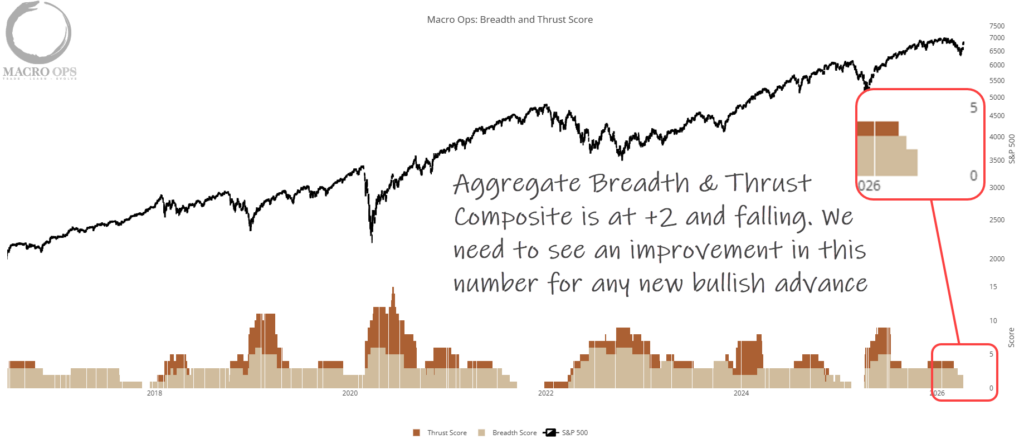
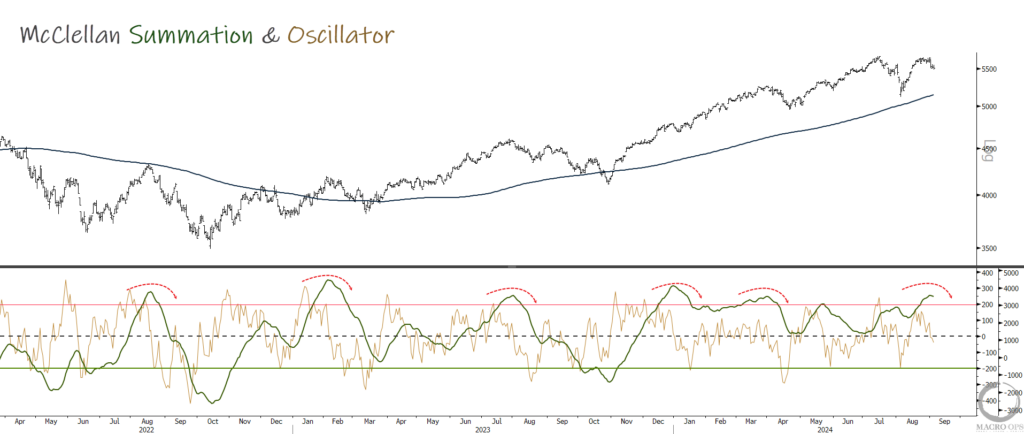
But… many measures of shorter-term breadth are weakening. Take the McClellan Summation (which is stretched long) and the oscillator, which just turned negative.
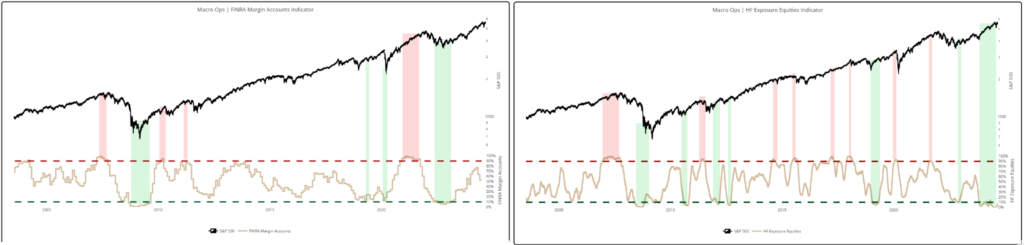
We then have intermediate—to long-term measures of sentiment/positioning. For instance, here’s our Finra Margin Debt Oscillator on the left, showing a neutral reading, and our indicator of Hedge Fund equity positioning on the right, showing extreme bearishness.
These are supported by another one of our favorite sentiment indicators, BofA’s Bull & Bear, which is currently at a neutral level.
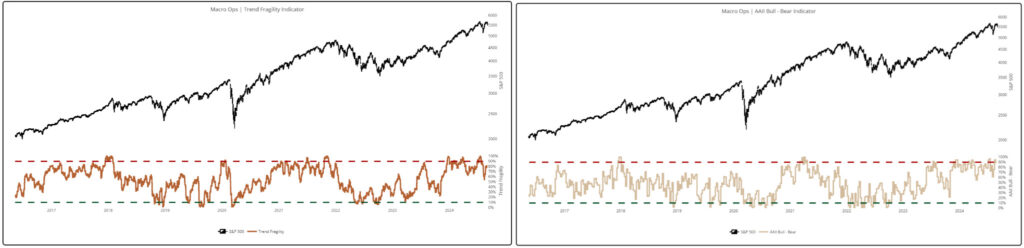
Meanwhile, shorter-term measures of sentiment and positioning, such as our Trend Fragility composite and AAII Bull-Bear, are pretty elevated.
I hope you’re starting to see a trend here.
Longer-term data strongly supports the bulls.
Shorter-term data supports the bears.
That’s a Necker market.
Moving onto the macro.
Since the Spring, we’ve been writing about how the labor market wasn’t nearly as strong as those in the then-consensus higher-for-longer (H4L) camp believed. The establishment survey was clearly being distorted by flawed business birth/death assumptions.
The recent significant negative revisions to payrolls and QCEW report (amongst other data) have since borne this out.
The narrative pendulum has now swung from the overly optimistic H4L to its current schizophrenic oscillation, where it jumps one week from recession is nigh… to an all-good soft landing consensus the next.
So which is it?
It depends on what perspective you take.
First, let’s preface things because this isn’t a normal cycle.
Macro data that typically trend in the same direction aren’t doing that this cycle. Depending on what you look at, you’d think this economy is either firing on all cylinders or about to step on a rake. That’s always the case to some degree, but quite a bit of lingering static has persisted since COVID.
Dario Perkins, one of my favorite macro econ follows, recently said this, which I agree with wholeheartedly.
They shut down the economy and you fire your workforce. Then it reopens, but you can only get eg, 2/3 your work force back, and you can only add workers as they return (or enter the country). What does the hiring rate look like over time? And the vacancy rate? And when you’ve finally got all the workers you needed, are the flows normal or below average? Does this mean recession is imminent? Not a normal cycle…
Yes, I’m increasingly uncomfortable with the state of the labor market. We go into every jobs report with a sense of trepidation. Maybe we are one shock away from something nasty. But anyone who thinks the outlook is obvious because of past cycles isn’t thinking this one through properly.
There are times when the calls are “easier.” And then there are times when they require a hell of a lot more nuance and paranoia. We’re in one of these latter periods.
If you want a smart argument for the bearish/recession view, then give this interview with Dr. Lacy Hunt a watch (link here).
For a thoughtful bullish take, give this post from Michael Kao a read (link here).
We at MO are currently sitting somewhere in the middle of these two.
On the bearish side, I can point to a host of things outside of the labor market that give me pause…
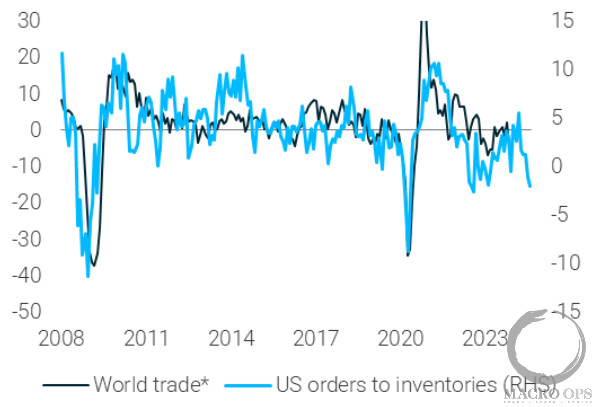
We have cratering US orders-to-inventories (chart below via @darioperkins), negative YoY money supply growth, a disinverting yield curve, a RoC in Staples/Discretionary at levels that always occurs within recessions, a GDP/GDI gap at levels that typically occurs in the lead up to recessions (I’ll be writing on this and why we should track GDI, not GDP, in an upcoming Collective note), a weak Biege book, a SOFR vs 2yr yield spread at recessionary levels, a RoC in the prime-age employment rate at levels that typically precede recessions, etc…
I could go on, but I’d rather keep this brief.
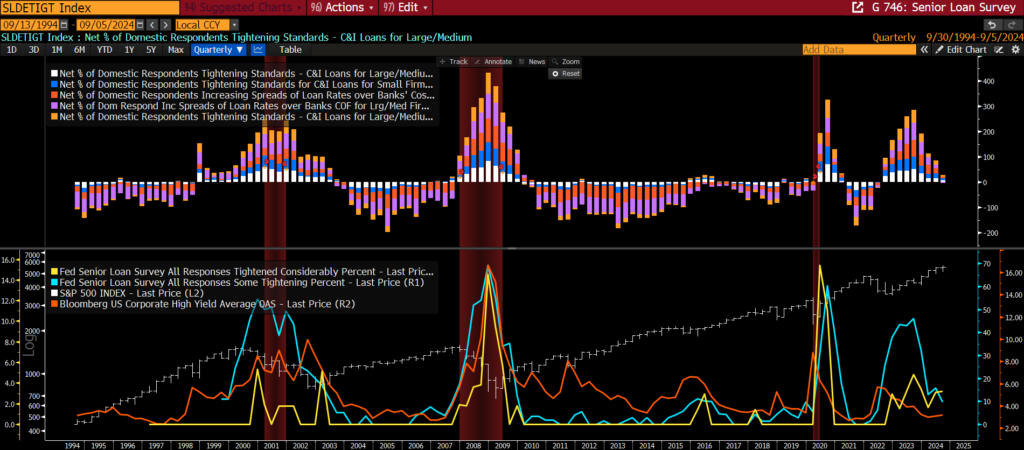
For the bullish side I could point to strong redbook sales, cash flush consumers via the wealth effect (at least for those outside the lower decile), lending standards easing off 23’ highs (see the Fed SLO data below), tight credit spreads, and more…
Look, most people want to read a macro take that brims with certainty, to hell with whether it ends up being right… that’s all the way in the future!
Sadly, all I’ve got for you today is a middling nuanced take. Our base case being that the economy continues to decelerate, but Powell manages to stick his soft landing — though he really should go for 50bps in cuts this month.
The labor market is slowing down and we are at risk of hitting that ethereal point of the Beveridge curve where UR goes vertical. And I will say that citing things like low layoff rates (a popular talking point amongst the bulls at the moment) is weak analysis as that’s the most lagging of all employment indicators.
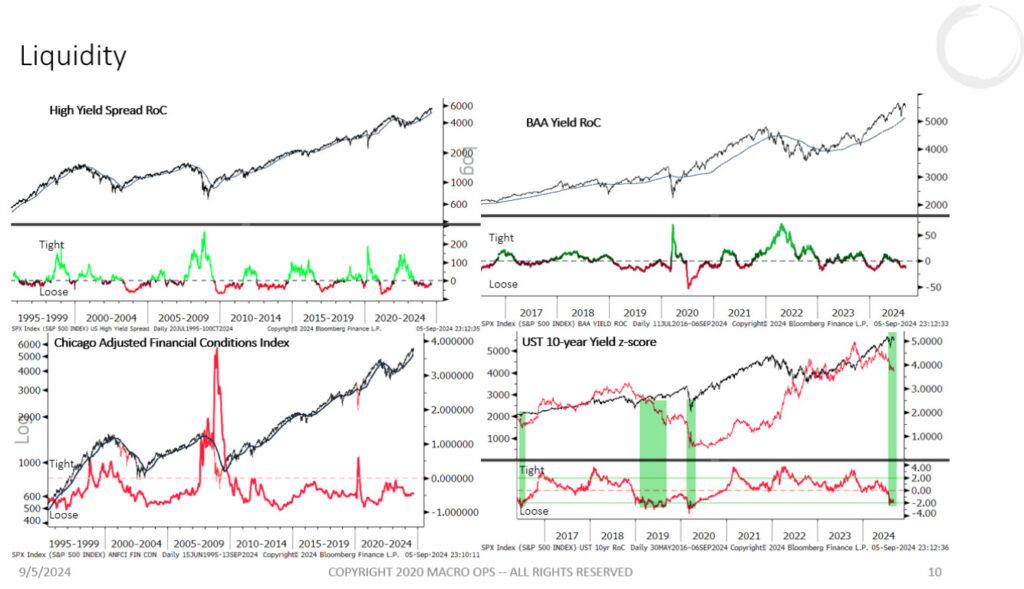
The thing to watch here is liquidity. What is liquidity doing? Where is it headed? And how fast is it moving… The credit market (HY specifically) is one of the most reliable recessionary indicators. Things are still tight, which supports our middling soft-landing thesis.
And even more interesting is that 10-year yields have come off by 100bps since Spring. They’re now 2std oversold. Historically, that’s been a really good buy signal for equities (green highlight below). On top of that, we have the additional tailwind of a crude price that’s also down by roughly $20 over the same period, which historically is good for future equity returns as well.
From our quant/process-driven perspective, things look like this.
Expect chop and vol in the near-term. The market’s internal situation needs to improve. And short-term breadth likely needs to get washed out. Plus, the market needs to see the Fed move/signal that it’s listening to the 2yr yield and plans to follow suit with policy.
Long-term, think post FOMC, the market rips higher on washed-out sentiment, a huge tailwind from lower yields and energy, and a housing market that begins to stabilize from improved affordability through lower rates.
How it all looks depends on where you sit.
It’s a Necker market, after all.
Oh, one last thing… our port has been chopping around the mid 30% to mid 40% year-to-date returns for the past two months. It’s a grind but that’s part of the game. But the above setup — should it play out as we think it will — is going to create some big opportunities going into the end of year. And we think these are potentially nut making trends in the work.
I’ll be writing these up and sharing them over the weekend, so keep an eye out for that.
Also… we’re running our yearly labor day sale this week where we’re offering 20% off membership to our Collective. For more info on what the Collective is and what exactly it offers, click here. We only run this sale once a year so if you’ve been sitting on the fence, now might be a good time to join the group. Don’t hesitate to shoot me any Qs. Cheers!
Stay frosty and keep your head on a swivel.