Global macro is the willingness to opportunistically look at every idea that comes along, from micro situations to country-specific situations, across every asset category and every country in the world. It’s the combination of a broad top-down country analysis with a bottom-up microanalysis of companies. In many cases, after we make our country decisions, we then drill down and analyze the companies in the sectors that should do well in light of our macro view.
I never lock myself down to investing in one style or in one country because the greatest trade in the world could be happening somewhere else. My advice is to make sure that you do not become too much of an expert in one area. Even if you see an area that is inefficient today, it’s likely that it won’t be inefficient tomorrow. Expertise is overrated. ~ Jim Leitner
Good morning!
We’ve got record disconnects between flows and returns, unusual stock and bond performance, a wide disparity in sentiment between both, and much more… Let’s jump in.
1. Chart and note via BofAML with emphasis by me “Who’s buying: note record disconnect between flows & returns in 2019, only similar year was 2016; buybacks = #1 source of market support in 2H’19; US banks announced $129bn buybacks next 4 quarters.” See chart #5 from last week’s Dozen. Buybacks are set to accelerate beginning in August and run strong into the end of the year.

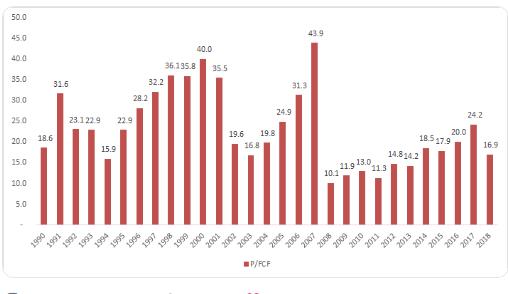
2. “STOCKS ARE OVERVALUED, STOCKS ARE OVERVALUED!!” The S&P 500 is trading at a P/FCF multiple that is well below its historical average (Chart via @1MainCapital).
3. There have only been 10 other times over the last 75-years when stocks and bonds have both put up double-digit returns over the same six month period (chart via NDR).
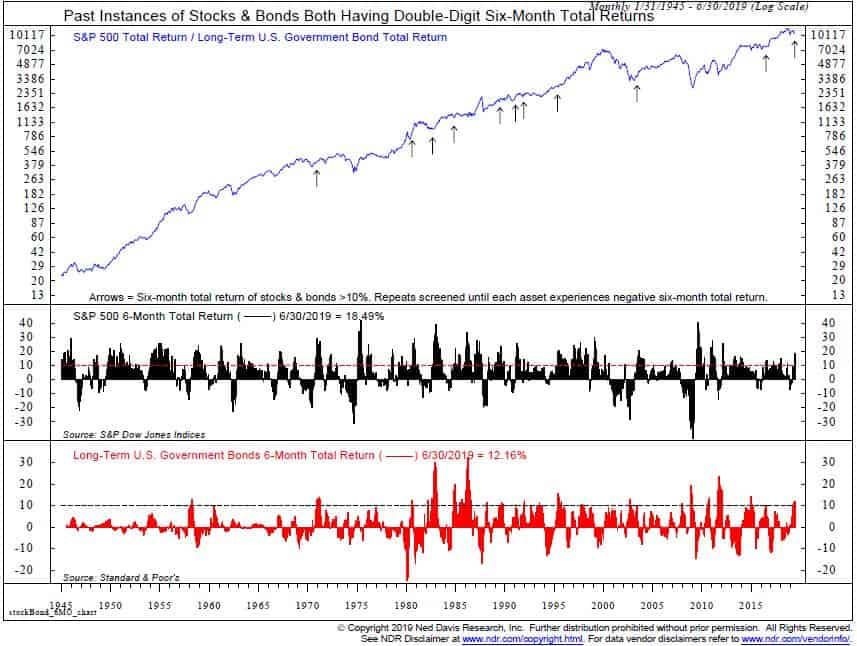
4. Stocks went on to outperform bonds each and every time over the following 12-months (chart via NDR).

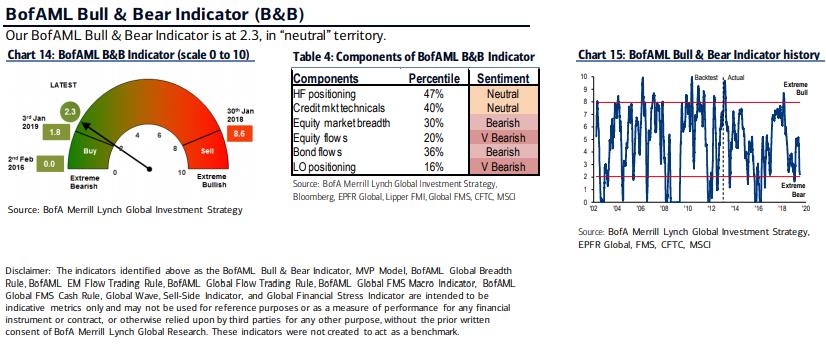
5. BofAML’s Bull & Bear Indicator is close to triggering a “buy signal”. The indicator shows sentiment and positioning are near “extreme bear” territory.
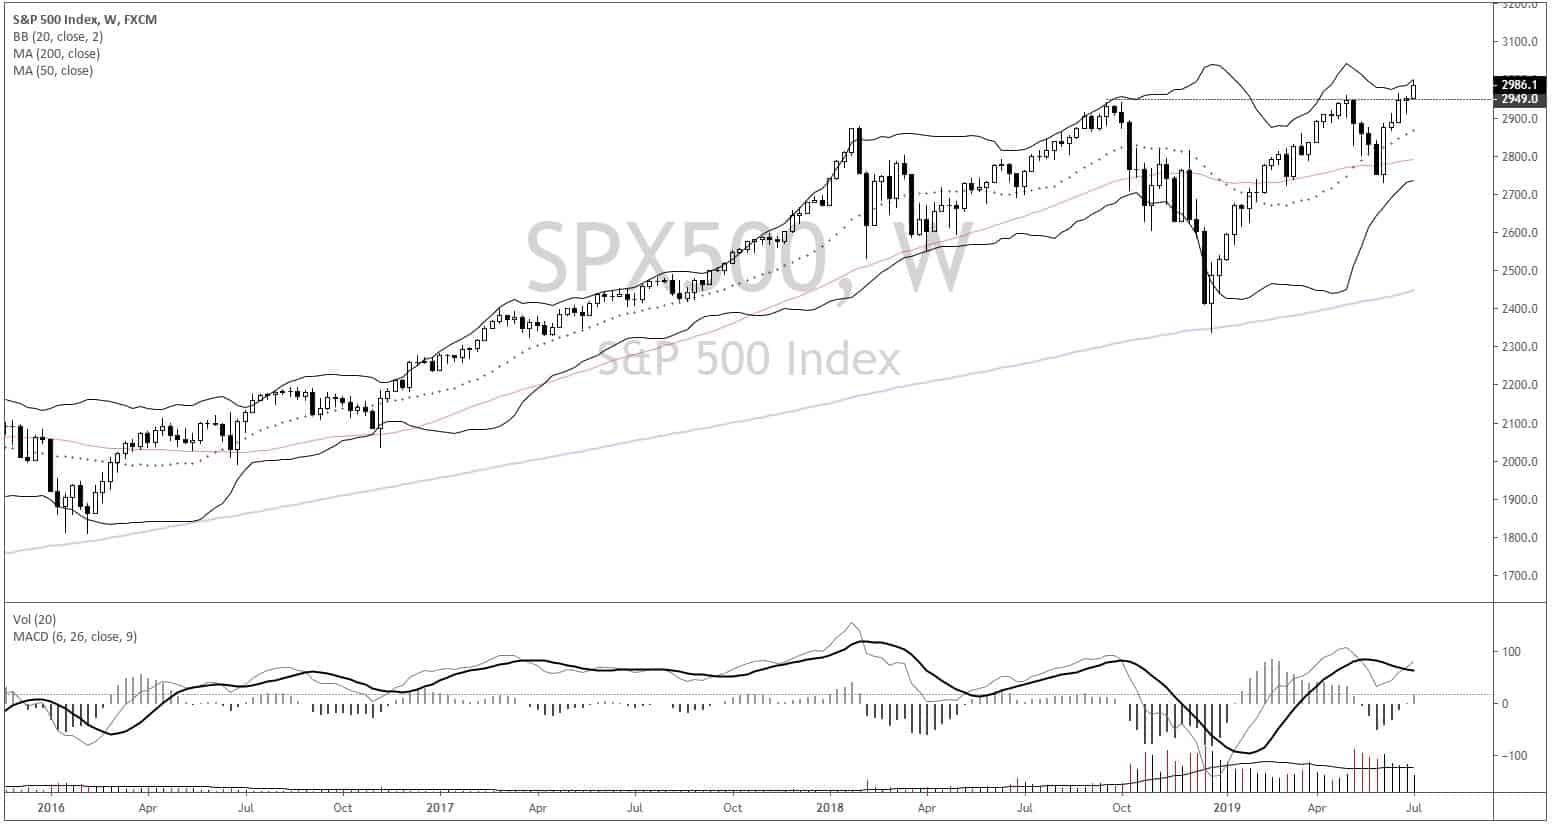
6. Meanwhile, the S&P 500 closed at a new all-time high last week.
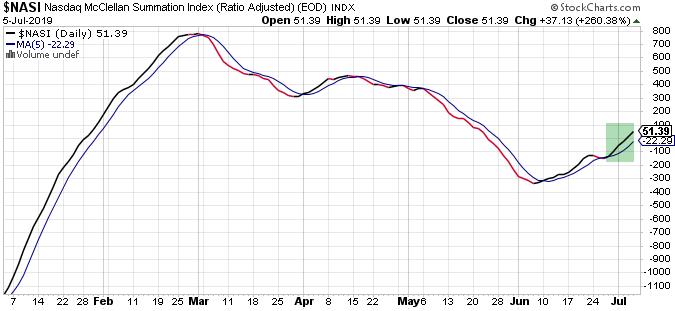
7. The Nasdaq McClellan Summation Index ($NASI) reversed from a temporary sell signal and is back in a strong uptrend.
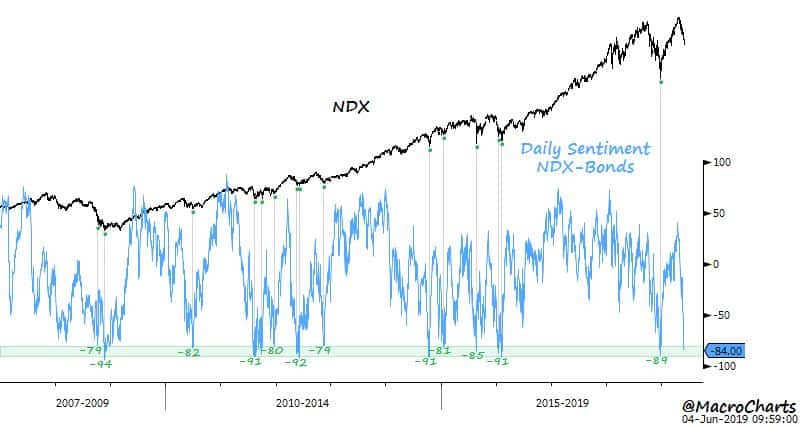
8. Daily Sentiment (DSI) for the Nasdaq (NDX) relative to bonds is at extremely depressed levels (chart via @MacroCharts).
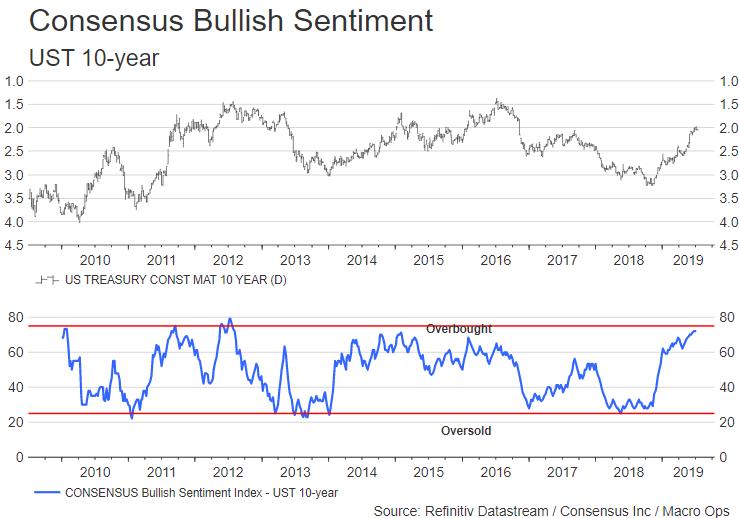
9. Consensus Inc’s Bond Sentiment Index shows bond bullishness at 7-year highs.
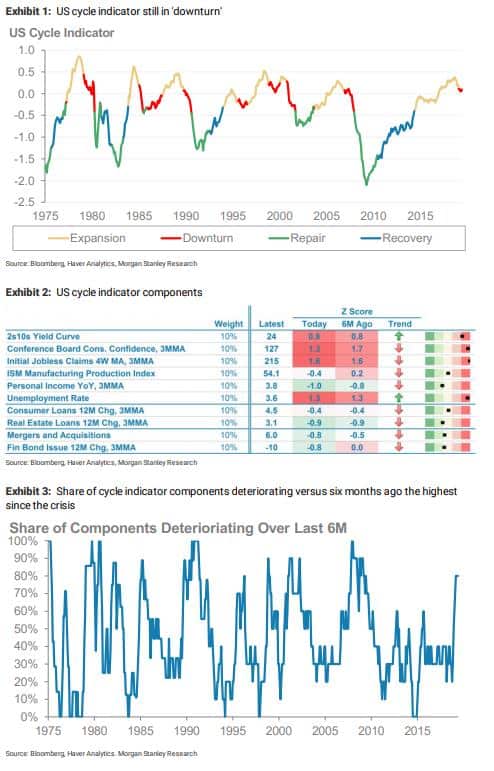
10. Morgan Stanley’s US Cycle Indicator is still in a downturn.
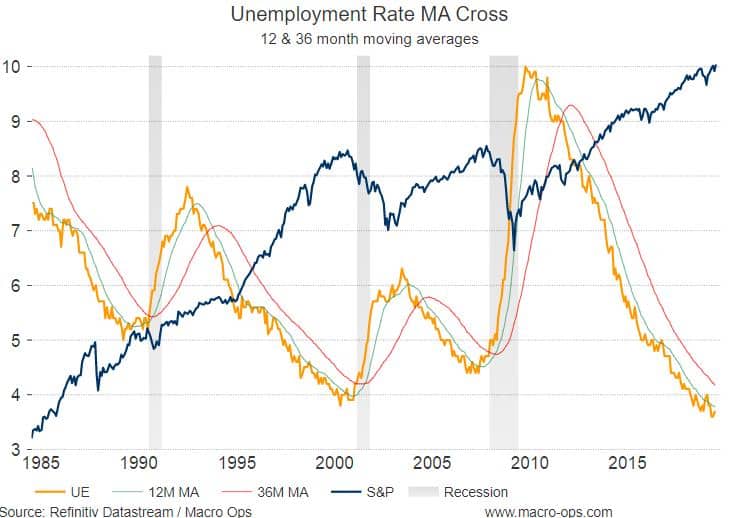
11. The US unemployment rate ticked up to 3.7% last week but is still well below its 12 and 36-month moving averages.
12. BofAML’s Asset Quilt of Total Returns. Notice how the returns for each asset class have almost entirely flipped from last year?