A Monday Dozen [CHART PACK] #2

Well, I was worth over one million after the close of business that day. But my biggest winnings were not in dollars but in the intangibles: I had been right, I had looked ahead and followed a clear-cut plan. I had learned what a man must do in order to make big money; I was permanently out of the gambler class; I had at last learned to trade intelligently in a big way. It was a day of days for me ~ Jesse Livermore, Reminiscences of a Stock Operator

Good morning!

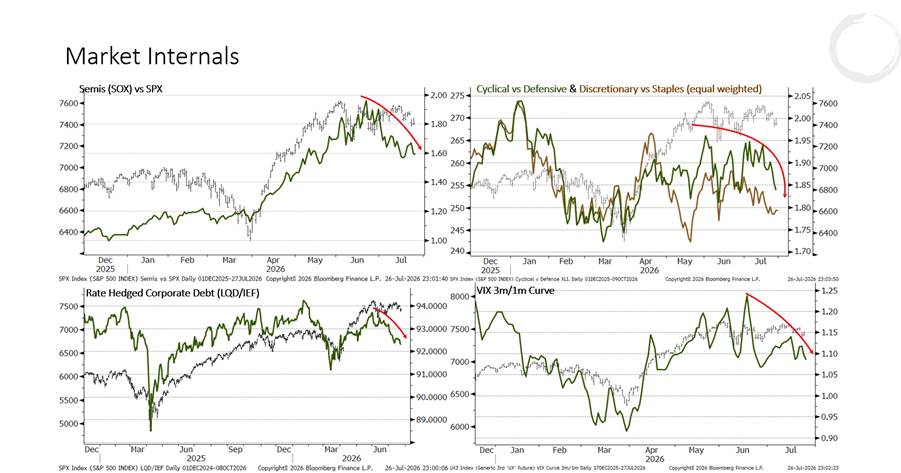
We’ve got over a century of equity volatility, falling Capex, contracting margins, and traders in a near PANIC. Here’s your Monday Dozen Chart Pack.

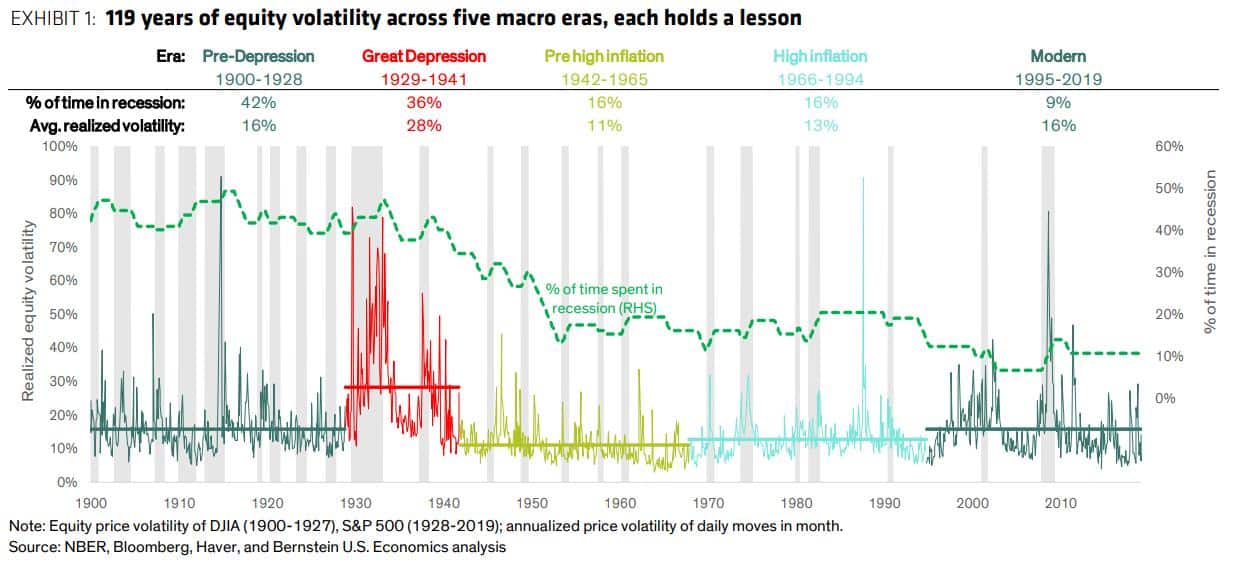
1. This is an awesome chart that I found floating around on the twitters. It’s from Bernstein Research and shows 119-years of equity volatility across five different macro eras. You can see that the percentage of time spent in recession (dotted green line) has trended lower and dropped considerably over the last century.

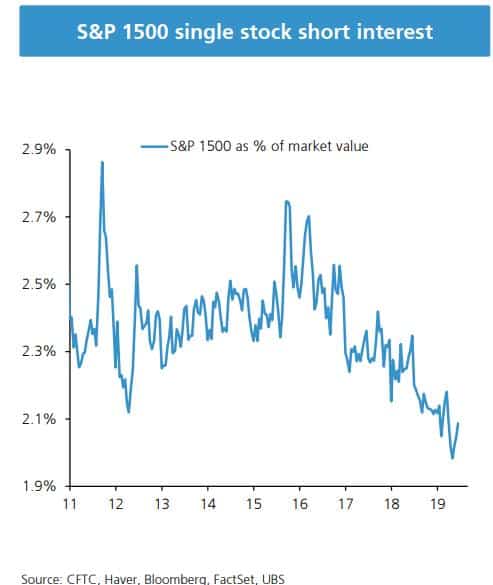
2. This chart from UBS shows how much single stock short interest has dropped over the last 3-years. Looks like people have kind of given up on shorting. Maybe it’s time to start increasing your short book?

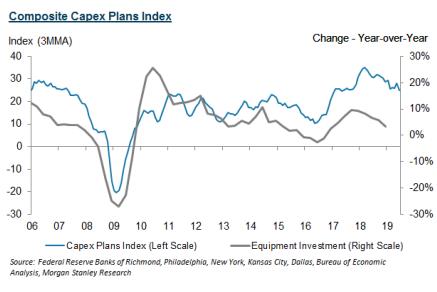
3. Capex is a critical component of the Levy-Kalecki Profits Equation. Morgan Stanley’s composite Capex Plans Index fell again in June, back to levels last seen in mid-17’.

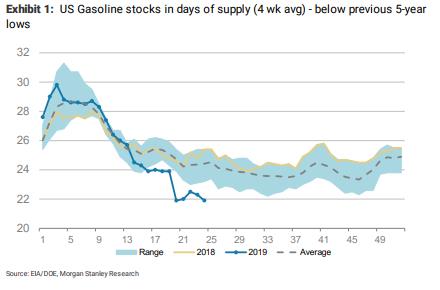
4. US Gasoline stocks, measured in 4-week average of days of supply, has fallen well below previous 5-year lows (chart via MS).

5. This chart shows UBS’s rolling 5-day Corporate Liquidity Signal (aka, buybacks). The net destruction of shares (more shares being taken off market through buyback and M&A relative to new issues) continues to be one of the most dominant drivers this bull cycle. It’s important to keep an eye on where net buybacks are trending.

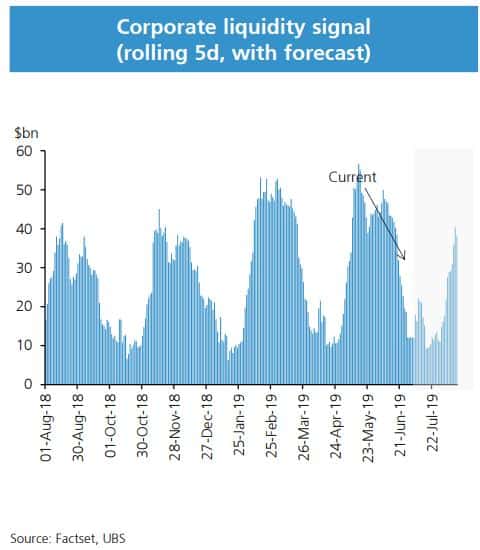
6. This is one reason why we continue to be positioned net long the overall market.

7. This chart shows the current US Corporate before tax profit margins based against previous cyclical trough relative to past business cycles. We can see that margins are contracting but if this cycle is like past average ones, from a profit margin standpoint, then recession is still a ways off (chart via Societe Generale).

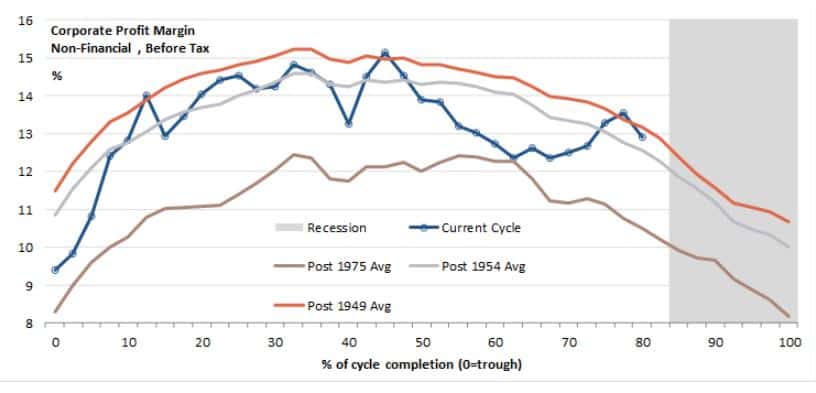
8. With average debt servicing costs for US companies at depressed levels, the force driving contracting margins is primarily labor costs.

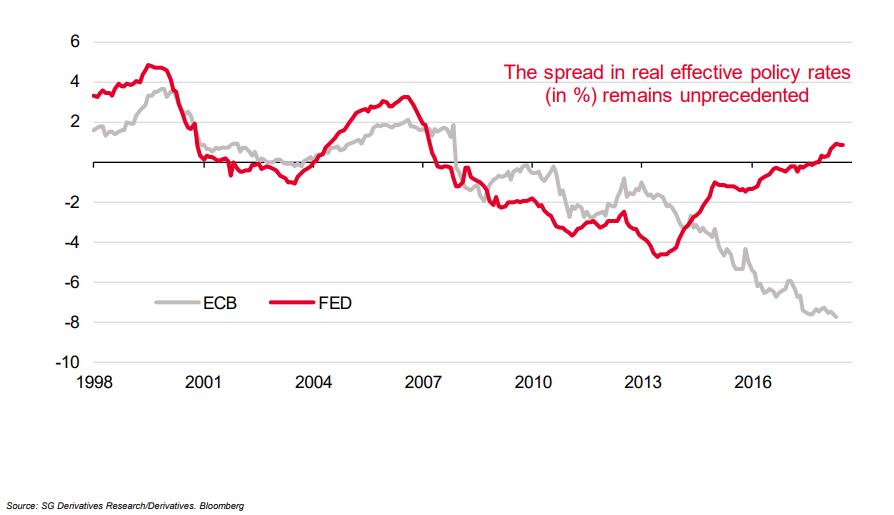
9. The current spread in real effective policy rates between the Fed and the ECB is unprecedented (chart via Societe Generale).

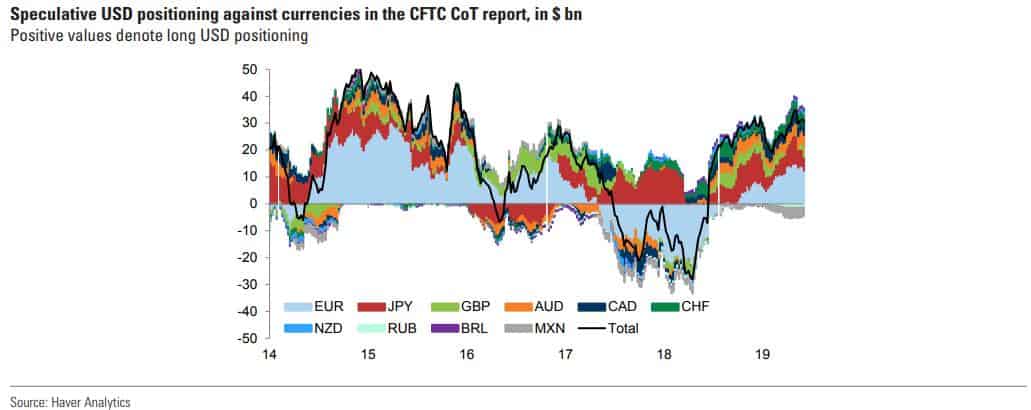
10. Total speculative USD position. Lots of air to be let out of this trade. I’m short and looking to get more so (chart via GS).

11. This chart shows the number of 25bps hikes/cuts delivered every year relative to the amount of 25bps cuts already priced in over the next 12-months (chart via MS).


Subscribe To Our Newsletter

Brandon Beylo

Value Investor

Brandon has been a professional investor focusing on value for over 13 years, spending his time in small to micro-cap companies, spin-offs, SPACs, and deep value liquidation situations. Over time, he’s developed a deeper understanding for what deep-value investing actually means, and refined his philosophy to include any business trading at a wild discount to what he thinks its worth in 3-5 years.

Brandon has a tenacious passion for investing, broad-based learning, and business. He previously worked for several leading investment firms before joining the team at Macro Ops. He lives by the famous Munger mantra of trying to get a little smarter each day.

AK

Investing & Personal Finance

AK is the founder of Macro Ops and the host of Fallible.

He started out in corporate economics for a Fortune 50 company before moving to a long/short equity investment firm.

With Macro Ops focused primarily on institutional clients, AK moved to servicing new investors just starting their journey. He takes the professional research and education produced at Macro Ops and breaks it down for beginners. The goal is to help clients find the best solution for their investing needs through effective education.

Tyler Kling

Volatility & Options Trader

Former trade desk manager at $100+ million family office where he oversaw multiple traders and helped develop cutting edge quantitative strategies in the derivatives market.

He worked as a consultant to the family office’s in-house fund of funds in the areas of portfolio manager evaluation and capital allocation.

Certified in Quantitative Finance from the Fitch Learning Center in London, England where he studied under famous quants such as Paul Wilmott.

Alex Barrow

Macro Trader

Founder and head macro trader at Macro Ops. Alex joined the US Marine Corps on his 18th birthday just one month after the 9/11 terrorist attacks. He subsequently spent a decade in the military. Serving in various capacities from scout sniper to interrogator and counterintelligence specialist. Following his military service, he worked as a contract intelligence professional for a number of US agencies (from the DIA to FBI) with a focus on counterintelligence and terrorist financing. He also spent time consulting for a tech company that specialized in building analytic software for finance and intelligence analysis.

After leaving the field of intelligence he went to work at a global macro hedge fund. He’s been professionally involved in markets since 2005, has consulted with a number of the leading names in the hedge fund space, and now manages his own family office while running Macro Ops. He’s published over 300 white papers on complex financial and macroeconomic topics, writes regularly about investment/market trends, and frequently speaks at conferences on trading and investing.

Macro Ops is a market research firm geared toward professional and experienced retail traders and investors. Macro Ops’ research has been featured in Forbes, Marketwatch, Business Insider, and Real Vision as well as a number of other leading publications.

You can find out more about Alex on his LinkedIn account here and also find him on Twitter where he frequently shares his market research.