This dead weight of conventional wisdoms encourages the idea that the currencies are complex and sophisticated. But once you strip away all the rationalizations and conventions that have no basis in reality, you discover the truth: which is that the currency markets are simple. And, so far from being highly sophisticated, they are, as I have suggested, remarkably naive ~ John Percival “The Way Of The Dollar”
In this week’s Dirty Dozen [CHART PACK] we walk through the Trifecta backdrop for the US stocks (hint: strong positive momentum but extension reaching extremes), we then go over the Trifecta setup for bonds, and then the US dollar, talk about a coming fade trade in GBPUSD, and pitch a reentry into long USDCNH off of a pullback reversal, plus more…
**Note: We’re opening enrollment to the Macro Ops Collective next week.
The Collective is our premium service that offers institutional-level research, proprietary quant tools, actionable investment strategies, and a killer community of dedicated investors and fund managers from around the world.
** Enrollment opens next week on Monday, July 24th, and will remain open until Sunday, July 30th.
You can learn more about the Collective and what it can do for your investing here.
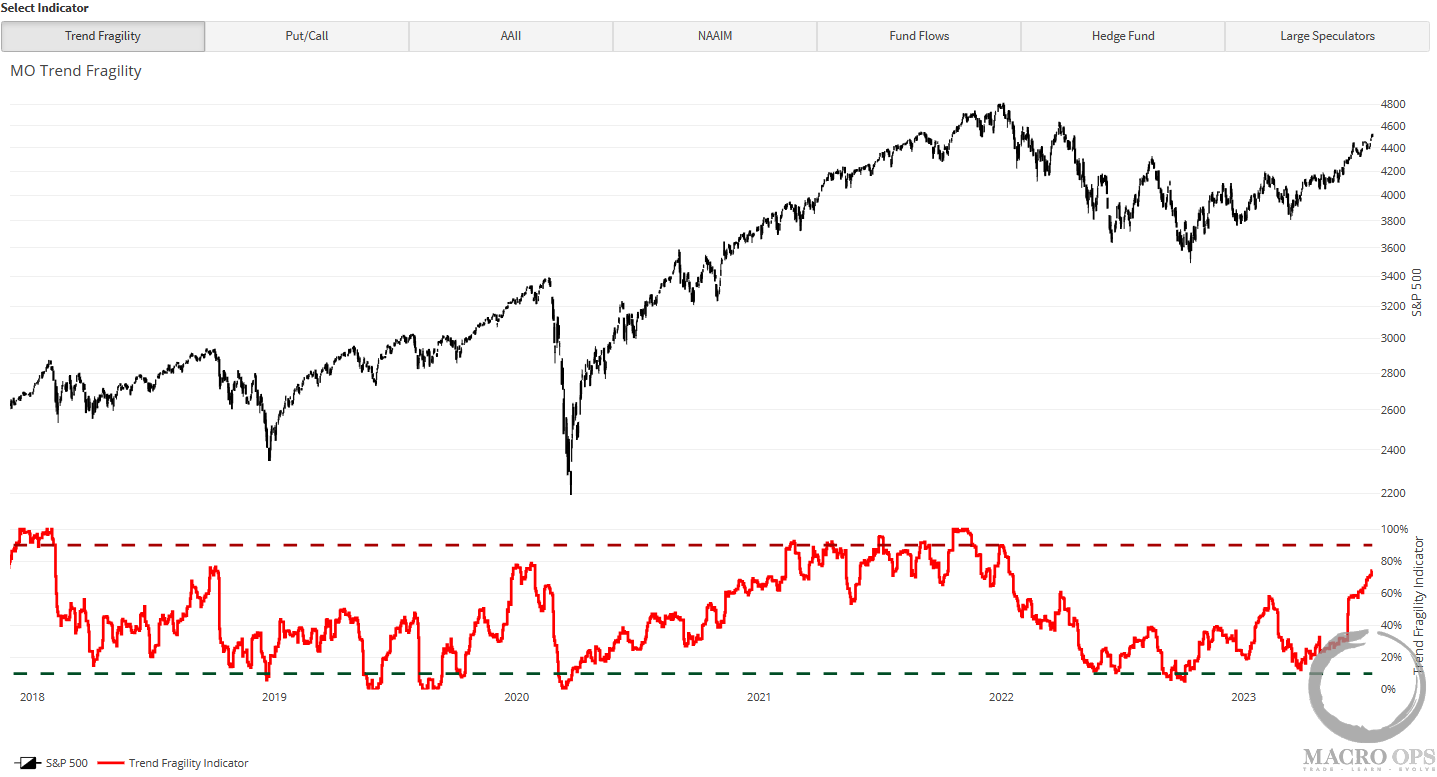
1. Bull Quiet SQN regime, strong momentum, favorable internals (chart #2), the path of least resistance remains up. With that said, this trend is getting stretched and the Narrative Pendulum will reach the side of the bullish extreme (chart #3) within the next month if the market keeps running like this and fails to retrace/shake some peeps out.
2. Still no major divergences in the leads which tells me this move probably turns parabolic before it peaks out.

3. Trend Fragility, our composite positioning and sentiment indicator, has now climbed to 74%. This is still below the 90% for a classic sell signal but at this pace, we’ll be there in a couple more weeks.
4. Three forces are always at work on price (1) Trend (2) Momentum, and (3) Mean reversion. When an asset becomes extended from its moving averages, sellers begin to take profits and buyers turn more hesitant. Combined, these act as a countervailing force working to pull the asset back to its averages (20, 50, and 200dma).
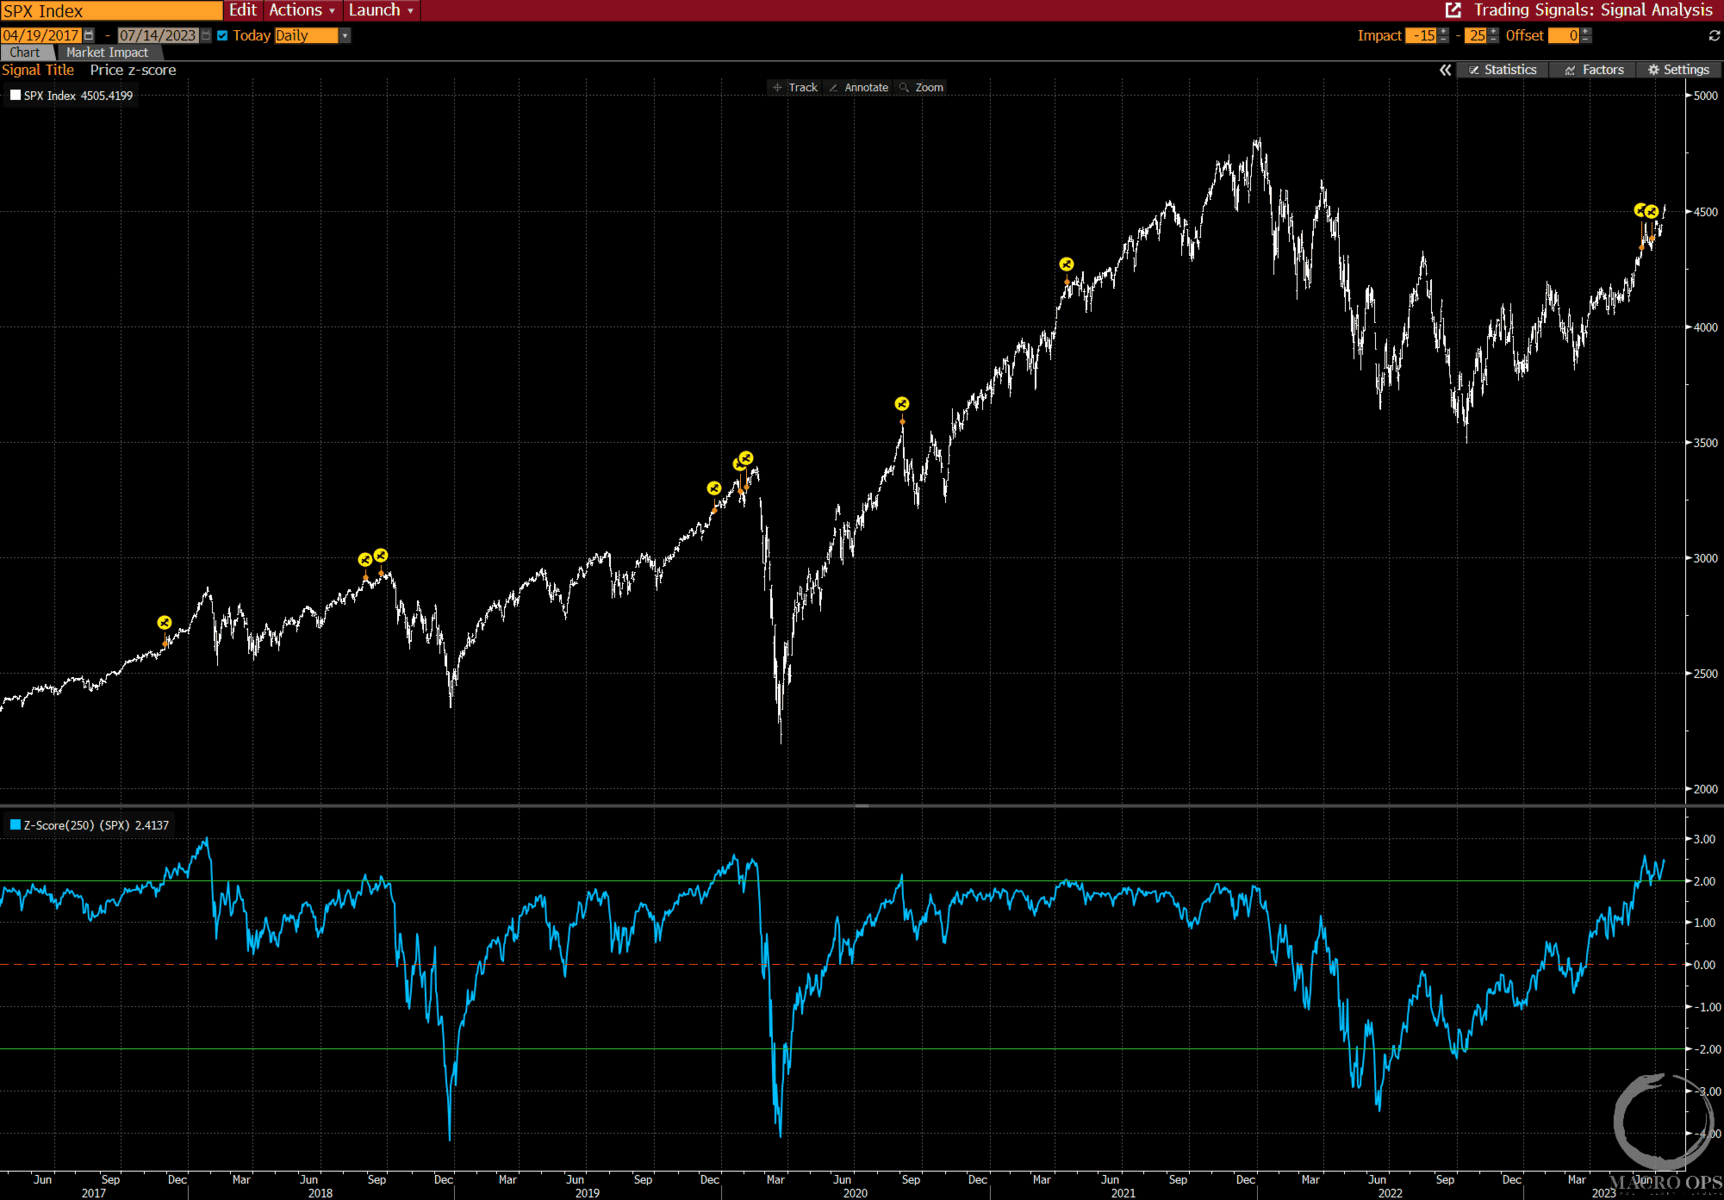
The SPX is more than 2std extended over a 20, 50, and 200-day time frame. This means it’s becoming more susceptible to the magnetic force of mean reversion over the near term.
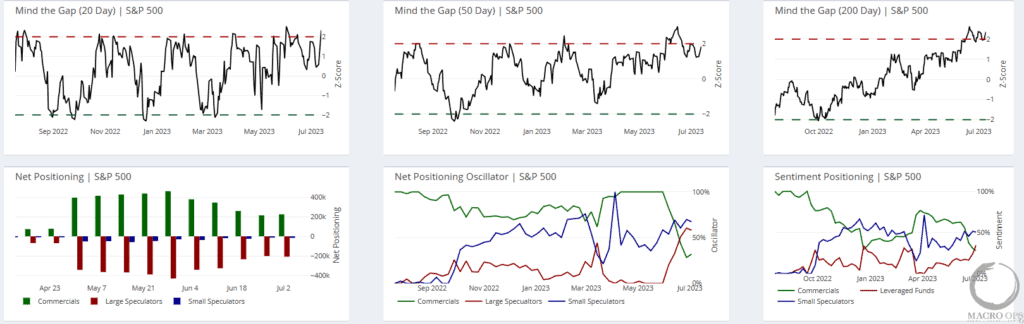
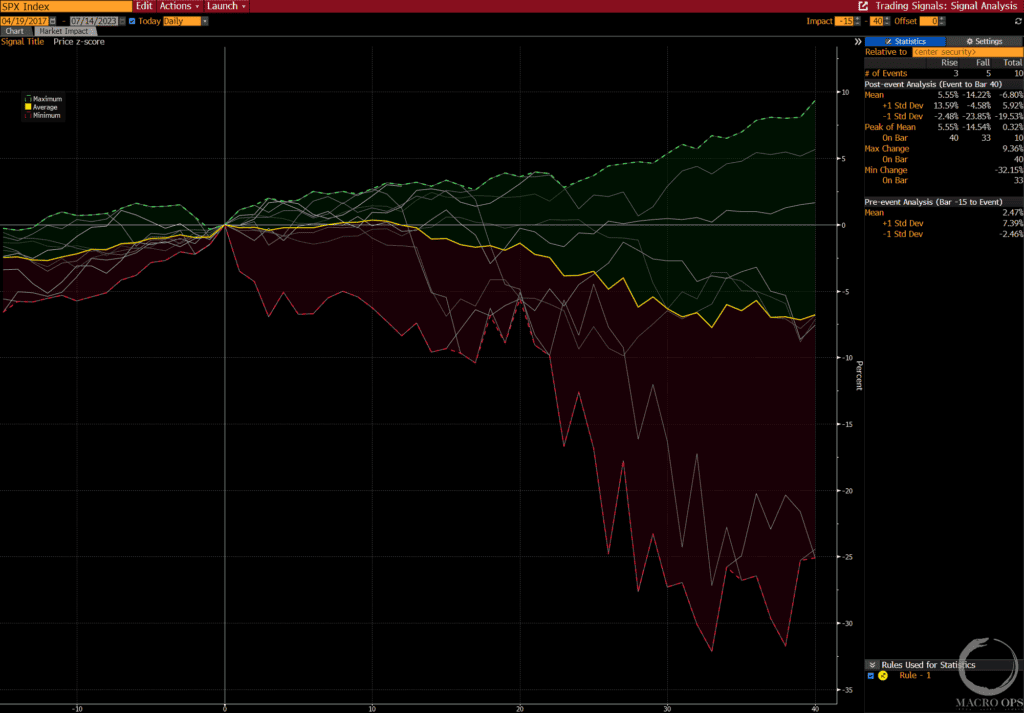
5. Yellow circles mark past instances where the SPX traded over 2std (50w lookback) over the past six years.
The second graph shows the following 40-day returns.
I don’t give too much weight to these things unless we see a number of other things begin to line up (ie, Trend Fragility > 90%, negative internal divergences, tightening credit, etc…). But still useful context for where we are in the trend.

6. Last week the market was helped by the pop in bonds (fall in yields) as well as the big drop in USD, easing conditions for risk assets.
We think buying bonds will be a BIG trade at some point within the next couple of months, mostly due to positioning/sentiment but also due to a couple of key macro drivers as well.
But for now, it’s still too early to fade. US data is still surprising to the upside while we’ve probably gotten all the juice from downside surprises in the inflation data. And our yield leads continue to confirm this upward trend.
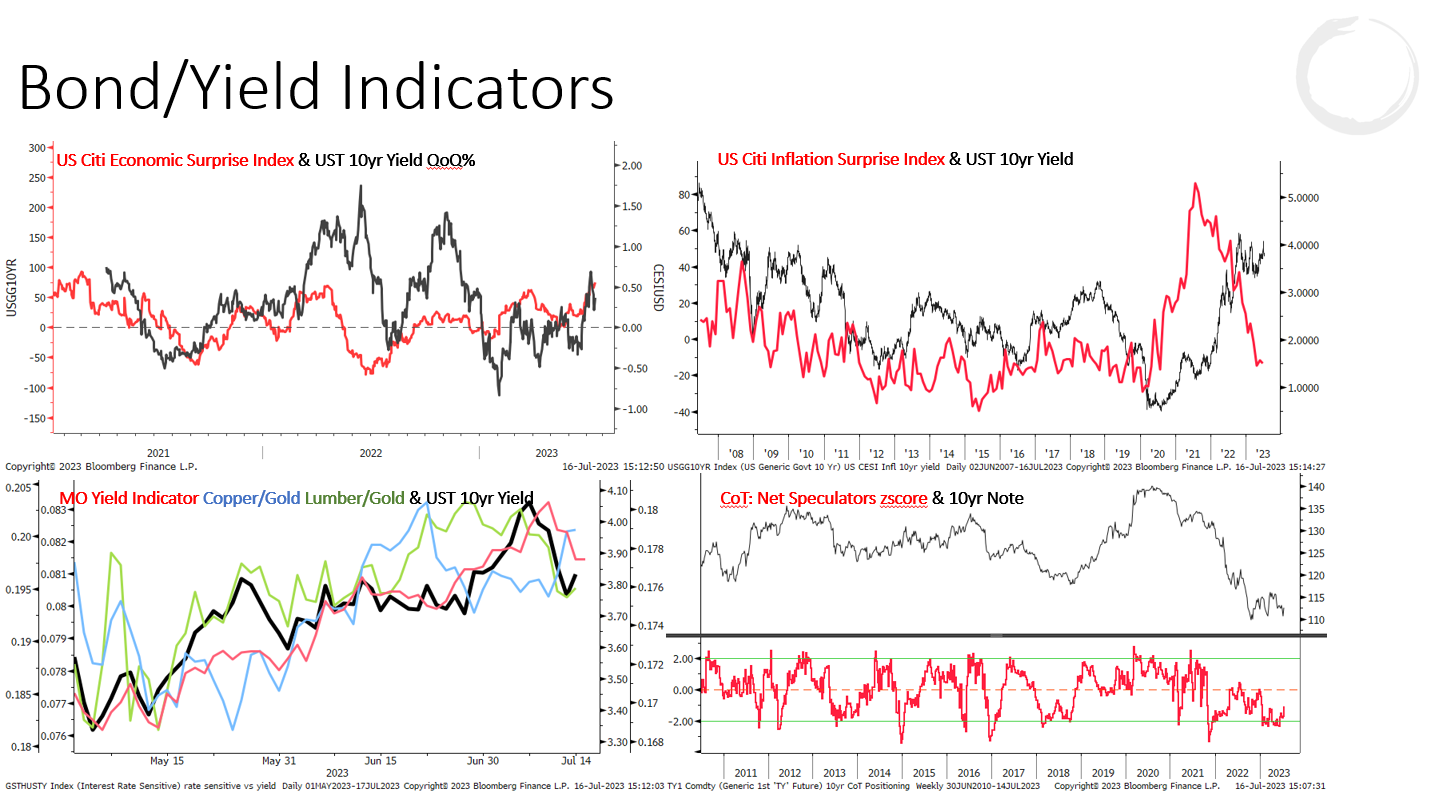
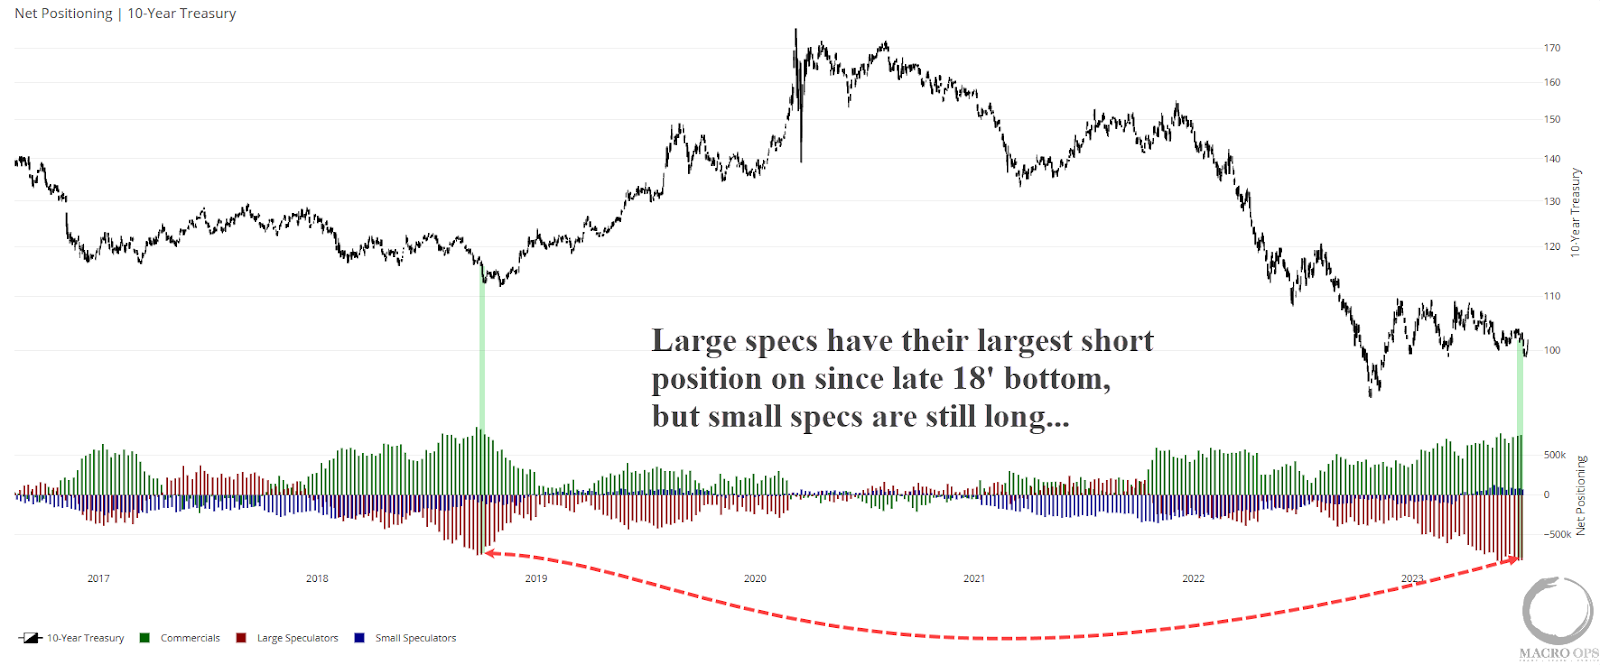
7. Here’s a snapshot of the positioning in bonds. Large Specs have their largest short position since the major bottom in late 18’. Ideally, we’d want to see Small Specs (blue bars) also flip bearish before we start looking for a tradeable bottom.
8. What will be the catalyst for a bottom in bonds? The truth is that bonds will bottom because everyone who was going to sell has sold. The fundamental narrative will likely be a risk-off event caused by investors getting too over their skis in risky assets and data starting to surprise to the downside.
This will then impact the dollar, which saw some big moves over the last two weeks — the USDJPY short we talked about last Monday is off to a good start.
The Japanese yen and British pound continue to have the most one-sided positioning (specs crowded short JPY and crowded long GBP). And every major USD pair is at extremes in overbought levels. See graph on right (data from our HUD “Heads Up Display”).
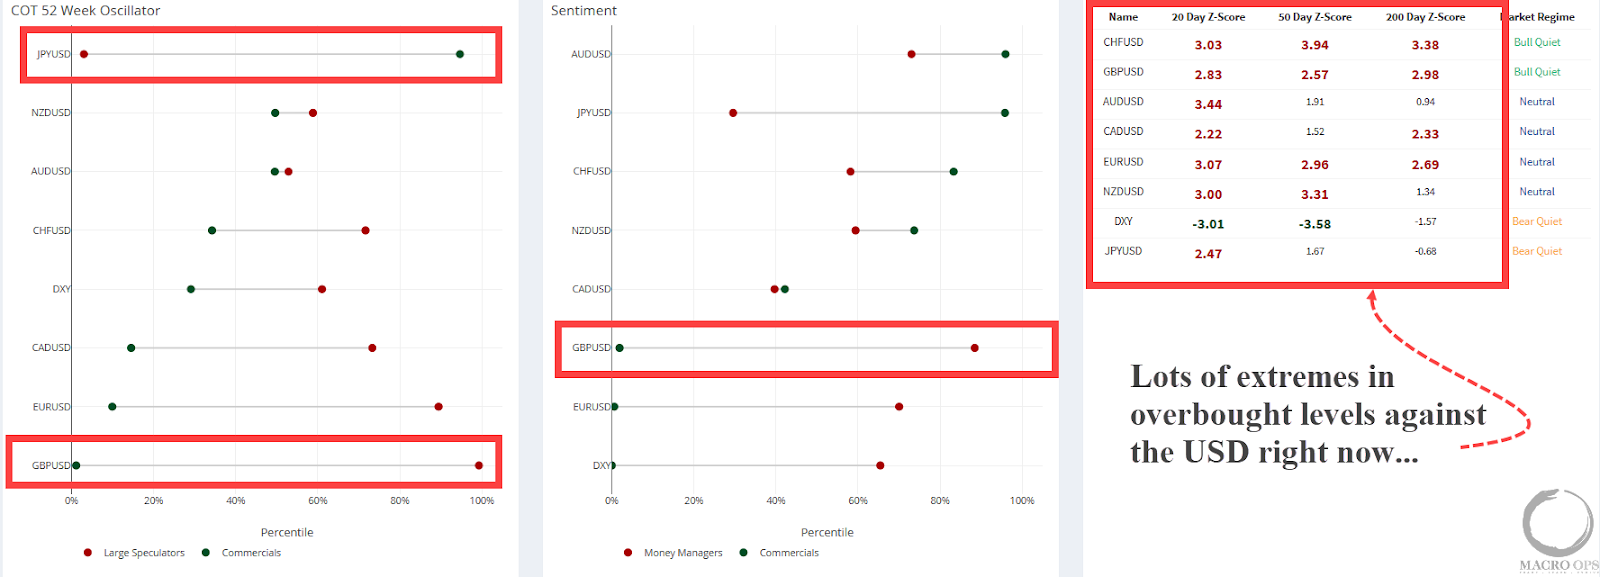
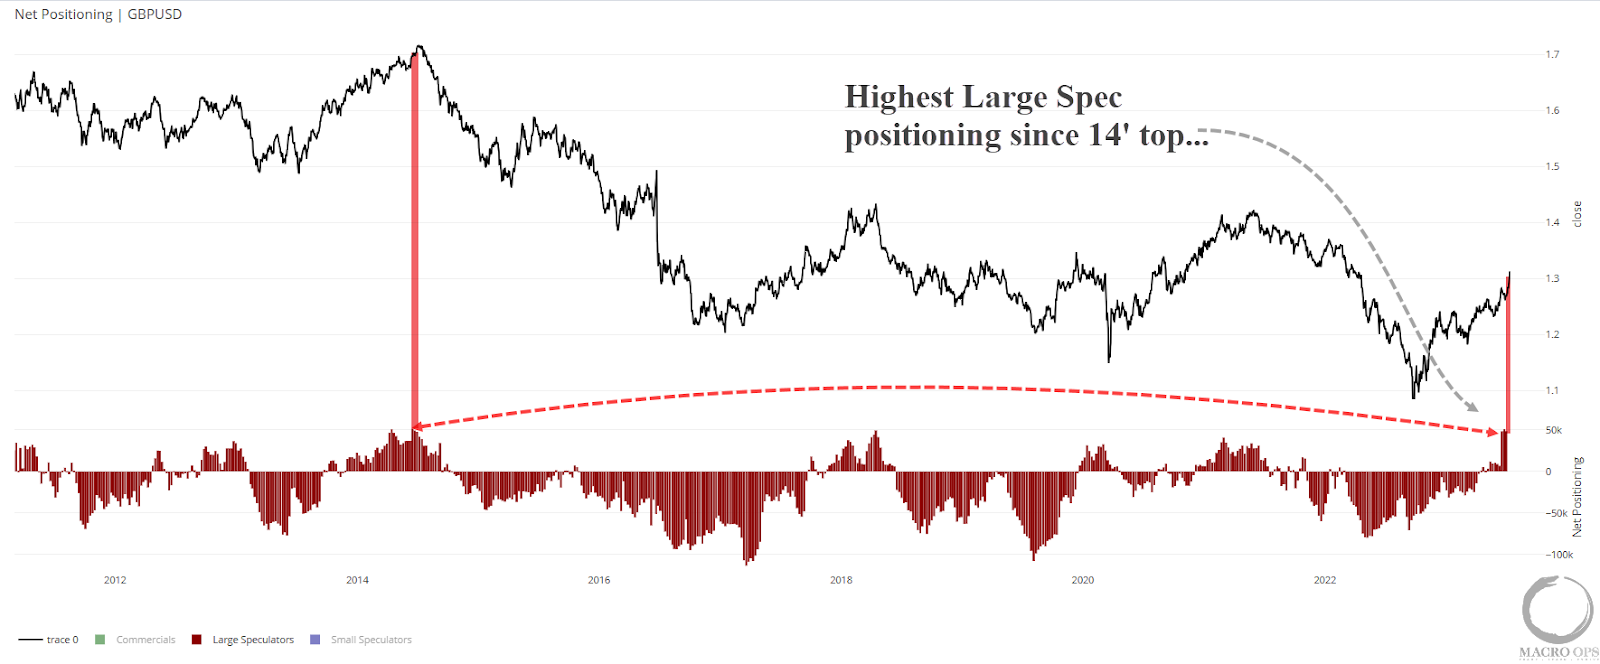
9. Speaking of GBP, Large Spec positioning is at its highest level since the major top in 2014.
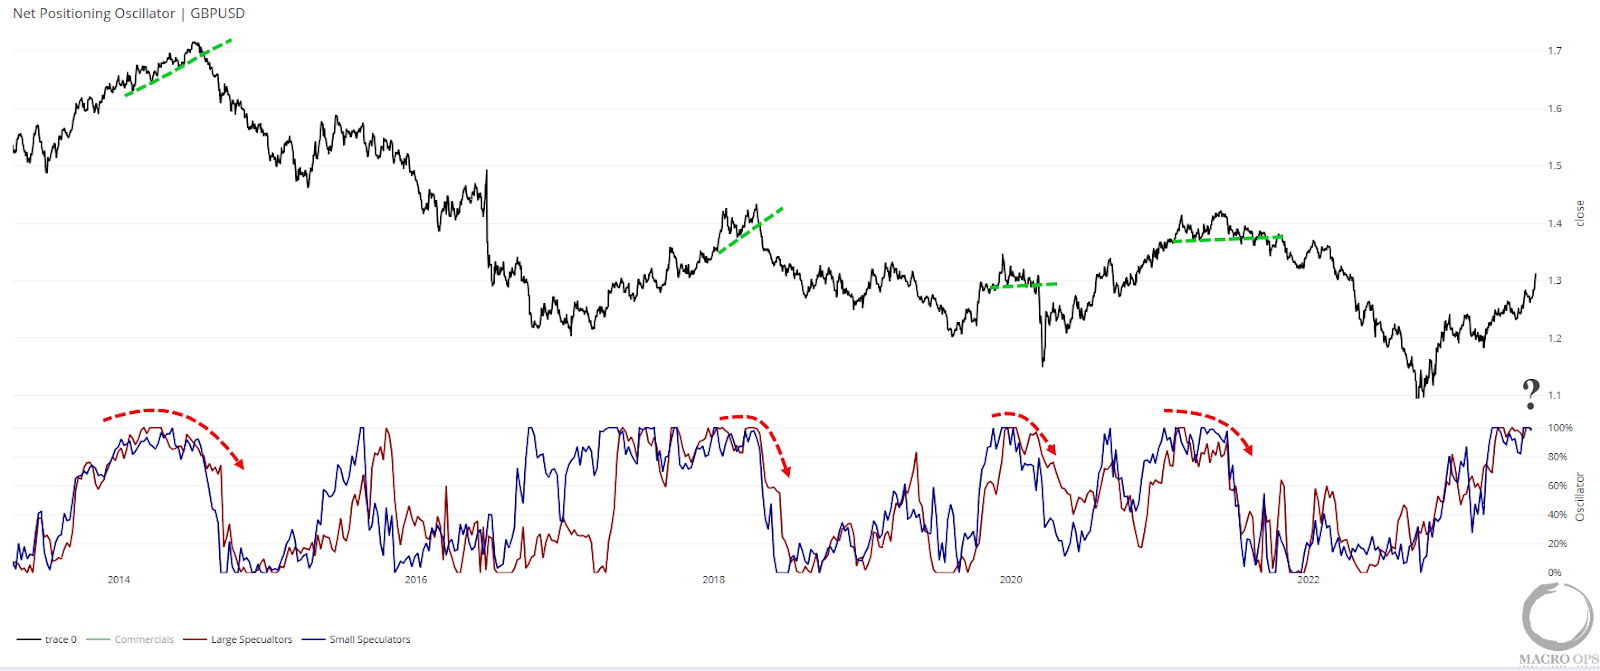
10. An ideal setup in currencies is when you see positioning get maxed out but then begin to slowly reverse while the underlying trades sideways forming a top or bottom pattern.
Below is our CoT oscillator showing large and small specs are maxed out in the 100th percentile, but haven’t rolled over yet and GBP is still cruising along. So we just need to wait and watch this one for now.
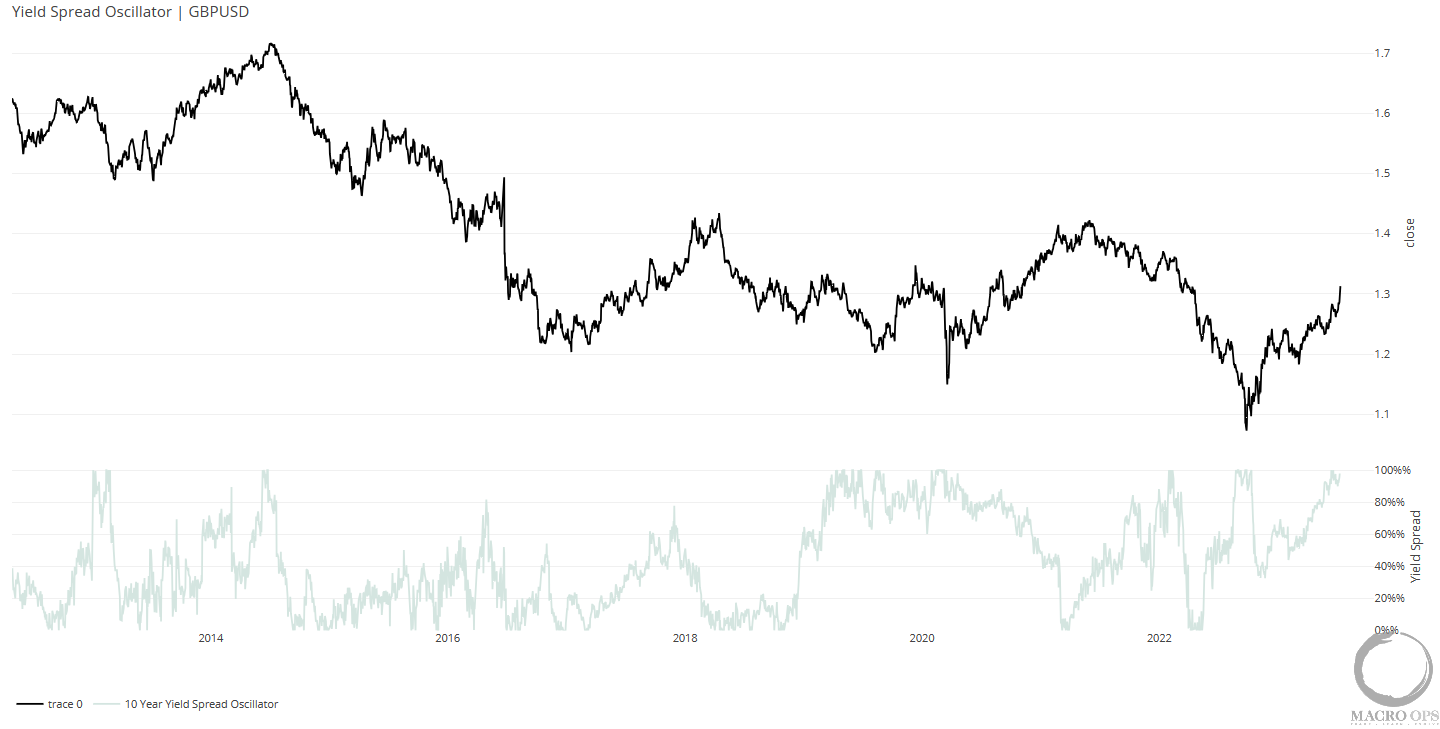
11. Currencies ultimately trade off yield differentials and with yield spreads it’s the rate-of-change, not so much the level, that ultimately matters.
The chart below shows our GBPUSD 10yr yield oscillator is at its 98th percentile for GBP, meaning yield spreads are trading with momentum in the pound’s favor. We should see this roll over and move below 50% in order for a larger top to be put in.
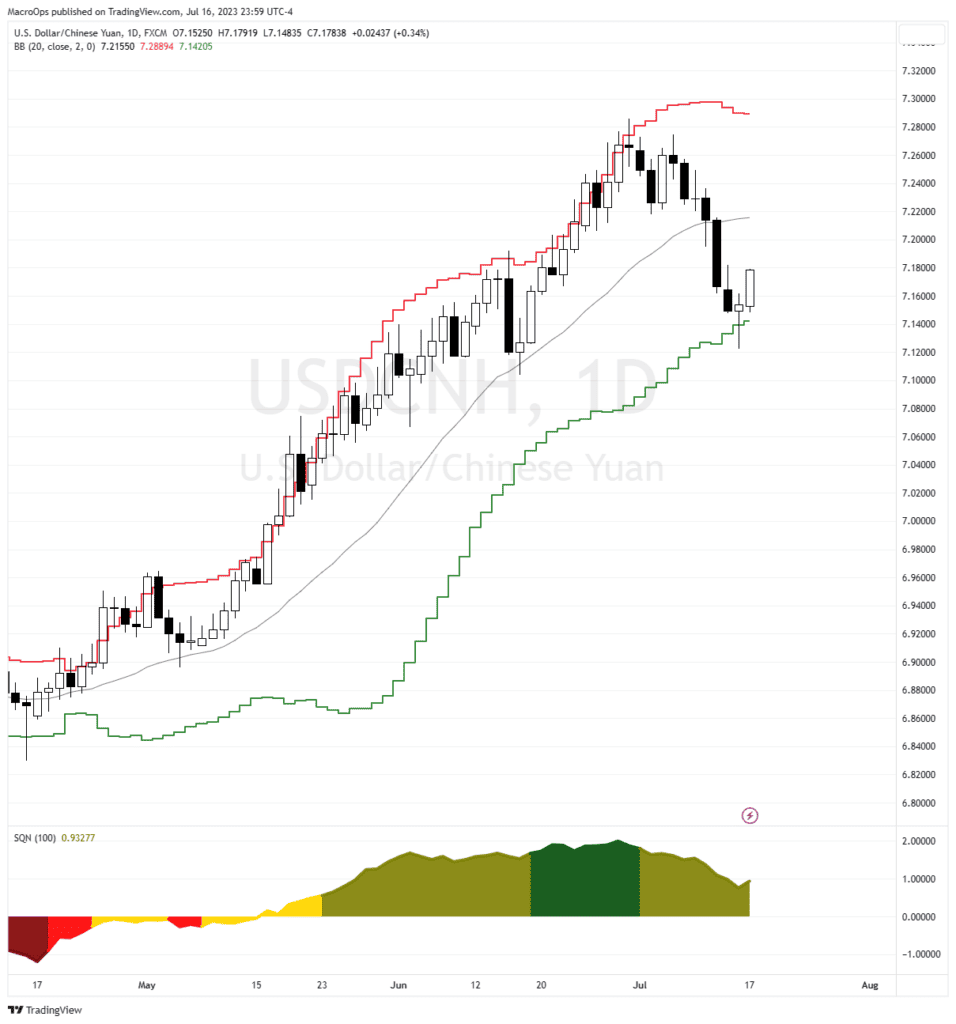
12. We were long USDCNH for the past few months (written about in a DD from May) but began taking profits over the past two weeks due to trend extension, a heavy tape, and US bonds looking ripe for a pop.
But we remain long-term bulls on USDCNH and believe it ultimately heads much higher. The current reversal at the lower Bollinger Band gives us a good technical point to try and reenter, jam the stop tight below Friday’s low, and get some size on with very little risk.
Thanks for reading.