***The Following is an excerpt from a Market Note recently sent to Collective members. Click here to learn more***
A short note on oil. Short notes are better than long notes. At least when it comes to analyzing a trade or positioning. If you have to Tolstoy the pitch then you don’t know what the key drivers/risks are.
So I’m going to give you my high meat/low-fat thoughts on the oil market. And I’m going to do it by walking you quickly through my broad framework for analyzing the space.
First, let’s start with the fundamental macro backdrop.
I, like a few other macro punters, started laying out the secular bull case for oil and energy assets back in late 17’ (link here). I then just basically kept updating it every few months. Three years passed and the crude market was right around the same price as was when I had first started writing about it; albeit with incredible volatility in-between.
I share this because it’s important to acknowledge that when it comes to macro and making big fundamental calls on things, such as the start of a new secular bull trend in the world’s energy markets, that we do so with heavy humility — and confirming technicals — because in trading, right but early is just as good as dead wrong.
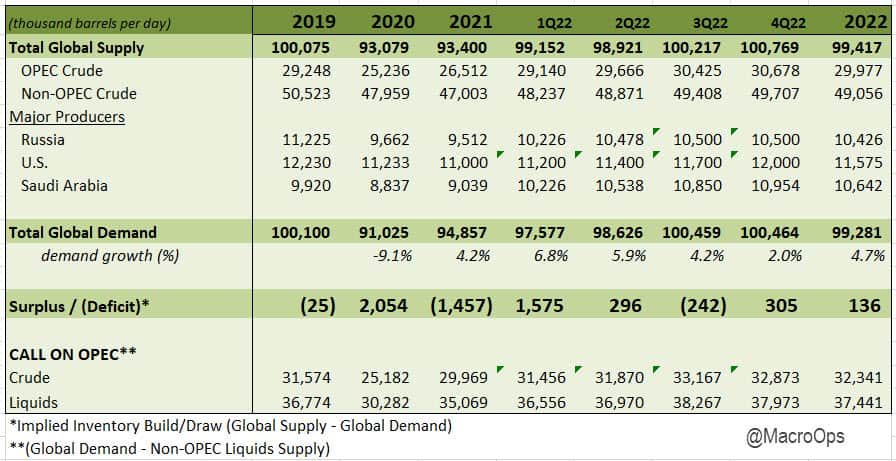
Also, the global oil market is incredibly complex. There’s too many inputs affecting supply and demand (especially present day) that however well researched our fundamental thesis is, there are 101 things that can and probably will come out from left field and dramatically change the math. Case in point, this basic supply/demand model… didn’t quite price in the whole war in Europe thing back in Jan, so those supply numbers from Russia are laughable now.
So here’s how I think we should frame fundamentals and macro in the case of oil…
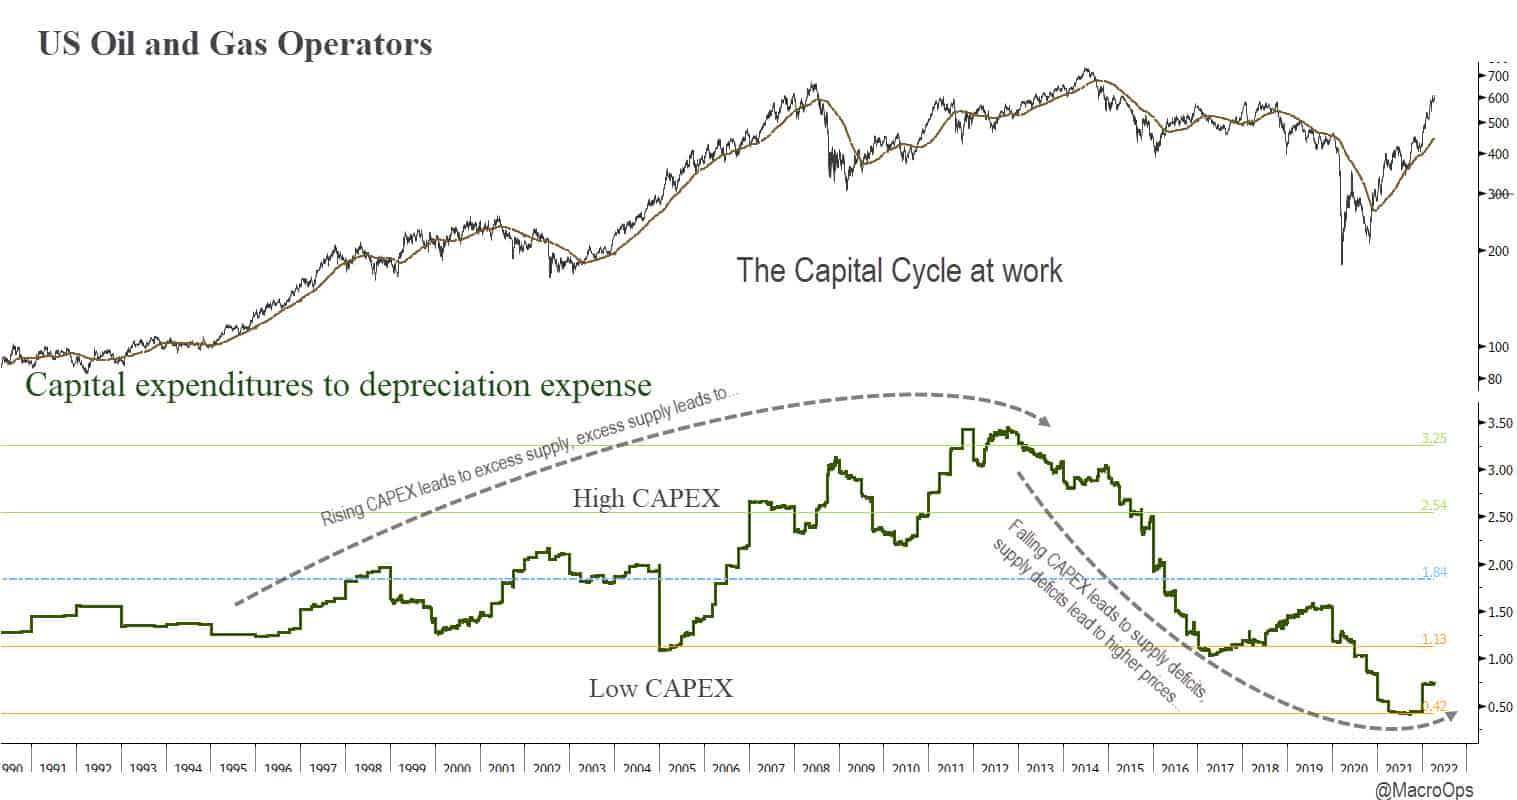
They’re useful in helping you weigh probabilities and assess the range of potential outcomes. In oil’s case, the fundamental macro driver was and still is the CAPEX Cycle. The dearth of investment into future supply, due to a host of reasons (investor enforced capital discipline, ESG, regulations, etc…) that were true in late 17’, and are even more so now.
What we can gather from this picture is (1) the skew of potential outcomes is strongly asymmetric to the upside; note the level of CAPEX/Depreciation that the market last topped out at Iin 13’ versus where we are now, and (2) we want to continue to focus on this space and parallel opportunities, size more aggressively than normal, and use large shakeouts to add as the trend has a long ways to go.
However, this fundamental macro information tells us little in the way of anything presently actionable other than giving us contextual input (as noted above) into a larger framework for making decisions.
There’s still a host of fundamental unknowns…
Big potential demand shocks such as Shanghai-style lockdowns spreading to other regions of the country or increased geopolitical volatility driving further positive supply shocks, etc… (sidenote: have you guys been following what’s going on in Shanghai? It’s some dystopic Orwellian stuff, we need to keep a close eye on this as it has the potential to spiral into something significant. Check out this video and read this thread).
The point of the exercise is that we’re building out contextualized possibilities so we can assign probabilities to them, which we then continuously update as new information comes in. It all comes back to my favorite trading quote from Market Wizard, Bruce Kovner:
One of the jobs of a good trader is to imagine alternative scenarios. I try to form many different mental pictures of what the world should be like and wait for one of them to be confirmed. You keep trying them on one at a time. Inevitably, most of these pictures will turn out to be wrong — that is, only a few elements of the picture may prove correct. But then, all of a sudden, you will find that in one picture, nine out of ten elements click. That scenario then becomes your image of the world’s reality.
We can take the fundamental CAPEX story and then look at oil’s historical relative value. Gold is good to use for this since it tracks the expansion of the monetary base over time. And looking at the 100-year history of oil versus gold, we can see that it’s very cheap, still well below the 100-year average…
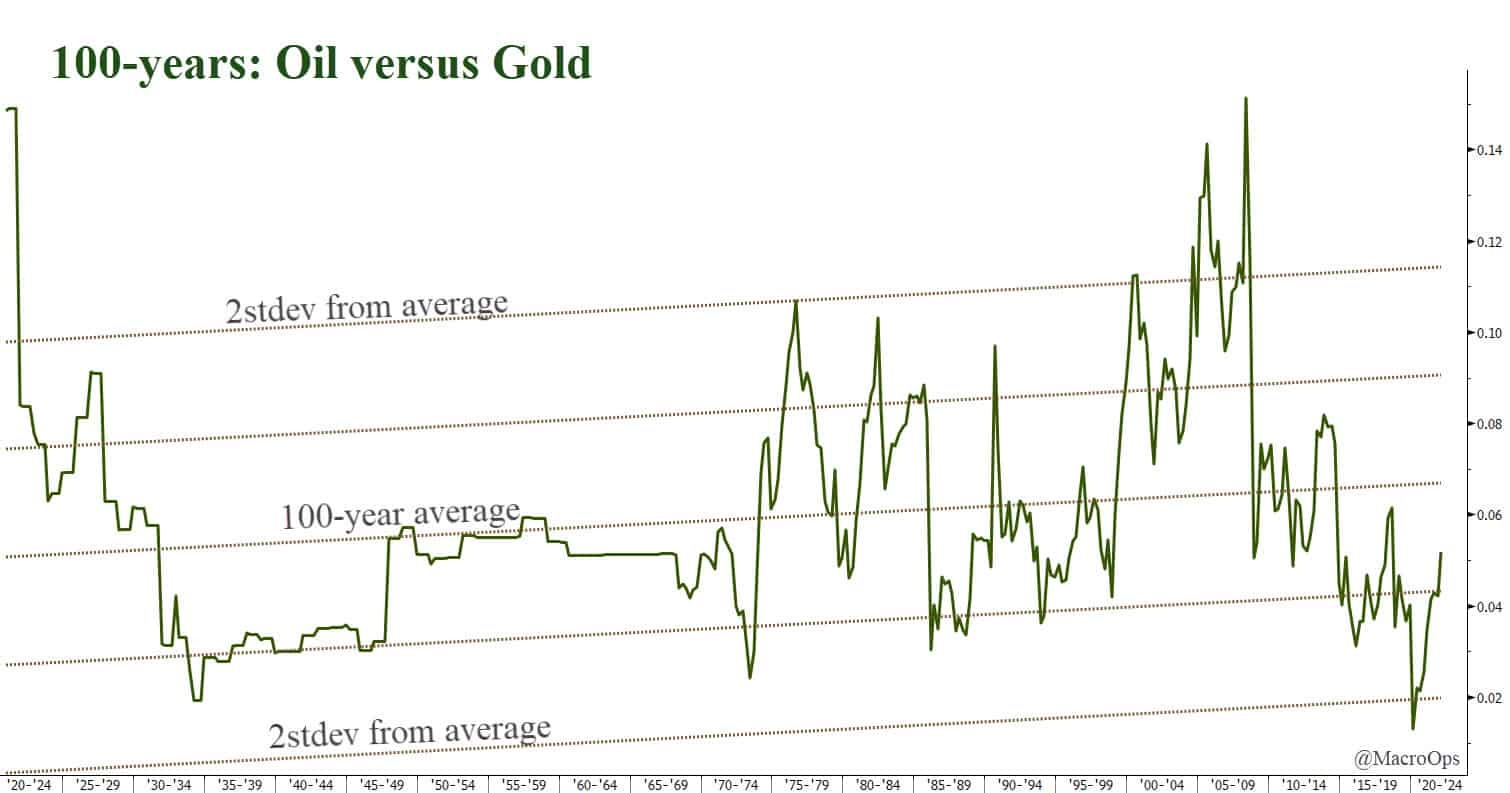
With this context, we can imagine a possible — probable even — outcome where oil sells for $250bbl in two years’ time. Hell, $400bbl is reasonable considering the backdrop… And this is where my macro fundamental analysis ends.
I’ll, of course, continue to pay attention to the demand/growth side of things but I don’t care to model out the exact export and inventory numbers, etc… That’s getting too into the weeds, and doing so becomes a negative returning exercise at some point. Too much macro fundamental work leads to false confidence and a general unwillingness to change one’s opinion. Both of which are deadly in this game.
We operate by the K.I.S.S axiom. It served me well in the military and continues to do so in markets. The nerds can have their spreadsheets, most of them are playing the “I’m so smart game” while we ruthlessly play the “don’t care, make money game,” but I digress…
So now we have an idea of what could be. But this is worth frack all from an actionable standpoint other than to know generally that we want to be long oil.
This is where technicals and sentiment/positioning come in. They don’t give us certainty, but they give us probabilities and technical go/no-go points from which we can make informed bets given our macro bias.
Starting with the technicals, we have a steady Bull Quiet SQN regime. And the Dec 23’ contract (which we own) is in a sideways wedge consolidation.
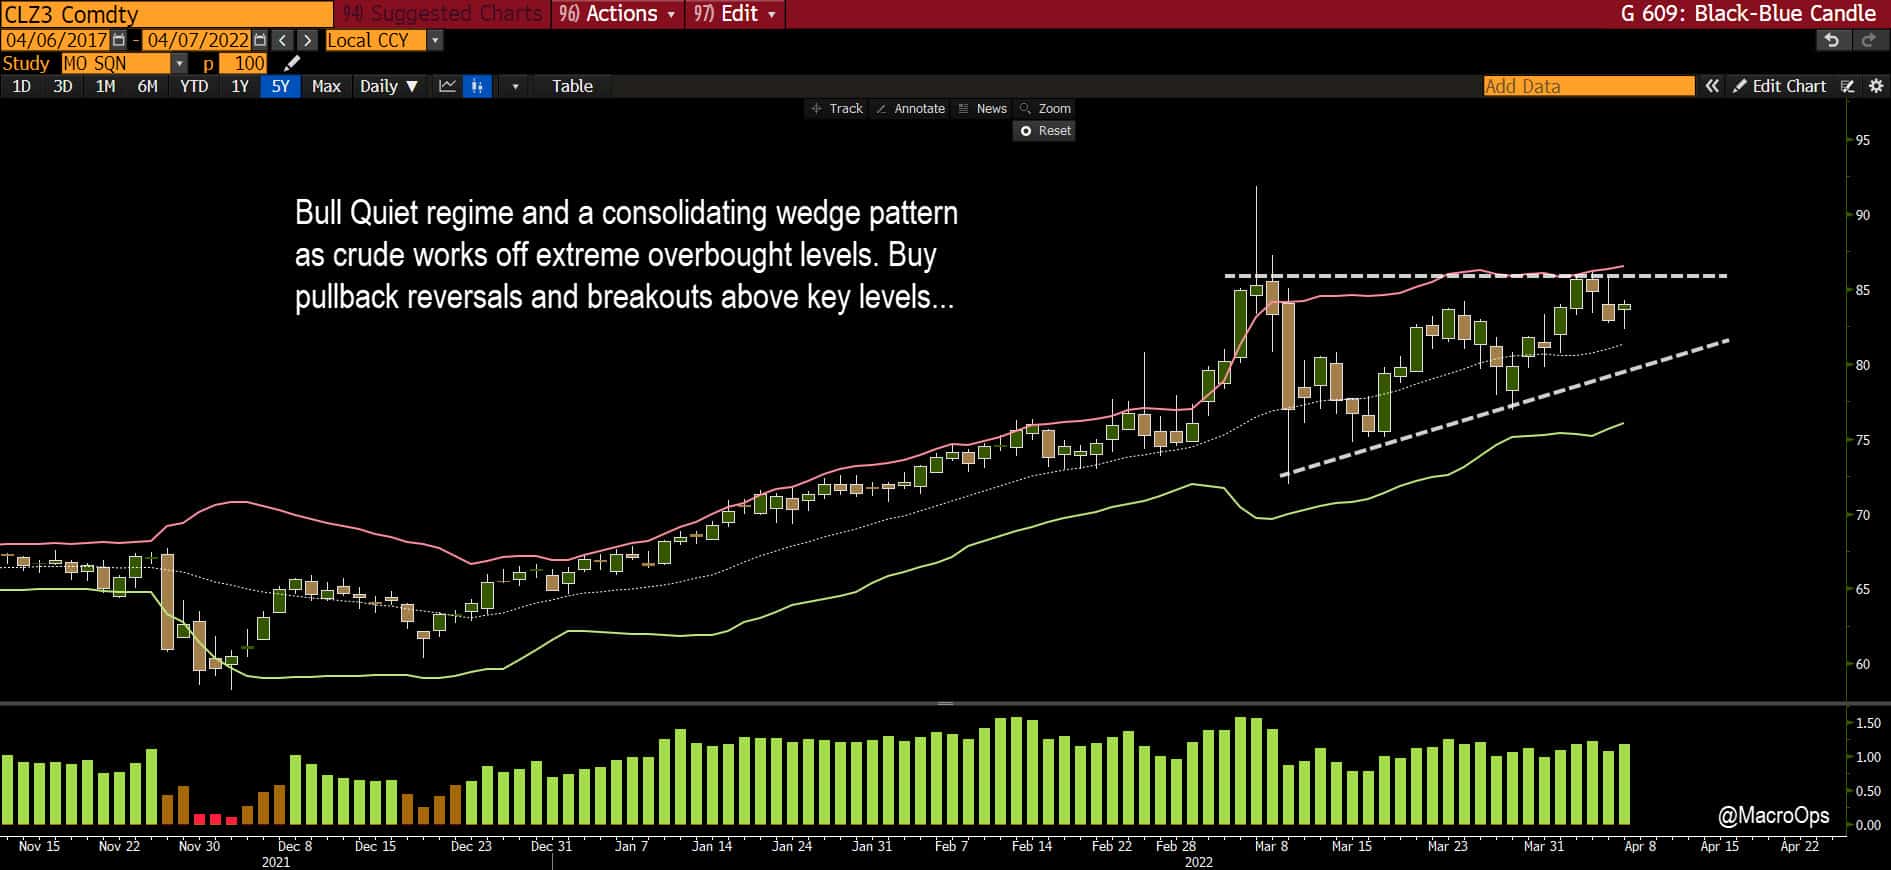
The market is consolidating sideways after hitting extreme overextension (see chart below). When something is consolidating within a Bull Quiet regime, we generally want to buy/add near the bottom of that sideways range and/or buy on breakouts above it.
Since we’re already quite long, we’ll wait till we get a breakout above the current range to add again. If the price breaks below, we can cut or pare back our position and wait for another technical entry point.
Remember, three forces are always at work on price (1) Trend (2) Momentum, and (3) Mean reversion. When an asset becomes extended from its moving averages, sellers begin to take profits and buyers turn more hesitant. Combined, these act as a countervailing force working to pull the asset back to its averages (20, 50, and 200dma).

Major extensions like this are both bullish and bearish. They’re bullish in the sense that they show extreme momentum and a large imbalance of buyers vs sellers, which is historically a positive sign for a long-term trend. It can be bearish in the short term because it makes the trend susceptible to large shakeouts.
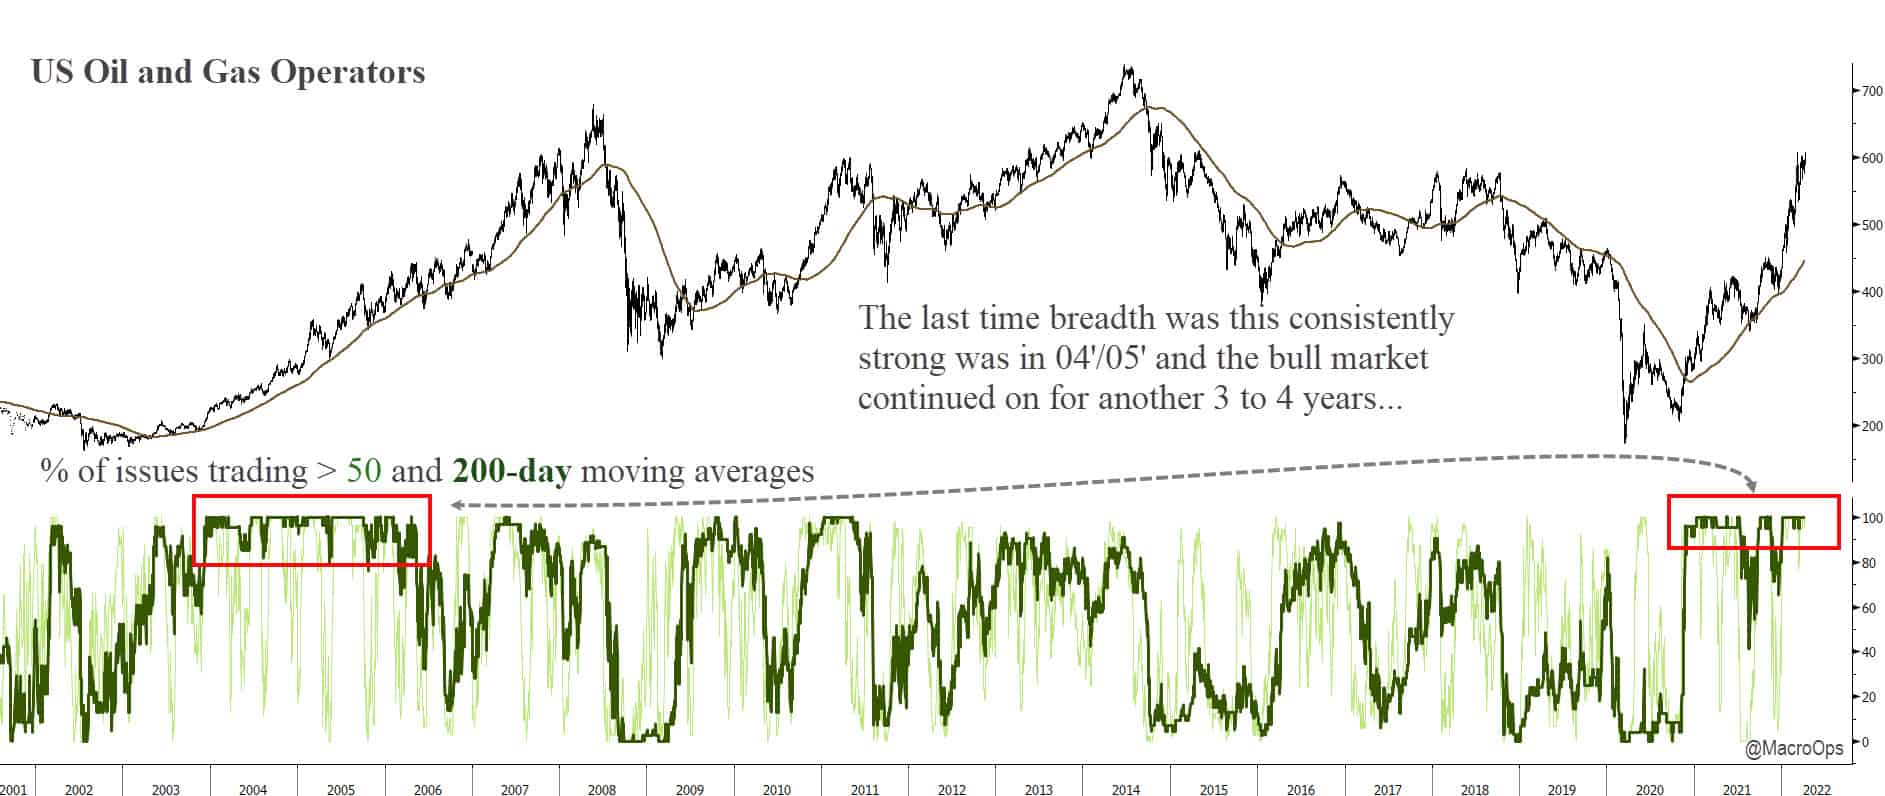
Then there’s breadth, which if you recall from the Hierarchy of Market Technicals can be thought of as this:
A good way to think of market breadth is like an advancing military force. Strong breadth is similar to an army with a deep and disciplined line (this is an old-school battle where fighters stood shoulder to shoulder). That line has strength and weight behind it. It can move and push through barriers.
On the other hand, when the line is thin and begins to fracture. It doesn’t take much from the opposing force to break it completely. This is how major trend changes happen. Each issue in an index is equivalent to a soldier standing on that line. And that is what various indicators of breadth aim to measure.
The energy sector’s advancing line is incredibly strong. The last time energy breadth showed this level of consistent strength was back in 03’-to-04’ which was the start of a major bull cycle in oil and gas.
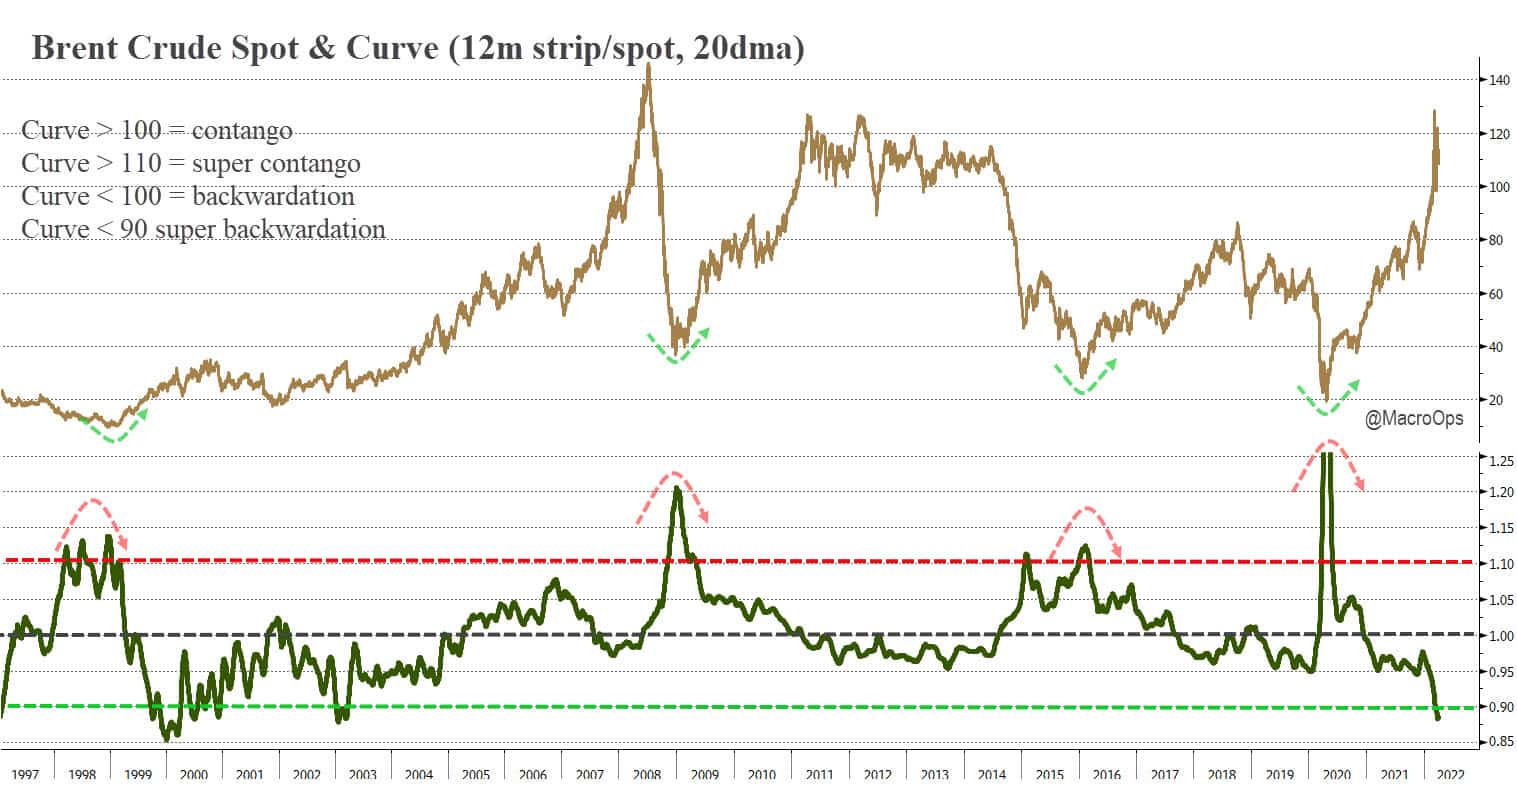
To look at sentiment and positioning we can first turn to the curve.
Below is the 12-month strip to spot curve for Brent crude. It’s currently in super backwardation, which is generally bullish. The curve gives us a bearish signal when it starts steepening and first crosses into contango. Its most bullish reading is when it turns and begins trending lower from super contango.
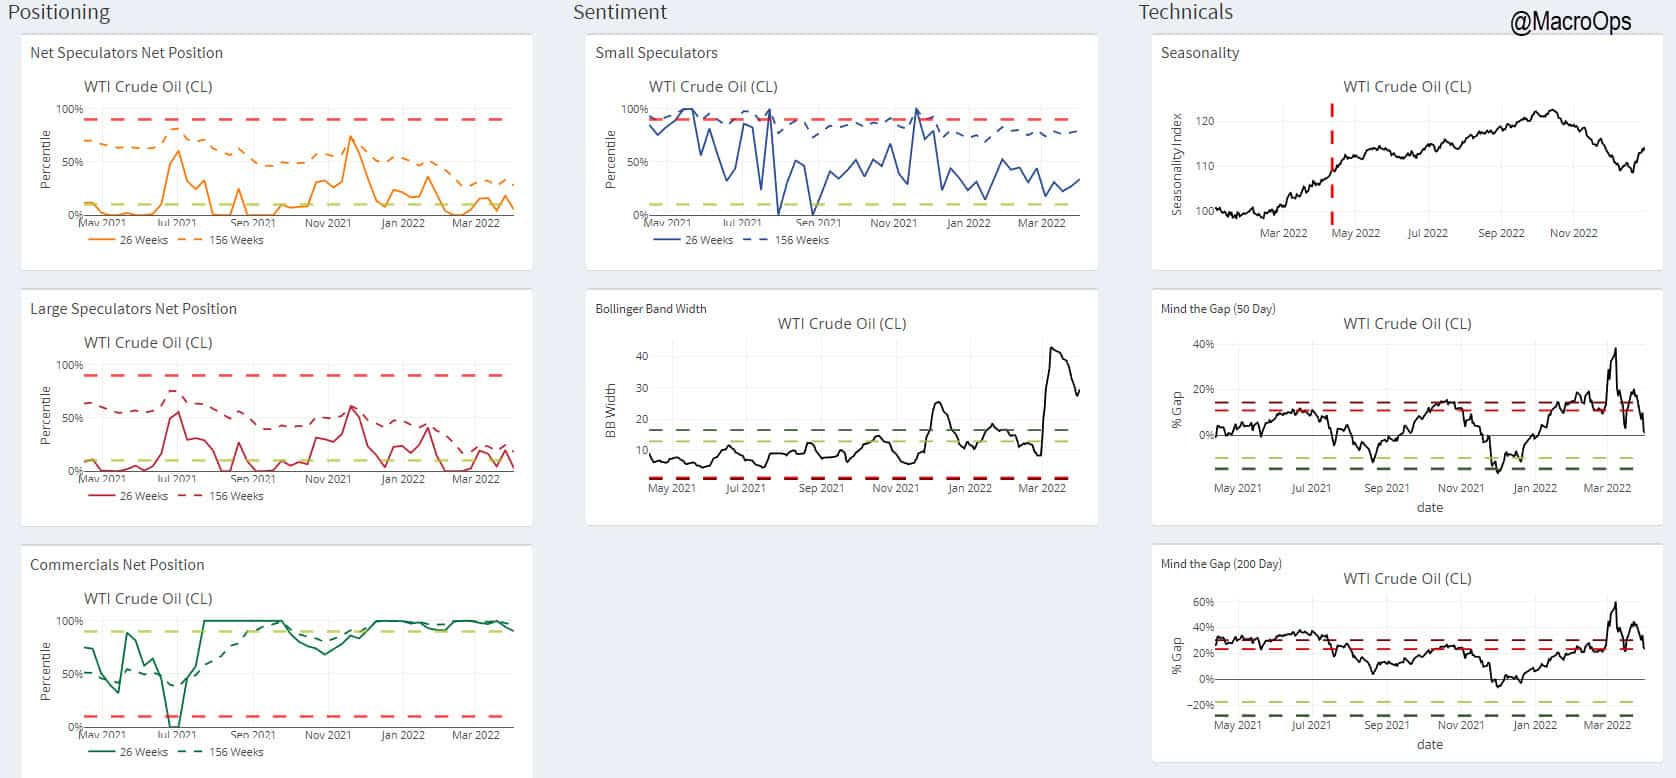
Next, we can turn to our HUD to look at CoT and seasonals. Net specs remain surprisingly crowded short, with hedgers in the 90th+ %tile long. Seasonals remain supportive over the next couple of weeks but then turn neutral to slightly bearish from May through to the end of June.
And so there we have a not quite short but not quite long either, review of the oil market. My summary takeaway is this:
- The future path for oil over the next 3-5 years skews extremely bullish. $250-$400bbl is in the realm of reasonable outcomes. I know that reads as hyperbolic but as traders, we need to be able to imagine wildly divergent futures, especially when they’re supported by the evidence.
- Breadth and technicals confirm we’re at the start of a major bull cycle.
- That doesn’t mean there won’t be painful retracements along the way. And with the current record levels of overextension, we should be prepared for one to come along sooner than later, maybe the China-COVID story is the catalyst, I don’t know.
- But crude is still in a Bull Quiet regime (markets tend to top in Bull Volatile regimes) and the trend is clearly up. It’s been working off its overextension in a sideways consolidation. We want to buy at the bottom of this range and buy on a breakout above it.
- If price breaks below, we can cut or pare back our long positioning and wait for a technical setup to add.
- US E&Ps are expected to produce $70bn in FCF this year. Estimates have $51bn being returned through dividends and another $15bn in buybacks, significantly higher than the peak in 13’. The energy sector is entering a cash bonanza and things are just getting started….
If you’d like to join us in our market adventures and our hopeful upcoming shopping spree, then click the link below and sign up for our Collective. This is shaping up to be one of the most engaging macro environments in over a decade. There will be a LOT of money to be made and lost if you don’t know when to hedge your risk and cash your chips. Enrollment to our group closes this Sunday at midnight. So if you’re thinking about joining the team, make sure to do so before then. Hope to see you in there and happy hunting!
Join the Collective
Give me a holler if you’ve got any questions or comments.
In the meantime, stay frosty and keep your head on a swivel.
-Alex


