Summary: Just a short one this week. I’m traveling back to my home in Costa Rica and my first leg didn’t have wifi, so here we go… The evidence still points to the pain trade being higher, but rotation looks likely, with overpositioning in the AI trade crossed against underpositioning in everything else, especially smallcaps, which may see relief on a rebound in deeply oversold bonds. We go over more late cycle charts and what needs to be tracked to stay on top of the signals that will tell us when this cycle is over.
*** Housekeeping note: As some of you know, the MO team recently joined an established asset management firm to manage capital utilizing the MacroOps investment process — if you are a qualified purchaser (please see attached description) and are interested in learning more, please let us know.
We’ve also recently expanded the team — bringing Dean Christians on board — and are in the process of merging our companies.
In November, MacroOps will relaunch with a new brand, website, and interactive quantitative dashboard featuring our models and proprietary historical datasets.
With these changes, we’ll be more than doubling Collective pricing at the relaunch to preserve the size and quality of our community. If you’ve been on the fence, now is a good time to try it and see if it’s a fit.***
MO Portfolio & Trades
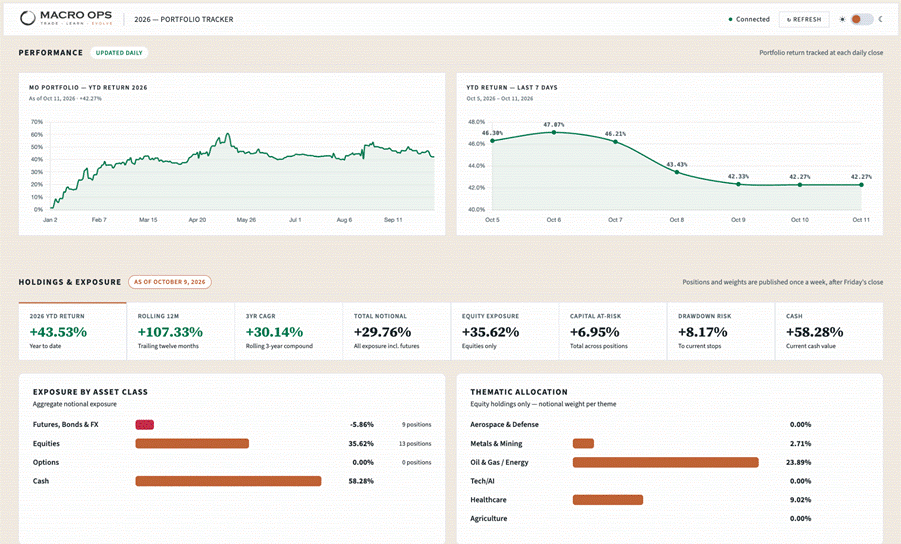
1. The portfolio fell -403bps last week, leaving us +42.27% on the year, below our ytd high-water mark of +61%. We’re long the Nasdaq, ETHUSD, semis, crypto miners, commodities index, US dollar, and some select biotech plays.
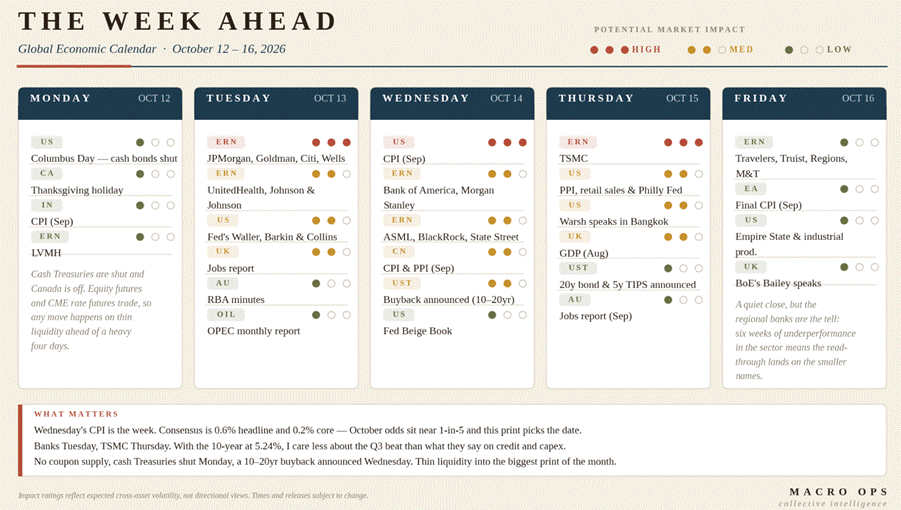
2. The week ahead in data. September CPI on Wednesday is the week’s decisive release. Markets price roughly a one-in-five chance of an October hike and better than even odds for December. A firm core reading would bring the October meeting back into play.
Earnings open Tuesday with JPM, GS, C, and WFC, followed by TSM on Thursday. Financials are down 7.5% over the past month while the SPX trades near record highs, so commentary on credit quality and capital markets activity should carry more weight than the headline results.
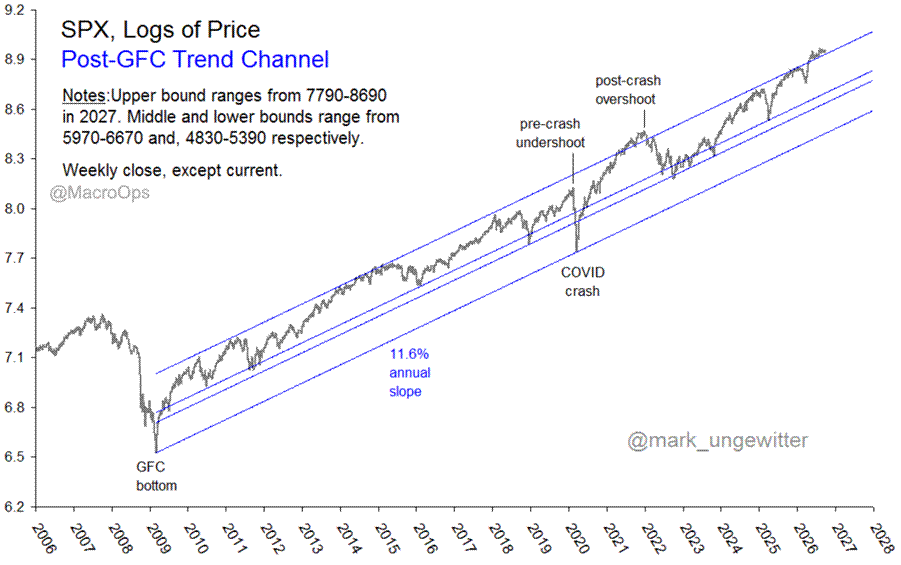
3. Good chart from @mark_ungewitter who notes, “SPX multi-decade trend channel offers three scenarios: 1) Imminent mean reversion; 2) Mean reversion following further overshoot, perhaps in the form of a classic Q4 rally; and 3) Durable new advance altering multi-decade behavior.”
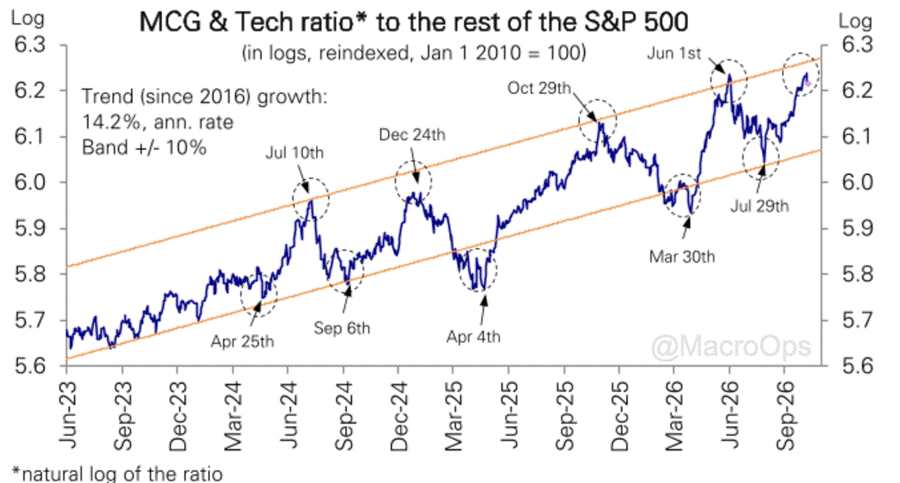
4. DB’s latest positioning report suggests some rotation might be on the cards, noting, “The Tech rotation has run far and the risk-reward no longer looks favorable in the near term. Last week we flagged that the rotation into Tech that began in late July, the 5th in the last 2 years, was approaching the top of its long-run trend channel, a level from which it has turned several times previously. Tactically, the risk-reward no longer looks favorable, with about 4pp of outperformance to reach the top but potentially 16pp of relative downside if the pattern of rotations near the edges of the channel holds. We note that prior rotations have been inverted V-turns.”
We agree.
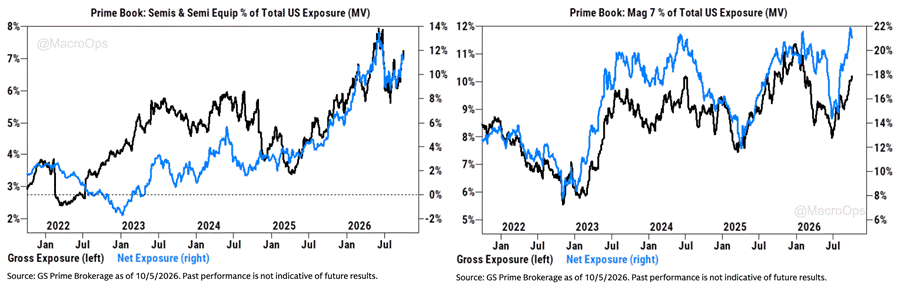
5. Current cross positioning certainly supports this. From GS: “Clients have certainly re-engaged in tech as a result of this macro uncertainty. Chart 2 shows that net exposure on our prime book to Mag7 as a % of Total US exposure is near 22%, which is the highest on record since the start of 2022. Chart 3 shows that Semis and Semi Equipment as a % of Total US Exposure now sit at ~12% (vs a peak in June of 14% but also vs starting the year ~6%). Our prime data shows that US Tech stocks in September had their largest % buying in a month since Feb ’25 (and were the only sector net bought on our prime book in the month of September).”
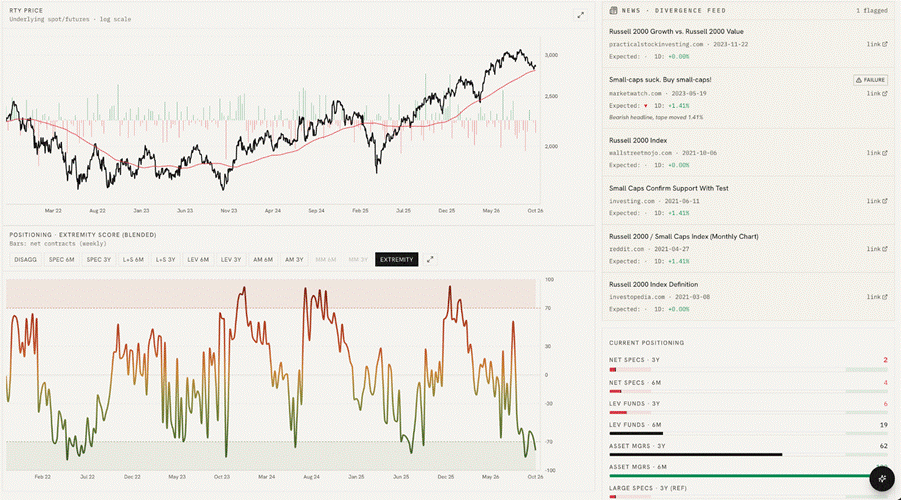
6. Meanwhile, our RTY positioning score is below the -75th %tile. A level that has marked significant bottoms in the past.
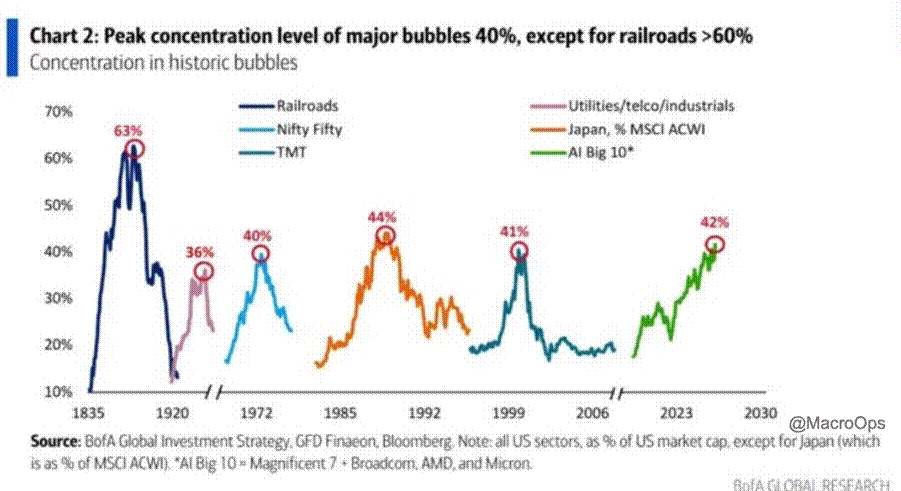
7. The “Big 10” AI names have reached a level of market concentration that has marked every previous bubble of the last 200 years, outside of the railroad bubble, which climbed to 63%. This is not reason by itself to be bearish. Just useful context for where we’re at.
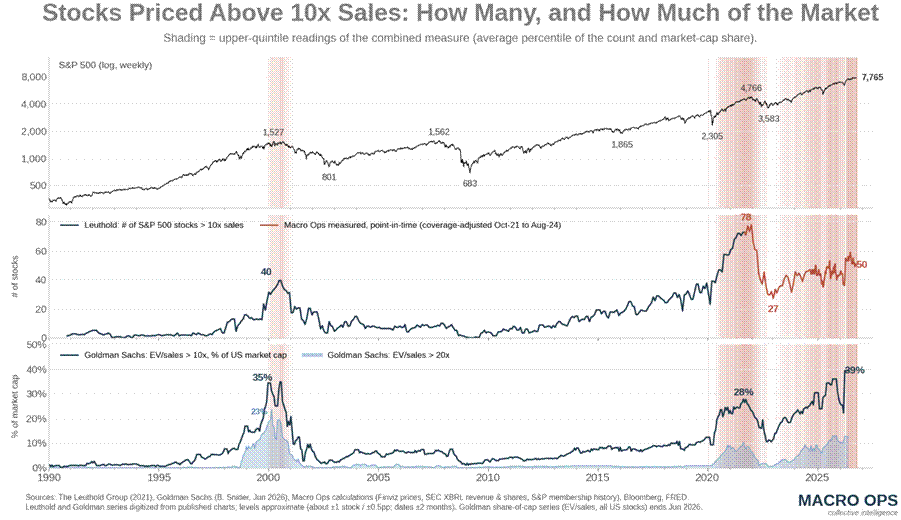
8. 39% of US market cap is now trading at over 10x EV to sales, which is 4% higher than what we saw at the peak of the dot-com bubble.
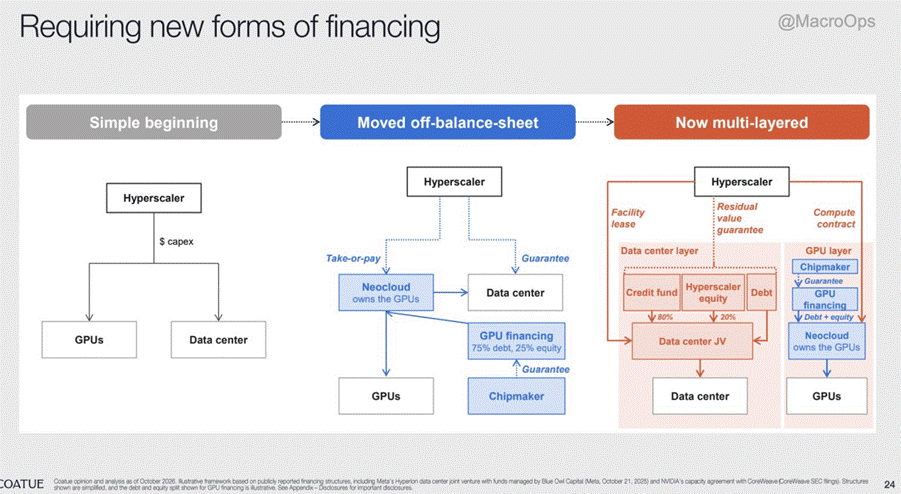
9. Coatue recently put out a good deck on the AI space (link here). One thing they point out is that AI financing is evolving from “Big Tech pays for its own servers” into a multilayered system of leases, joint ventures, private credit, guarantees, and supplier backstops. The implication is that the AI boom increasingly depends not just on demand for compute, but on who can finance it, and who ultimately absorbs the risk if the economics disappoint.
A tell-tale sign of all late cycles is new “innovative” and increasingly complex forms of financing.
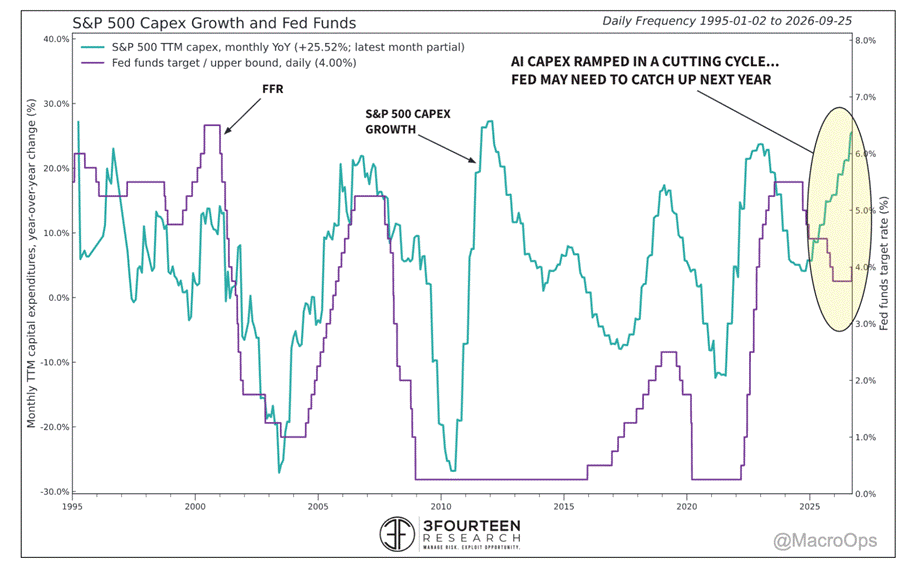
10. What will kill this late cycle then? The same thing that kills all cycles: tightening financial conditions, stemming from a Fed forced into a hiking cycle by increasing inflationary pressures.
This chart from 3Fourteen Research shows the Fed likely has a good deal more catching up to do.
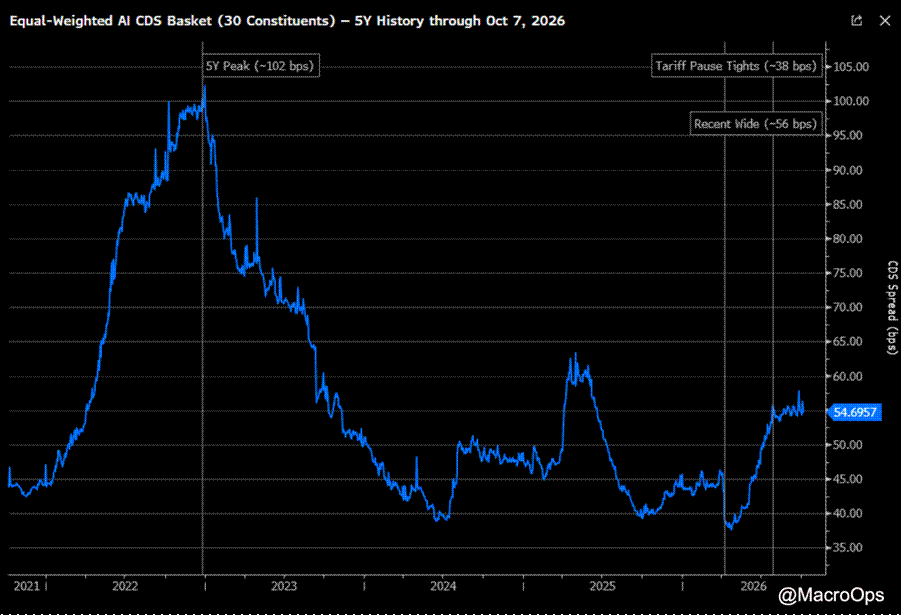
11. We’ll be paying close attention to our AI CDS basket below. It’s well off its early ‘26 lows but has been moving sideways for the past few months. This should lead, or at least confirm, the next move in risk assets.
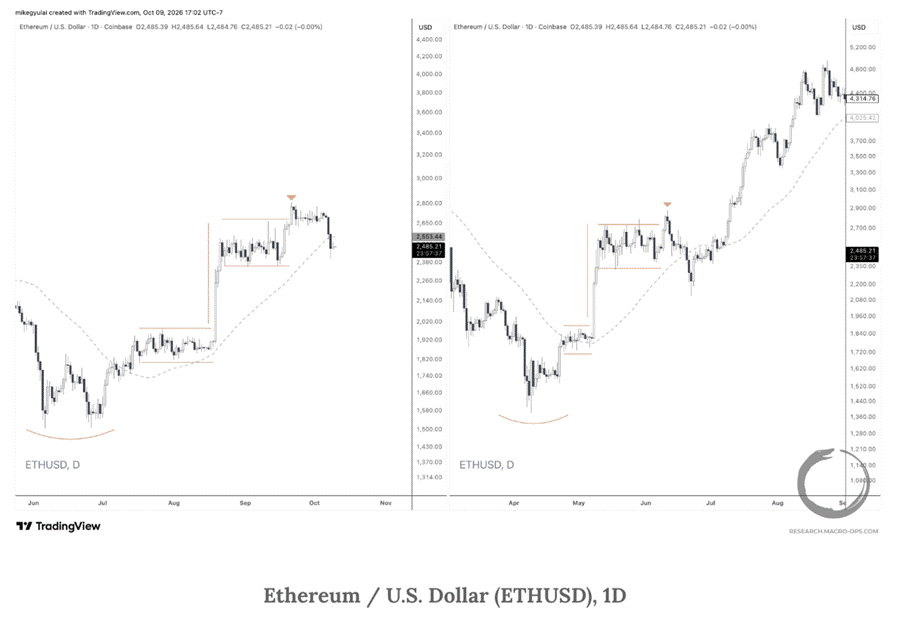
12. From my teammate Mike G’s latest weekly, “the ETH/USD analog to spring 2025 that we’ve been tracking for the last month continues to rhyme (link here).
Thanks for reading.