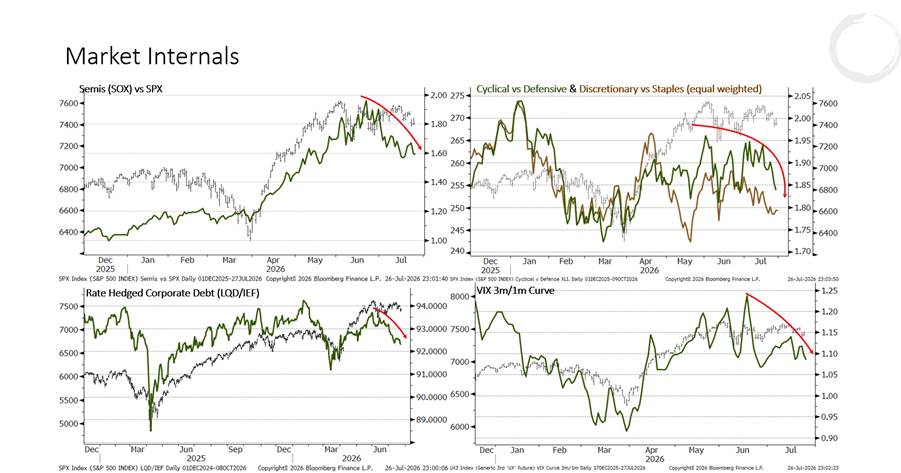
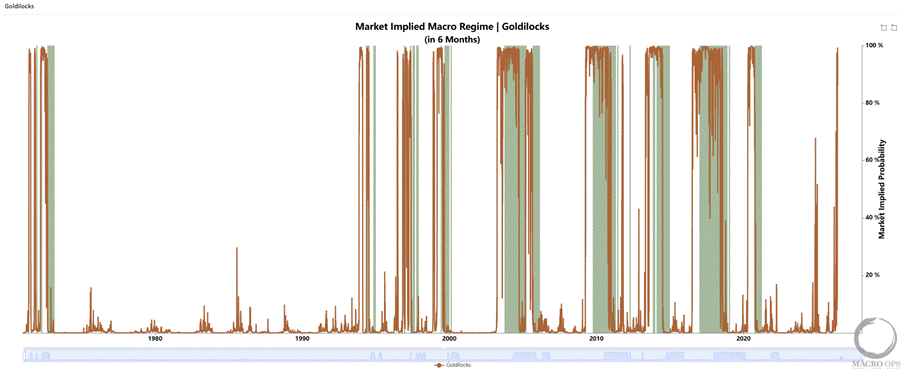
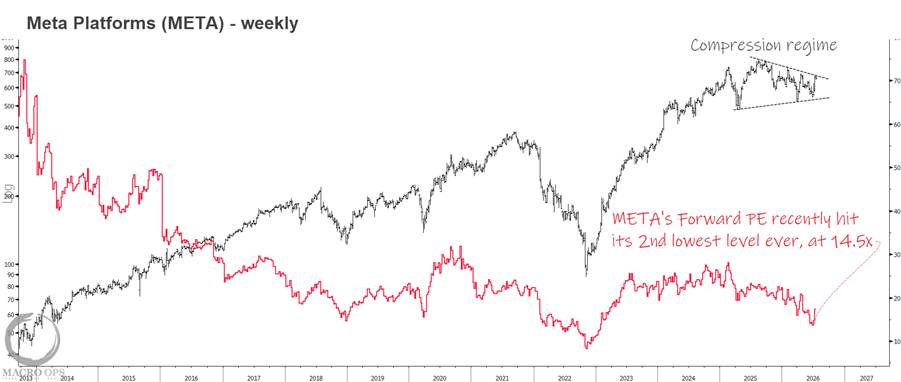
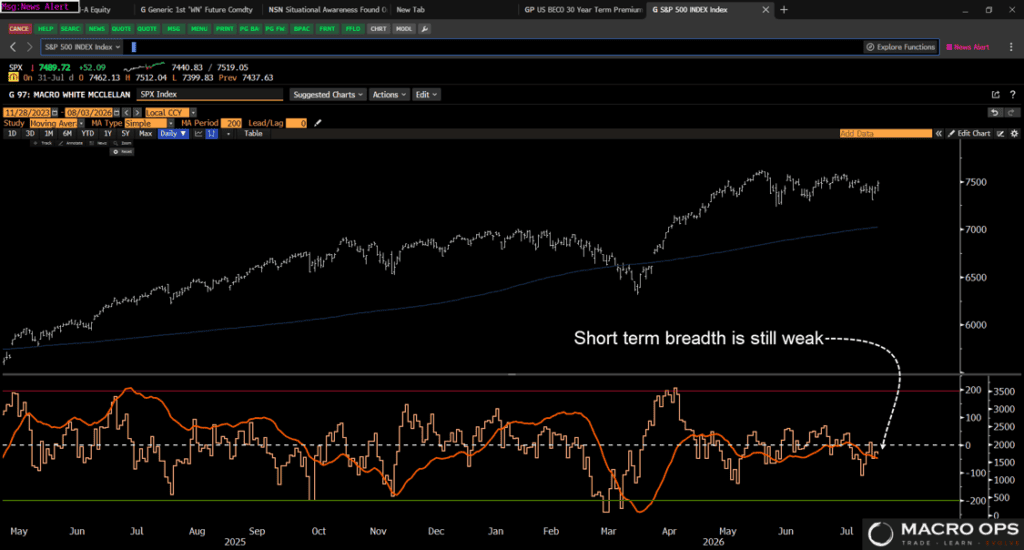
Summary: Internals, credit, and short-term breadth are still weak, though they bounced a bit into the end of the week. We’ll watch for follow-through next week.
Our bias remains for an eventual breakout to the upside in SPX as the backdrop points to rotation out of the crowded momentum/semi trade than the lead up to a broader correction. But until we get a catalyst, a real improvement in credit and internals, or a proper washout in sentiment and positioning, we’re not interested in aggressively trading these markets.
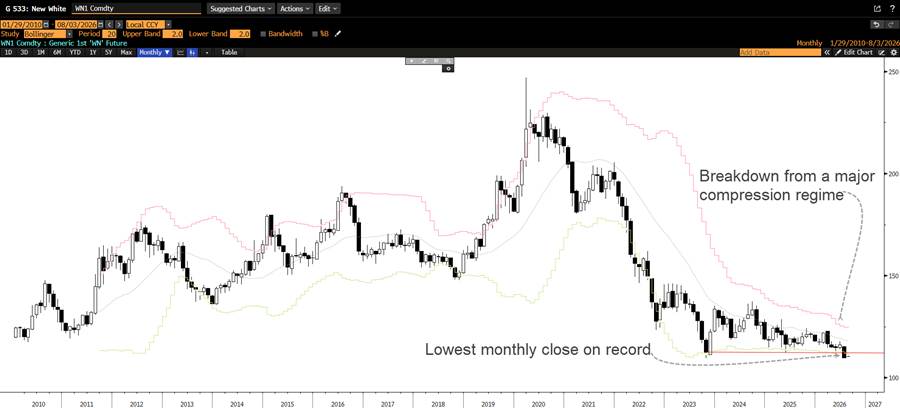
Good thing we’ve got other pools to swim in. Long bonds are breaking out of the major compression regime we’ve been tracking for months. We’re in a new secular regime for yields, and term premium is simply reverting to its historical average.
We also look at natty producers, some short-dollar trades, and a mystery in inventories…
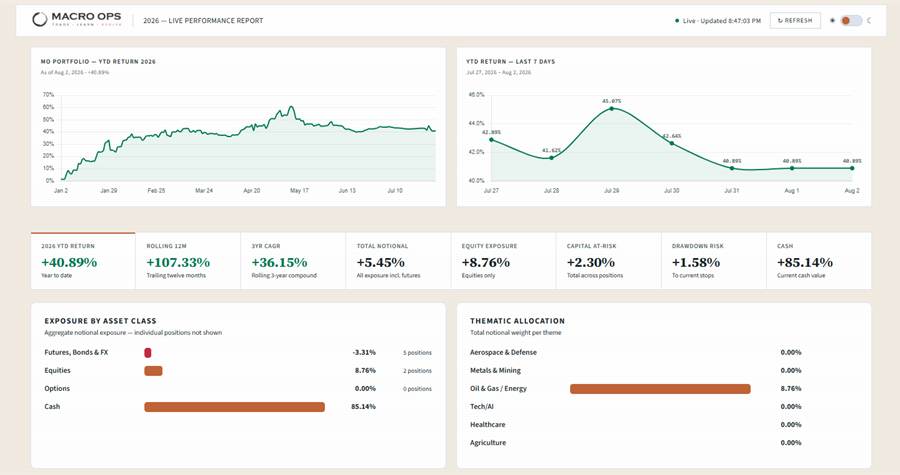
***The MO port is currently up +40% ytd in 26’. The Collective is where we discuss the theory behind the positioning, publish the differentiated research, track the book in real time, and argue it out with a global group of serious investors. If that’s your kind of room, join us in Slack. ***
MO Portfolio & Trades
1. The portfolio fell 200 basis points last week, leaving us +40% on the year, below our high-water mark of +61%. We continue to hold high levels of cash. We took profits Friday on our NQ short, and now just hold small positions in oil and gas equities.
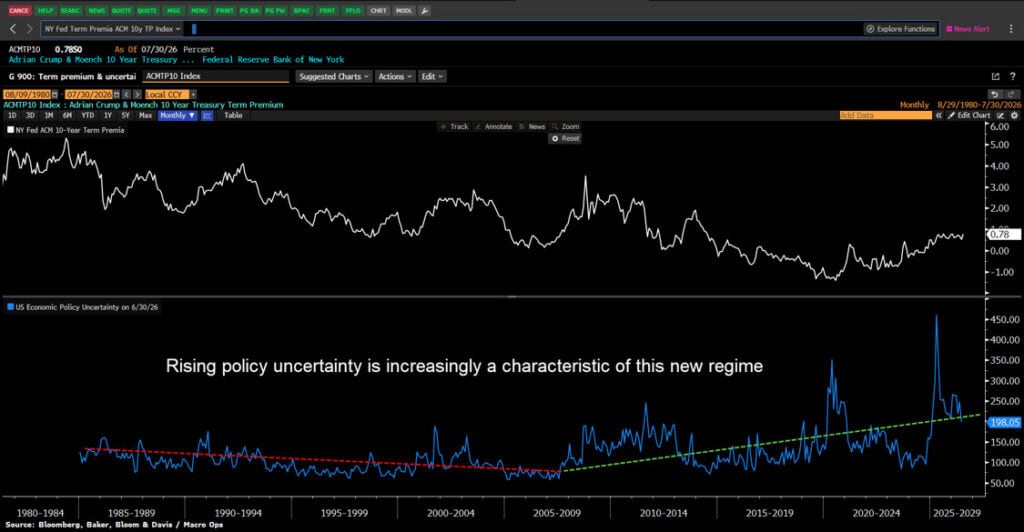
2. Ultra bonds put in their lowest monthly close on record, taking out their Oct 23′ pivot low. We’ve been tracking this setup for months now, making the point that it’s essentially the lagged inverse trade to the BCOM Index compression setup that kicked off in the Fall of last year. There are a number of macro drivers behind this one, but they all really center around term premium rising back towards its historical average (see charts below), as investors demand more pickup to compensate for the changing landscape. The primary reasons here being (1) large US deficits (2) JPY intervention (3) rising geopol/policy uncertainty (4) high inflation and rising inflation vol (5) Warsh-induced uncertainty at the Fed, and the list goes on (we are short).
I laid out the case for higher rates back in June, which you can read here.
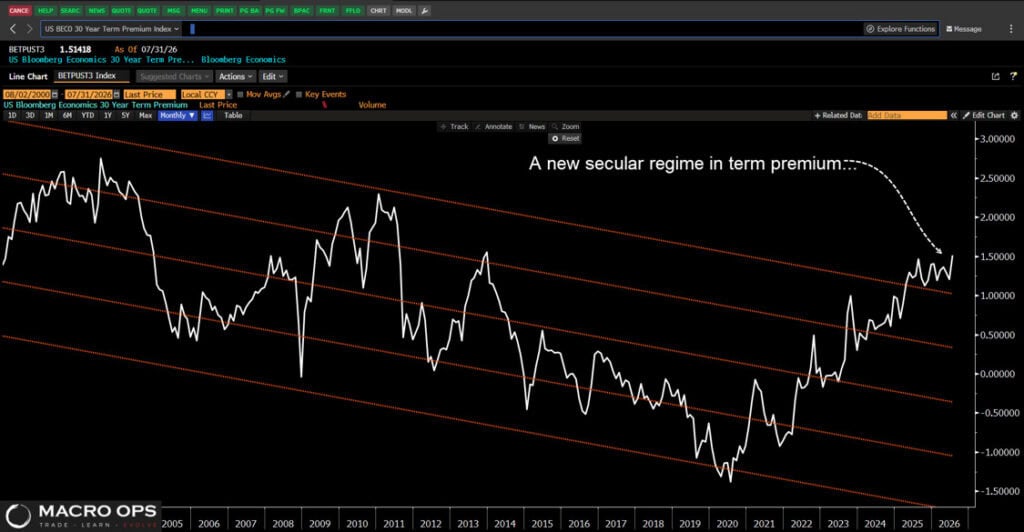
3. The term premium on the 30yr has broken out of the top range of its 25yr average, indicating we’re in a new secular regime in rates.
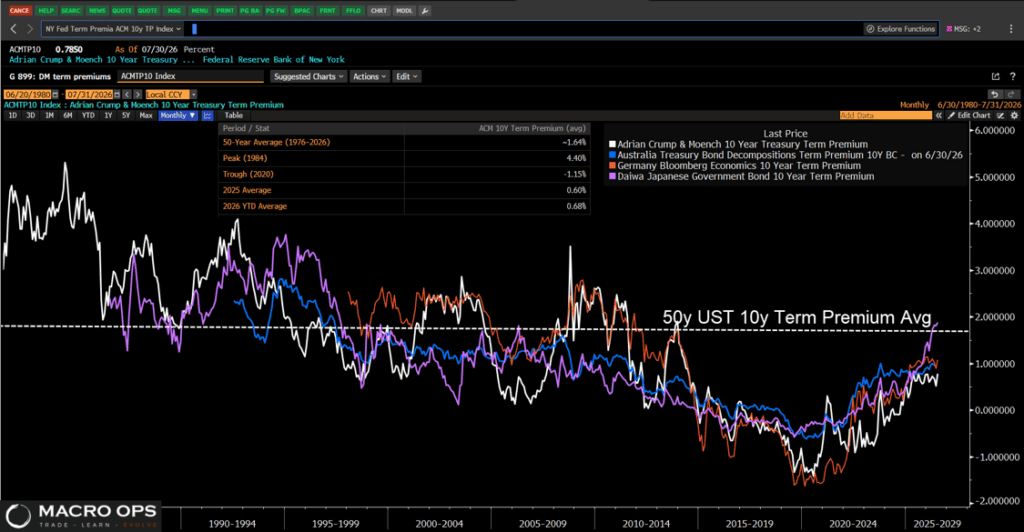
4. Term premiums across developed markets are rising, and leading the US higher. Current UST 10yr term prem is at 0.68. Its 50yr average is 1.64 or roughly 100bps higher.
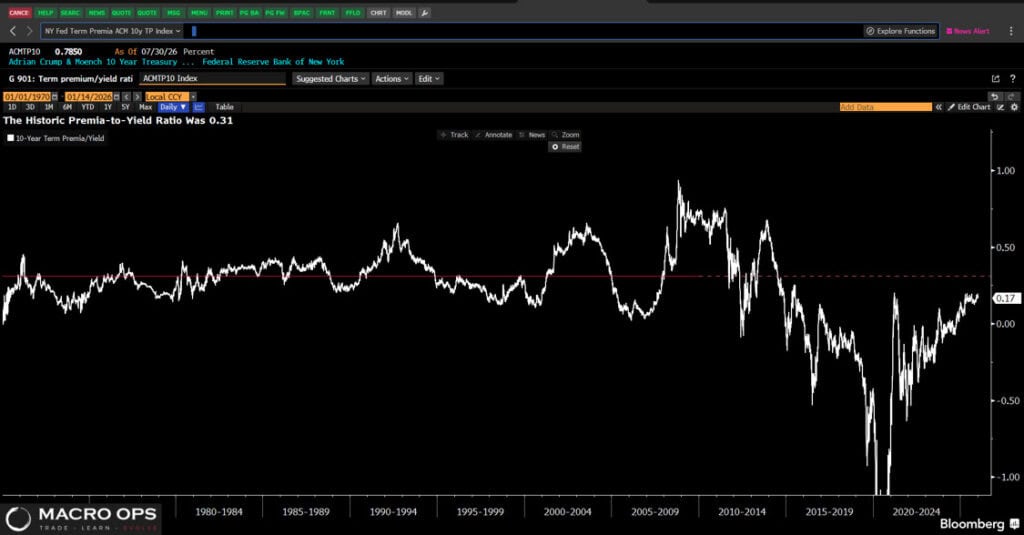
5. Another way to look at this is the UST 10yr term premium-to-yield ratio which currently sits at 0.17. Well below its historical average of 0.31.
6. We have entered a more uncertain world on many fronts and steeper curves are starting to reflect that. The chart below shows the 10yr term prem in white and the US Economic Policy Uncertainty Index in blue.
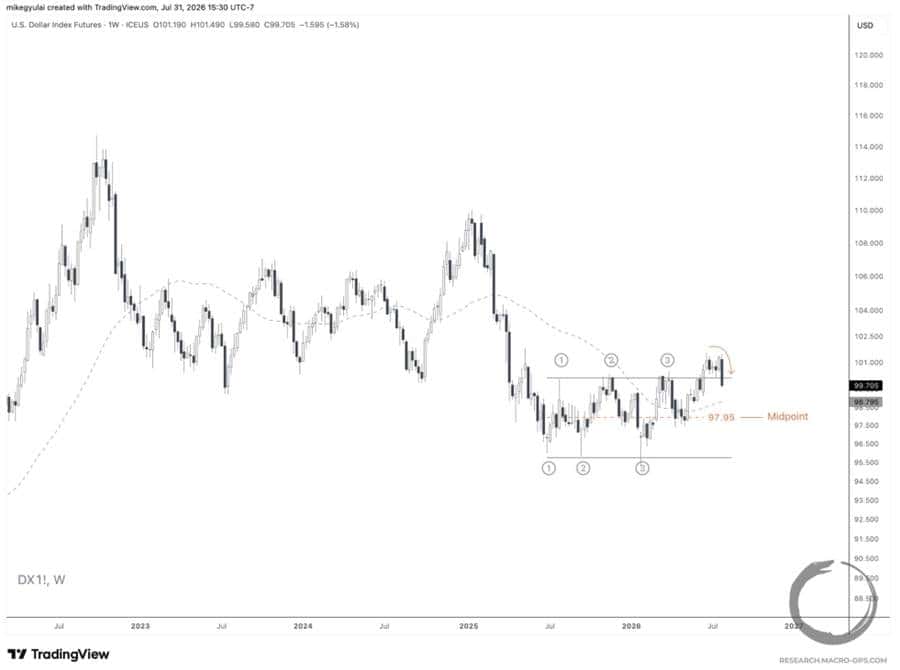
7. We got a bull trap in the DXY. Thankfully, we exited our long dollar position right after the Fed meeting last week, before Japan’s intervention in the yen. We’re now looking for short USD setups to play this breakout failure (chart is a monthly pulled from Mike G’s latest, link here).
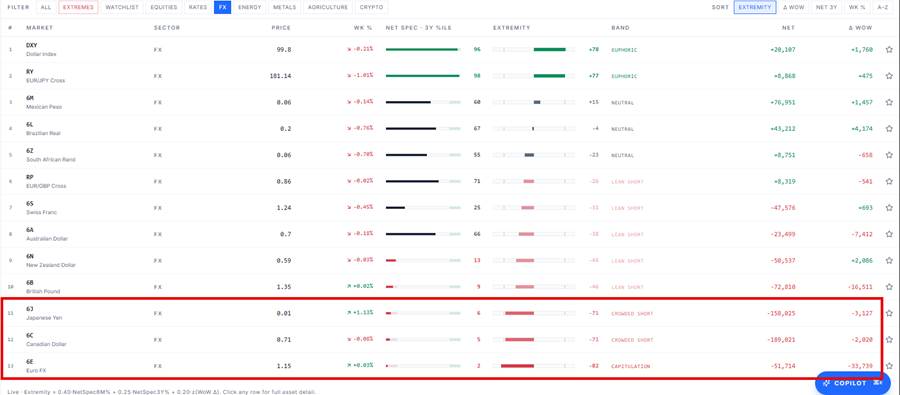
8. Here’s our dashboard showing the latest CoT positioning across all FX pairs. EUR, CAD, and JPY are all crowded short.
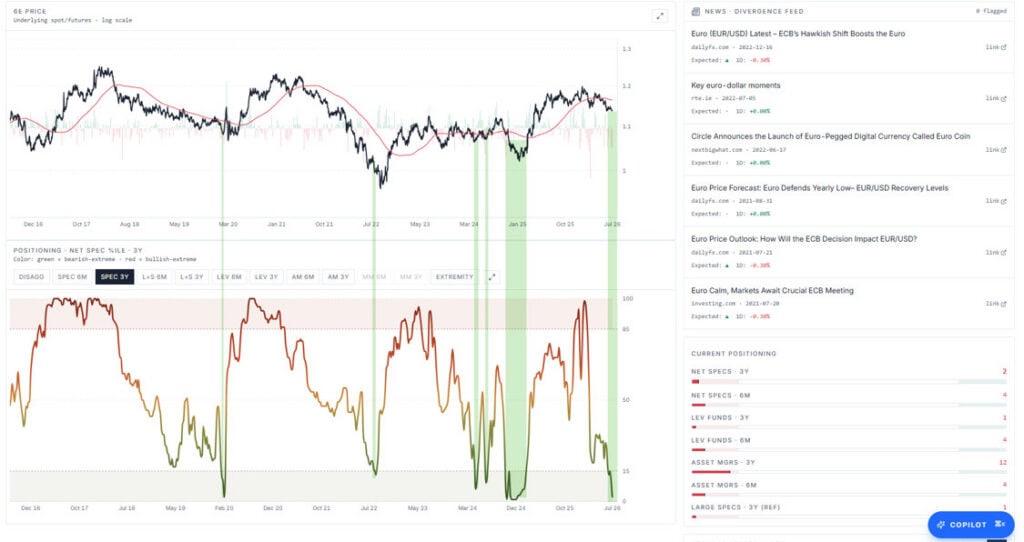
9. Here’s the 3yr percentile of Net Specs in EURUSD, the most heavily shorted of the bunch at the moment. Spec positioning is currently in the 2nd percentile. Green highlights mark prior instances where positioning crossed below 15%.
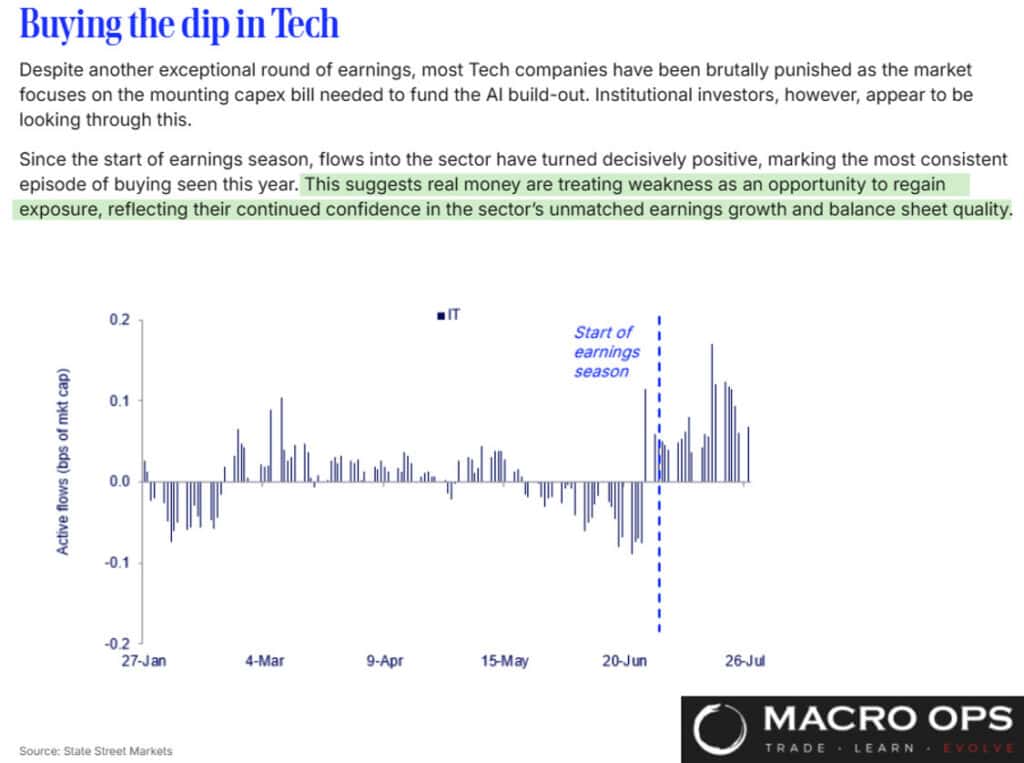
10. According to StateStreet real money has been buying this dip in tech.
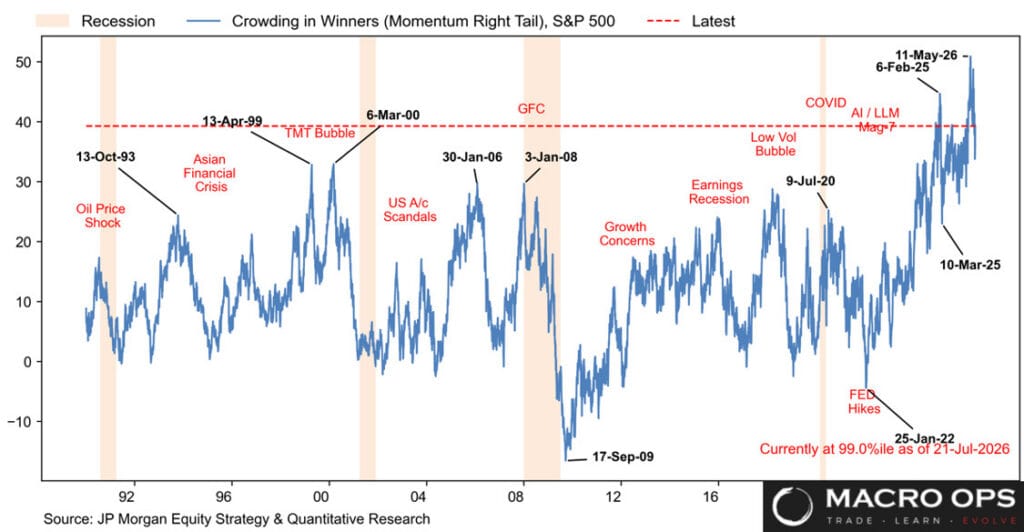
11. We’re mostly sitting on the sidelines of this market. We booked profits on the NQ short last week, and our bias remains higher on SPX — the weight of evidence still points to rotation, not a significant correction taking hold.
The crowding in momentum we saw these past couple months was about as extreme as it gets though. This JPM chart makes the case. We’ll likely see these momo names struggle to find their footing for a while longer.
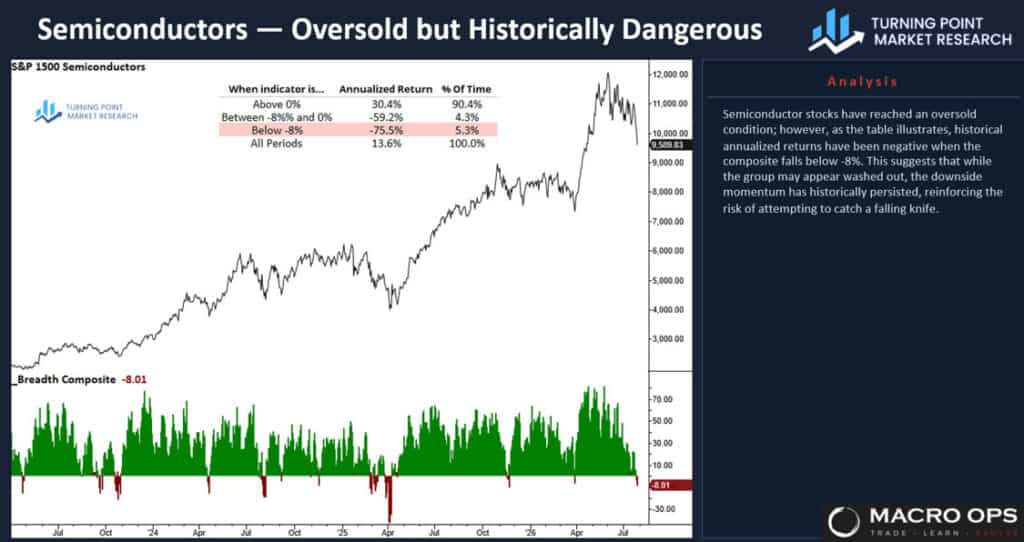
12. Our teammate Dean Christians made the same point in his latest monthly presentation. One chart he shared: Semis breadth composite is below -8%, a level where forward returns have historically been poor.
13. Still keeping an eye on the McClellan Summation and Oscillator to see if they can turn things around.
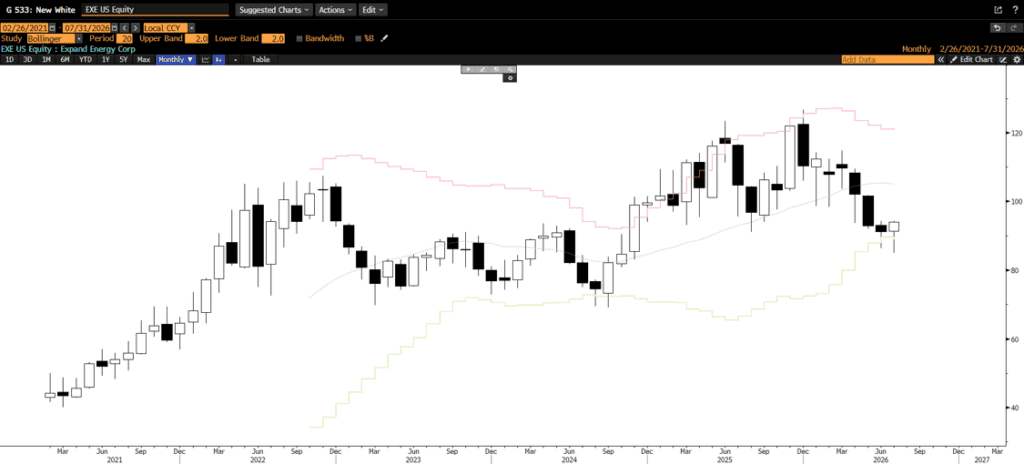
14. I’ve been revisiting some Natty equity plays, as positioning is crowded short in gas and a number of the equities are showing strength on the monthly charts. My current favorites are RRC and EXE, which is shown below.
The quick and skinny bull thesis on EXE is that it’s becoming both the largest producer and marketer of US natural gas, adding Twin Eagle’s storage and pipeline network to its existing scale. And management sees a multi‑decade demand boom from LNG exports, AI datacenters, and onshored manufacturing, making gas a long-duration way to play the AI buildout.
We’re digging into both of these and will be out with more for Collective members soon.
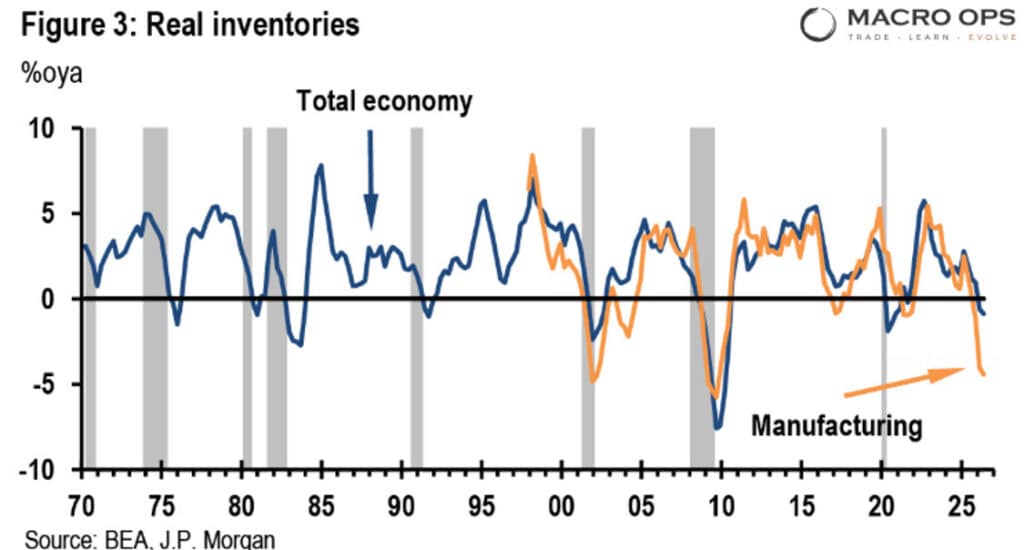
15. This from JPM is a bit of a head scratcher… if any of you have thoughts on why this is, please ping me. Here’s JPM:
“One of the more perplexing developments here is inventories, which have fallen for five straight quarters, with much of that coming in the manufacturing sector (Figure 3). This type of behavior is more typical of a recession, and yet goods-producing industries have been performing relatively well, at least in comparison to the standards of recent years.
“Normally, this type of inventory drawdown would lead us to raise our growth forecast for coming quarters, under the expectation that firms will need to restock, with at least some of that coming from domestic production. We have held off for now while we evaluate why the inventory decline has occurred. The inventory decline has overlapped closely with the trade war, and there is some possibility that an eventual re-stocking might come disproportionately via higher imports.”
Thanks for reading.