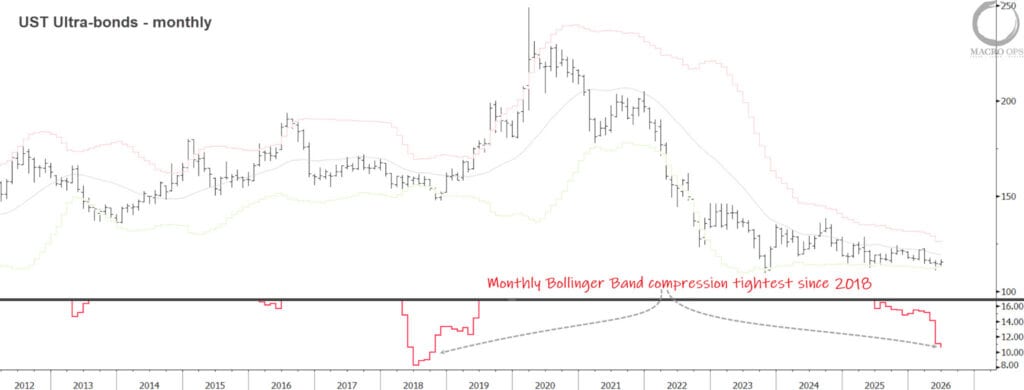
Summary: Bonds remain in a major compression regime. Our bias is for a break lower.
Breadth continues to improve. Short-term sentiment and positioning are elevated and climbing, but not yet at levels that push us into defensive posturing. The longer-duration signals are a different story. The MO Liquidity Tool and BofA’s Bull/Bear indicator both point to a more volatile regime ahead.
Near-term, the path of least resistance is still up. The longer-term picture is another matter.
Crypto is coiled for a run. Global defense names look to have put in a bottom. Plus more.
MO Portfolio & Trades
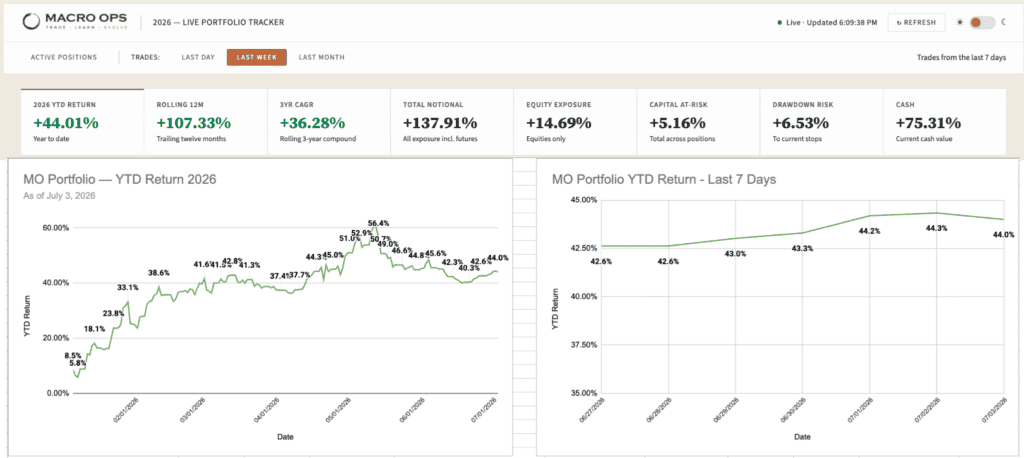
1. The portfolio ended last week up +140bps, bringing year-to-date returns to +44%, below our YTD NAV high of +61%.
Current positioning: elevated cash, long Nasdaq, long Russell2k, long biotech complex and cybersecurity names, long GBP.
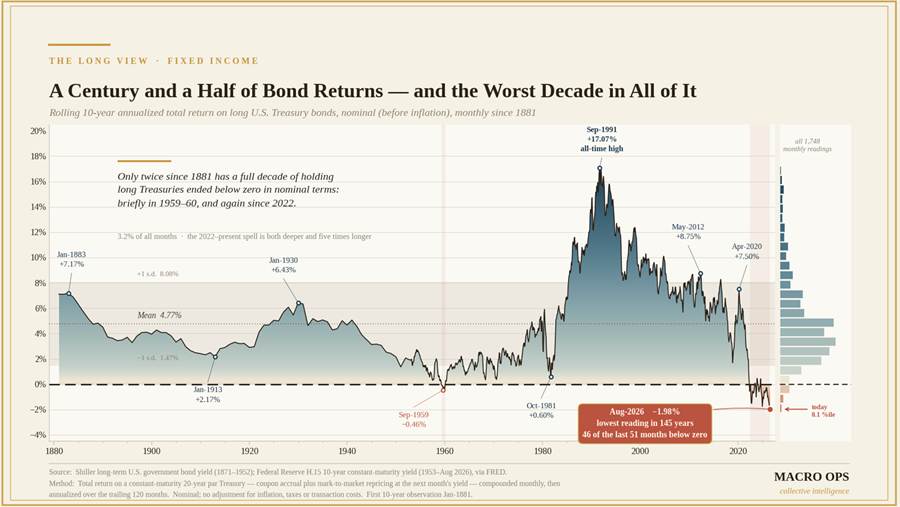
2. Bonds continue their compression on the monthly tape with BB width at its tightest range since 2018. Compression regimes precede big trends but are directionally agnostic, though our bias is for a breakout to the downside.
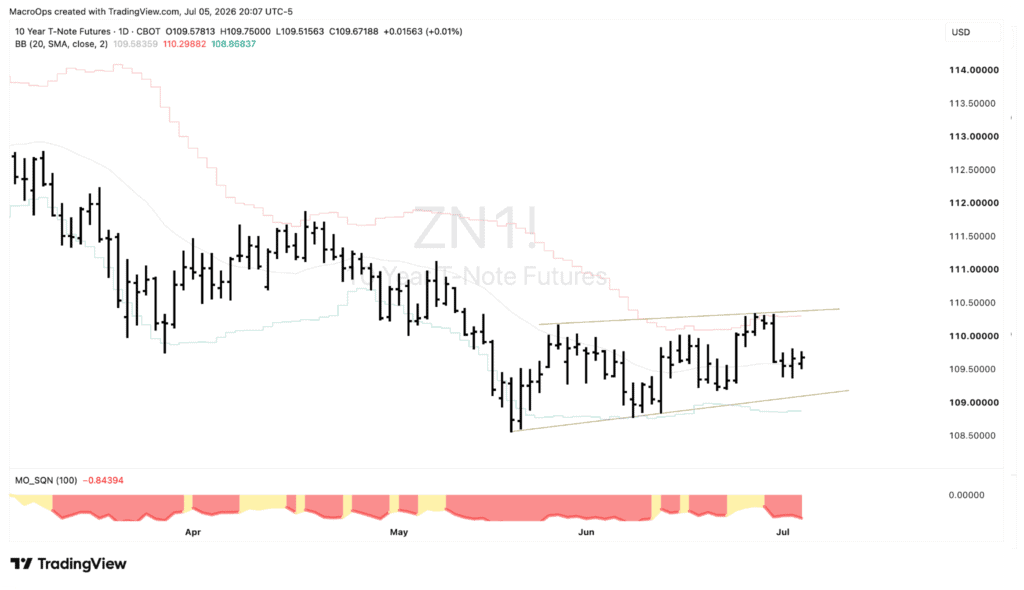
3. 10-year TNotes continue trading in their range within a Blended Bear Quiet regime. The direction of breakout will likely determine the near-to-intermediate term direction for the broader equity market as well as the USD.
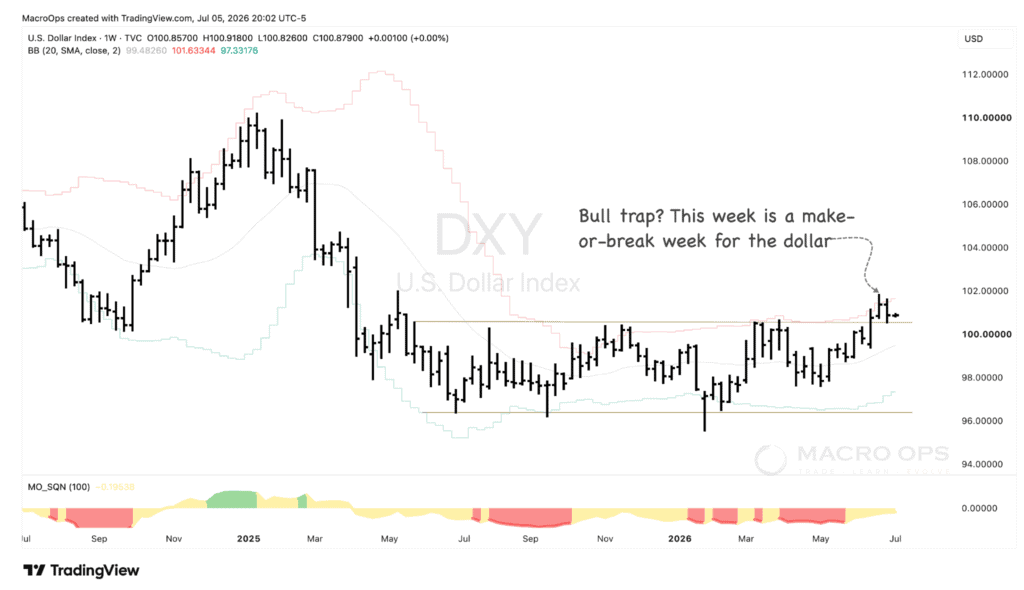
4. This is a make or break week for the DXY as it should decide whether this breakout holds or ends in a bear trap. The answer holds big implications for the rest of global markets.
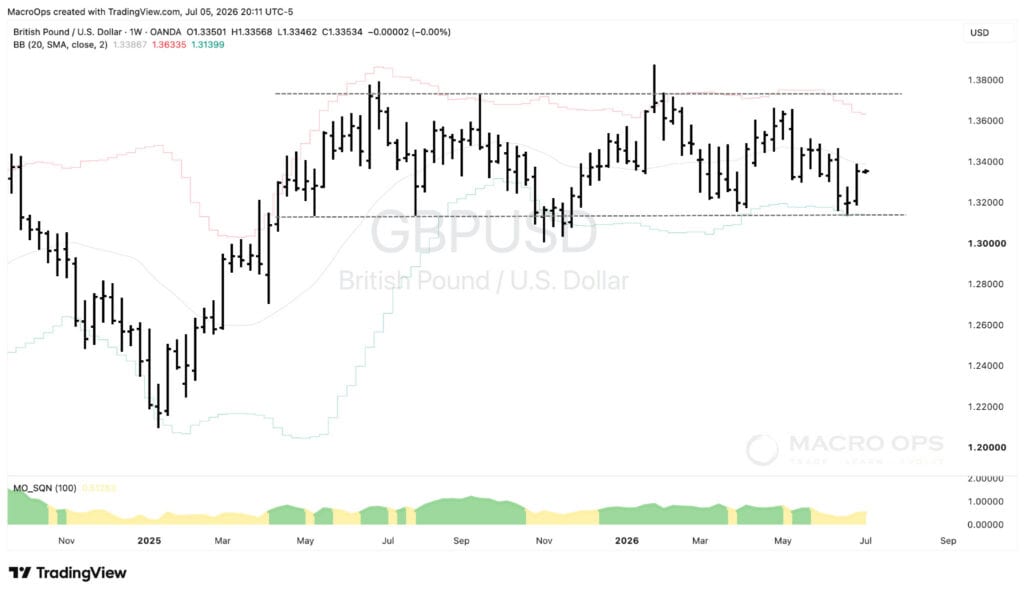
5. Last week we highlighted the mean reversion setup in GBPUSD, supported by the record short positioning in Specs. The trade is working nicely so far (chart below is a weekly).
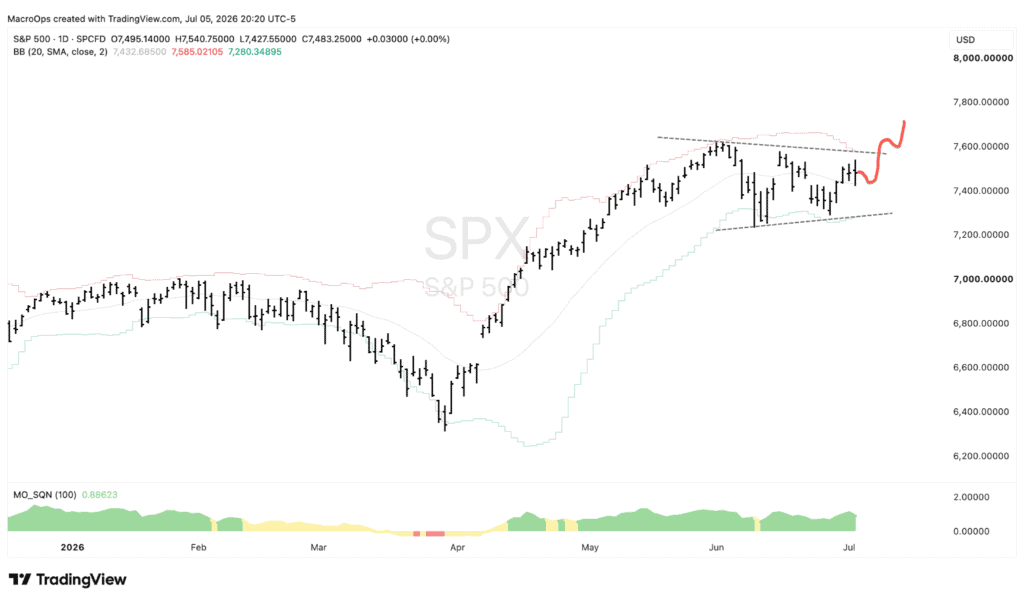
6. SPX continues consolidating its gains off its April lows. The weight of the evidence favors a coming breakout through the upside of its current range.
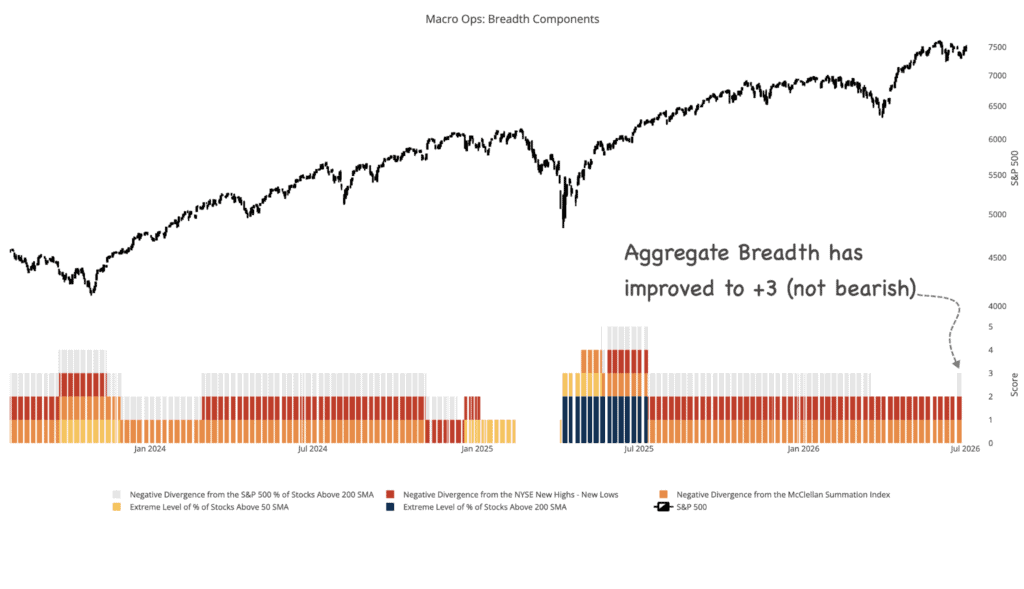
7. Our Aggregate Breadth Indicator strengthened last week to +3. Major corrections (10%+) occur when this measure falls to 1 or below. This improvement supports an eventual bullish breakout in equities.
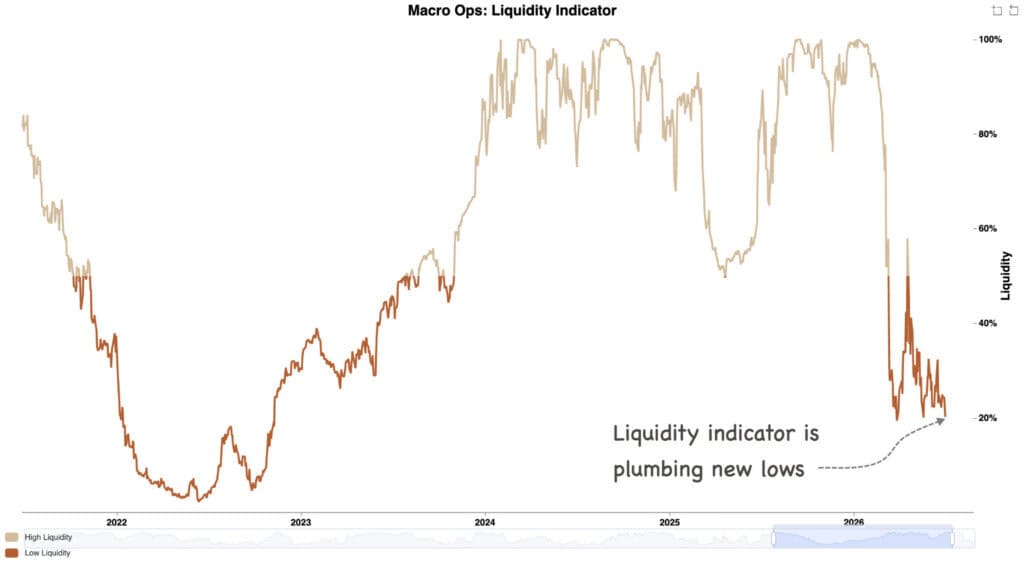
8. However, our longer-term measure of liquidity is plumbing new lows. While this indicator can have a long lead of 3-6 months, the lower it goes the lower average forward returns for the market become.
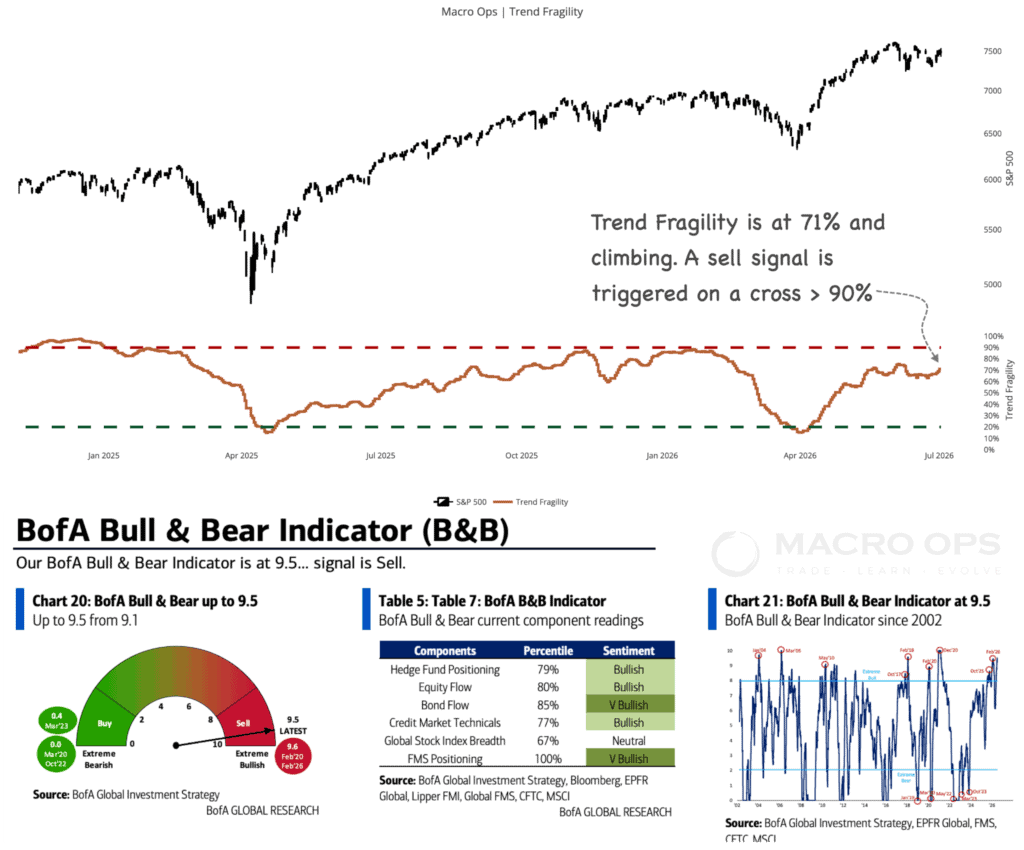
9. This dichotomy in the setup between short and intermediate terms can be seen in the sentiment and positioning data as well. Our Trend Fragility indicator, a composite of short-term sentiment and positioning data points, is at 71% and rising. Still well below the 90%+ threshold for an official sell signal. While BofA’s longer-term measure, is giving a strong sell signal.
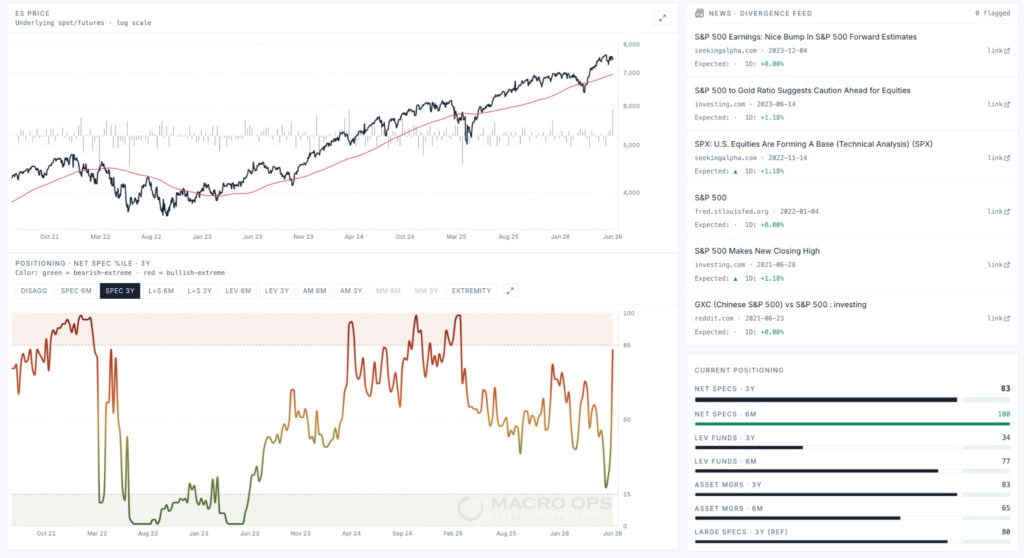
10. Our 6m oscillator for net Speculative positioning in the SPX is elevated at 81% but still below the 90th percentile that suggests caution.
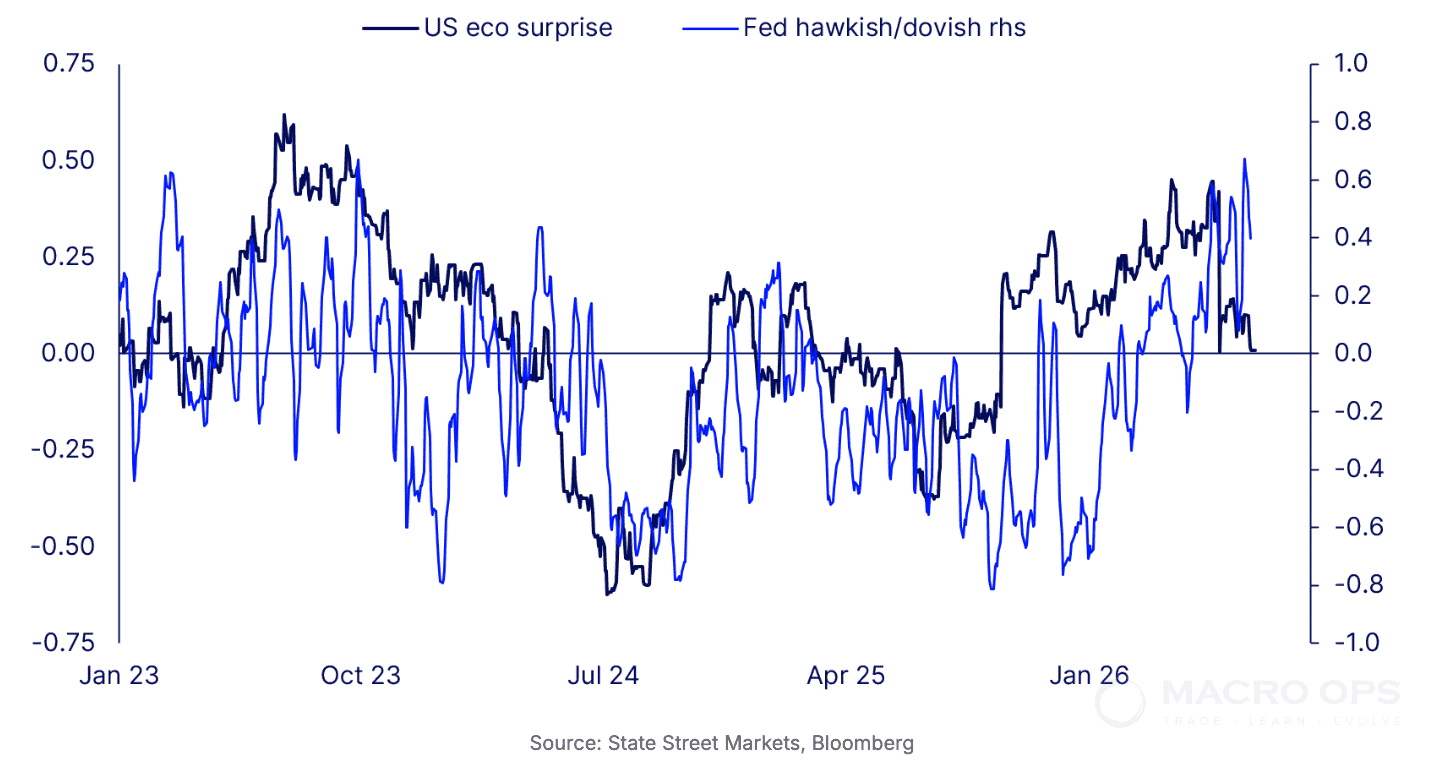
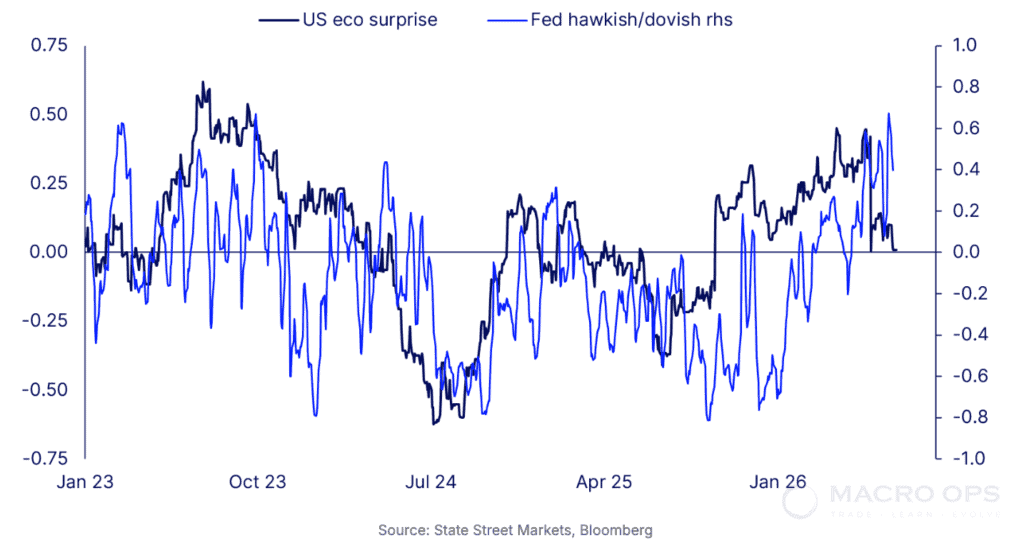
11. Perhaps the catalyst for the next move up in risk assets will come from a softening (read: more dovish) tone from the Fed as the Narrative Pendulum swings in the doves favor?
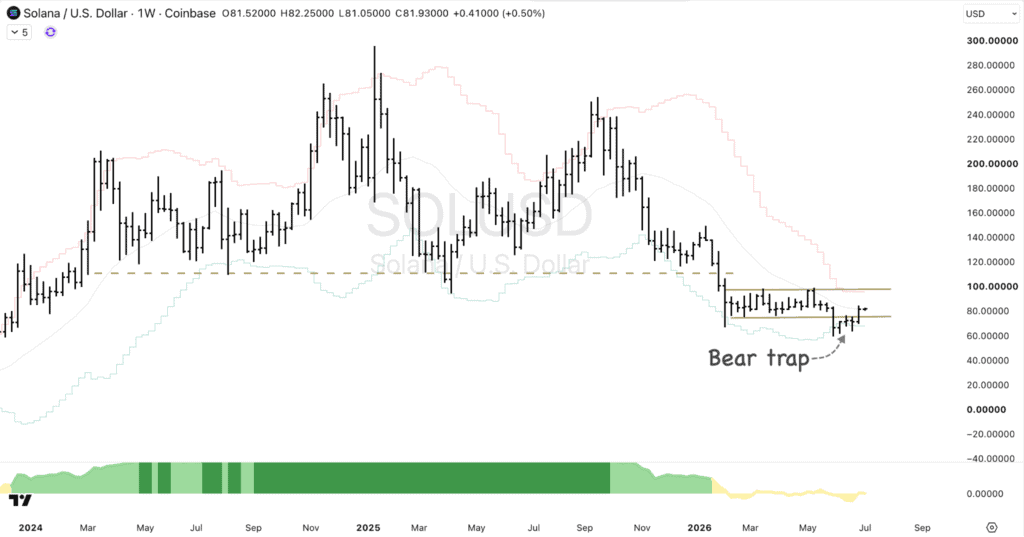
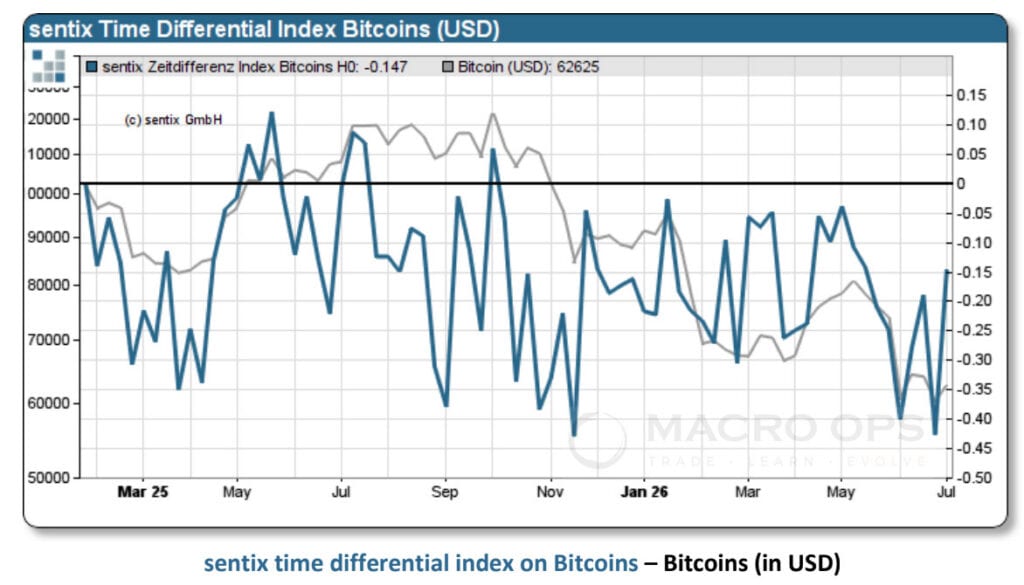
12. We like crypto here. SOLUSD has put in a bear trap on the weekly, and sentiment is coming off the lows (see next chart).
13. From Sentix: “Last week, the sentiment barometer for Bitcoin stood at -34 percentage points. Consequently, we highlighted in our newsletter the counter-cyclical opportunity arising from this extreme in sentiment… The TD Index still stands at -15 percentage points and is ‘cushioning’ prices against a fall. The sharp improvement in sentiment, coupled with a simultaneous rise in bias, carries a second piece of information. This is a sentiment impulse which, according to conventional interpretation, points to the prospect of further price gains.”
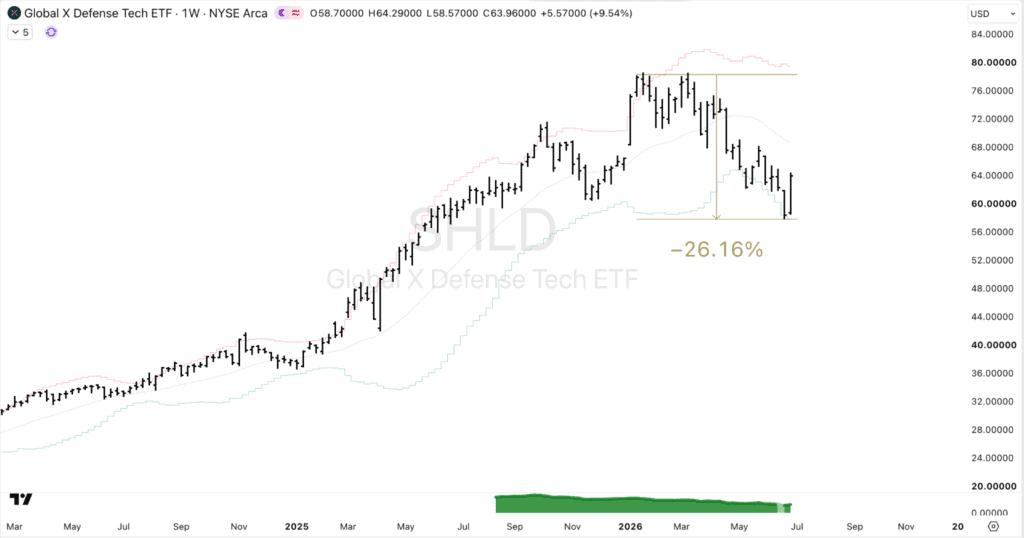
14. Global Defense stocks have set up again after correcting over -25% ytd. We like both ITA and SHLD.
Thanks for reading.