“As an alternative approach, one of the traders I know does very well in the stock index markets by trying to figure out how the stock market can hurt the most traders. It seems to work for him.” ~ Bruce Kovner
In this week’s Dirty Dozen [CHART PACK], we go through my base case for the path of the market. We walk through the technicals, breadth thrusts, the state of liquidity, rising recession odds, and relatively loose financial conditions. We then end with a look at the US dollar and a way to play its parabolic rise, plus more…
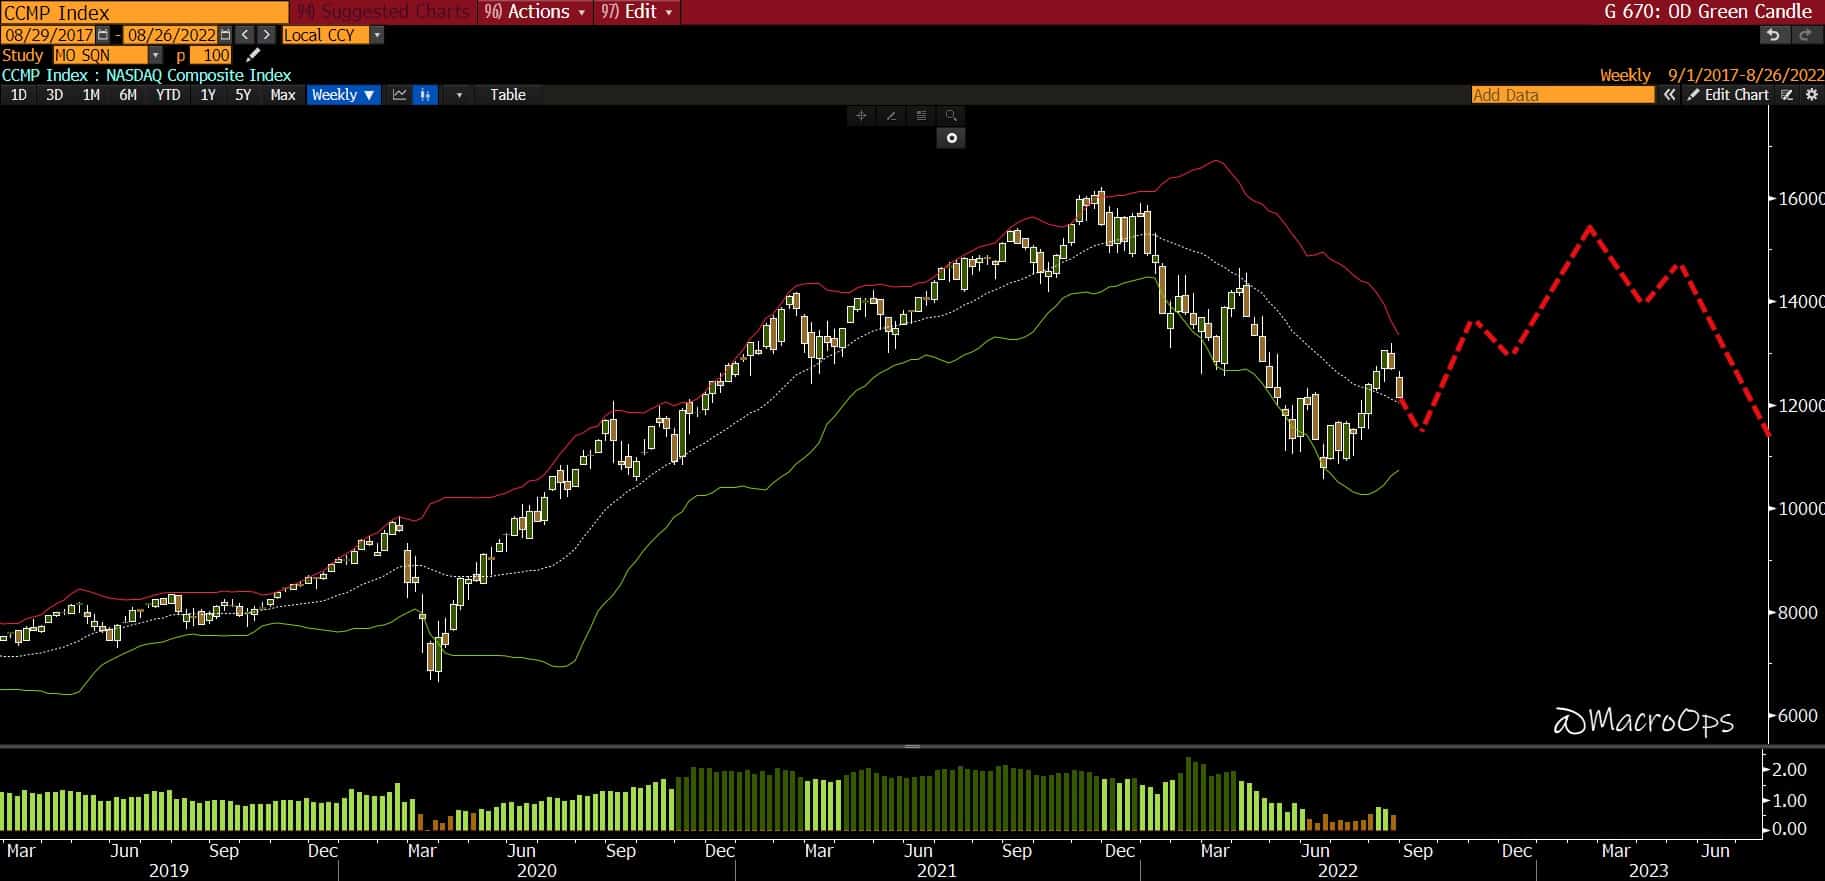
- This is my base case for the path of the market as of now. A strong selloff this week followed by a bottom and hard reversal that leads to another leg up. The environment is fast-moving, and there are many variables at play, so naturally, my conviction is low. I’ll lay out my reasoning in the charts that follow.
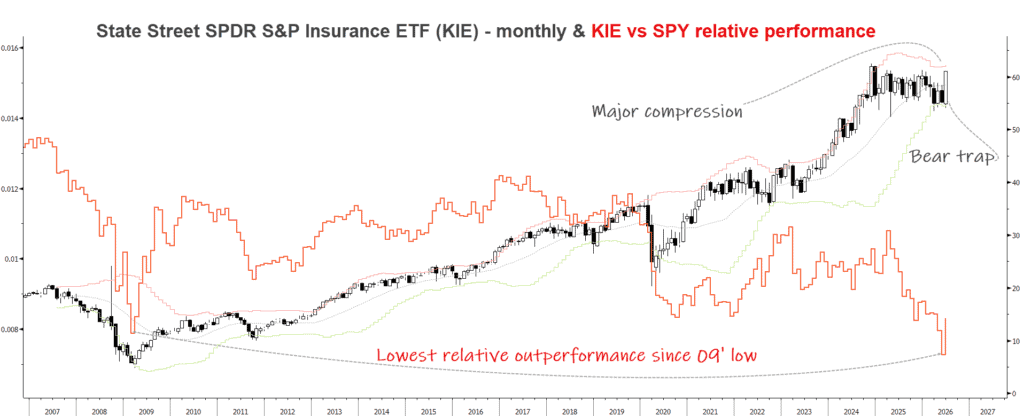
- The larger secular trend is still very much intact, with this correction looking like the many others experienced over the last decade.
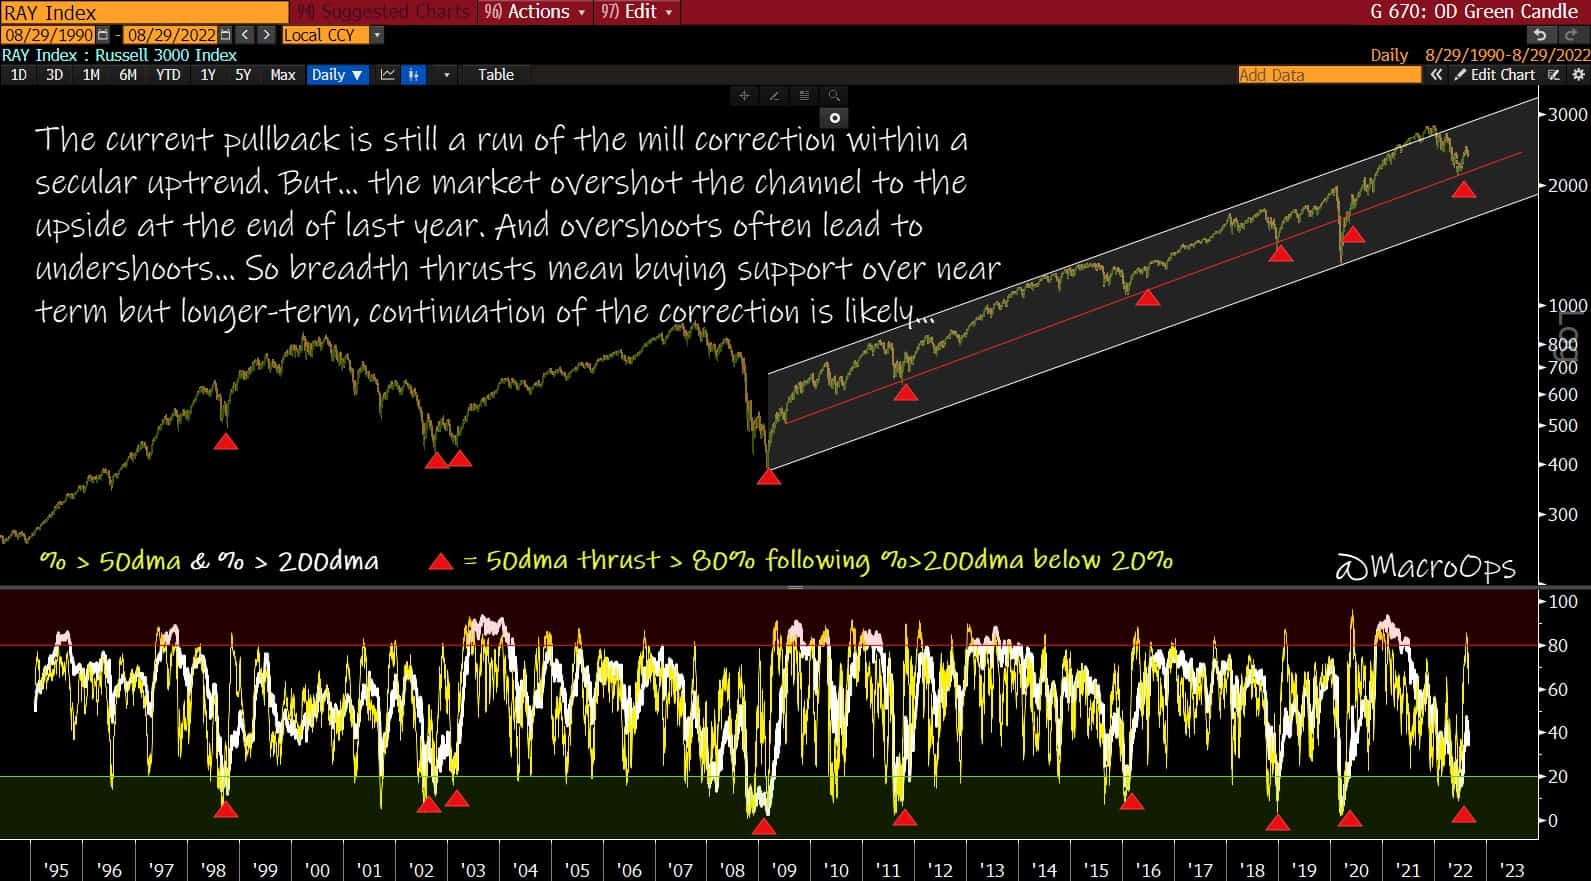
The market recently saw a number of breadth thrusts fire. Breadth thrusts are a solid point for the bulls. They mark instances of large buying pressure. These types of demand imbalances are what drive large trends. The chart below shows the % of stocks trading above their 50-day moving average (yellow) and 200-day moving average (white). The red triangles mark instances where the % of stocks above their 50dma jumped above 80% while the % above their 200dma was recently below 20%.
This marks a strong breadth thrust from broad oversold conditions (the index below is the Russell 3k).
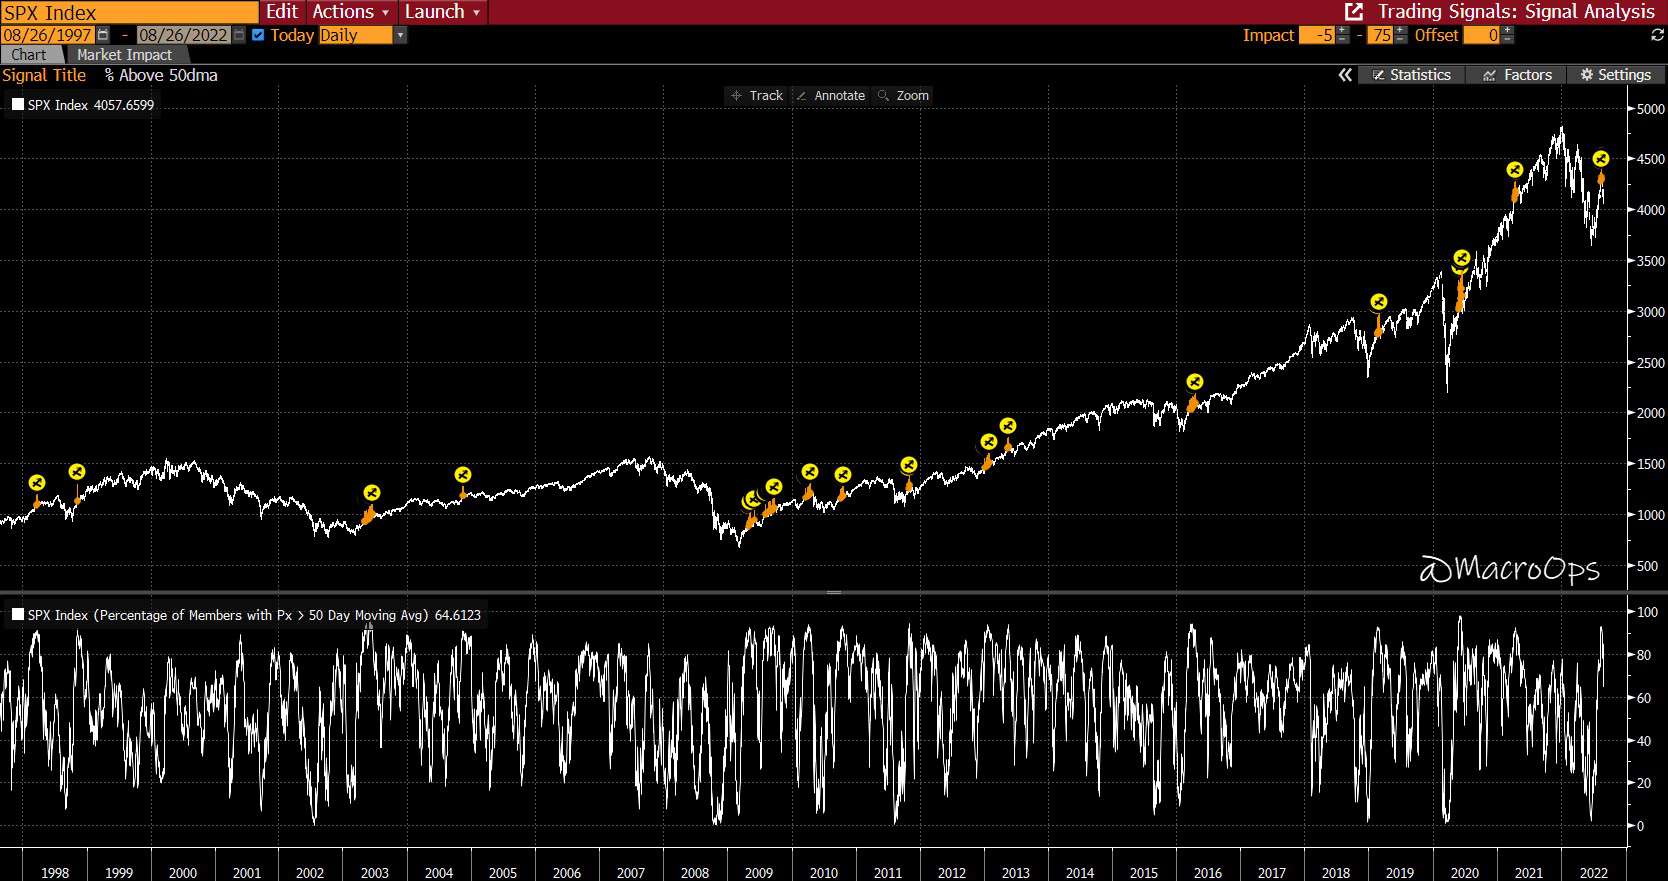
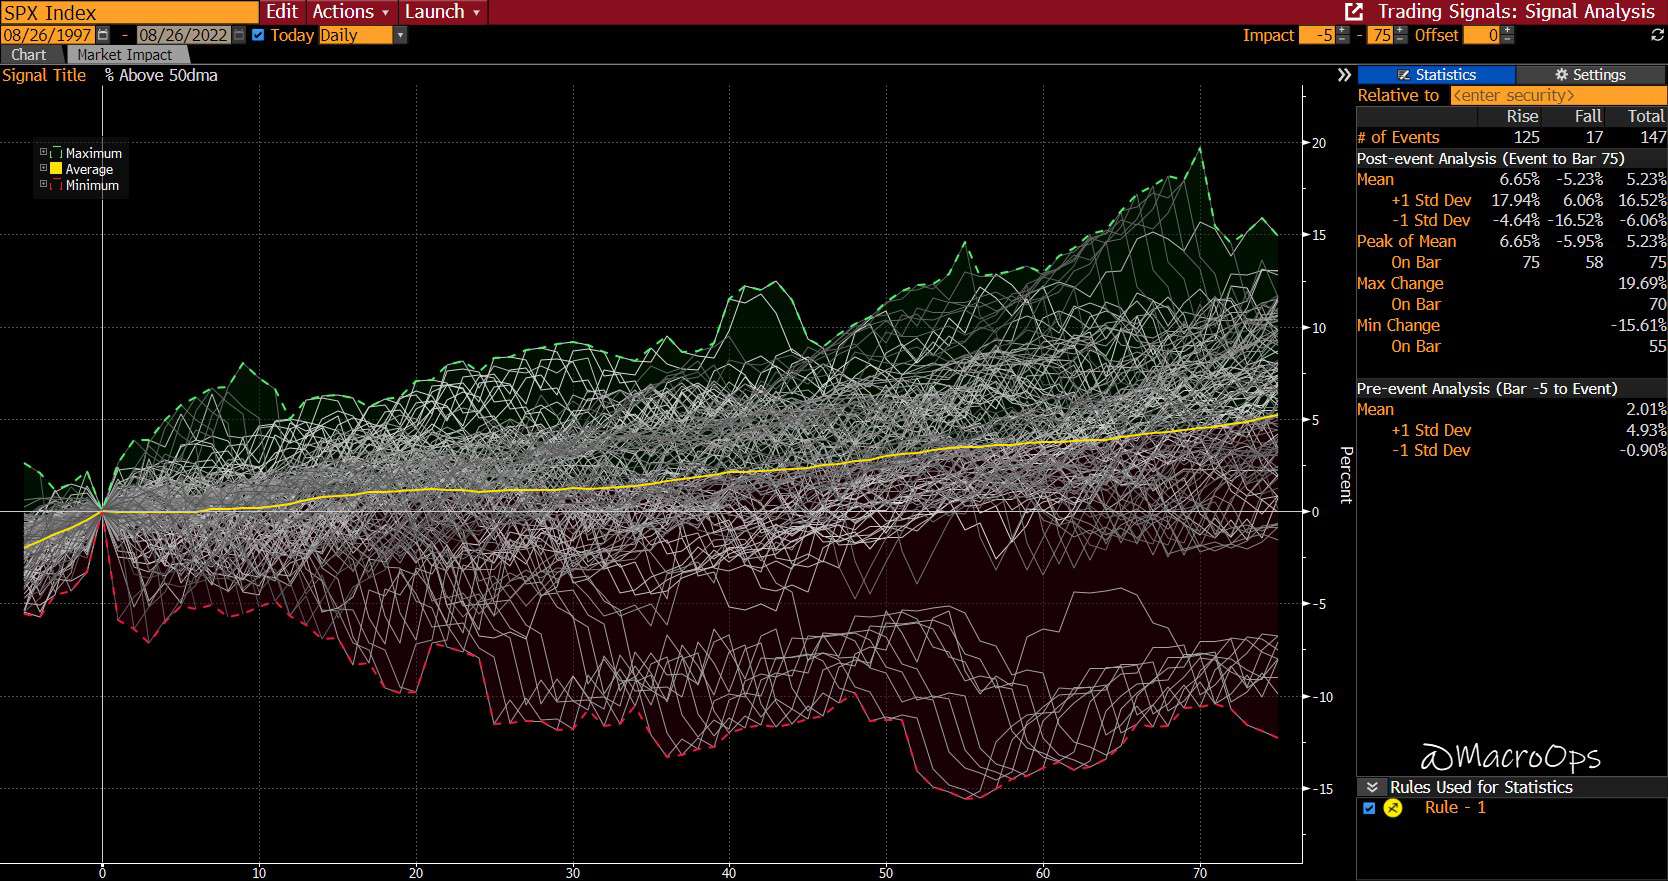
- The two graphs below show every time over the past 25 years that the % of stocks above their 50dma crossed +90%. There have been 147 instances total. 125 of those were higher 3-months later, and 17 were in the red, with an average gain of 6.65% and loss of -5.23%, respectively (SPX index below).
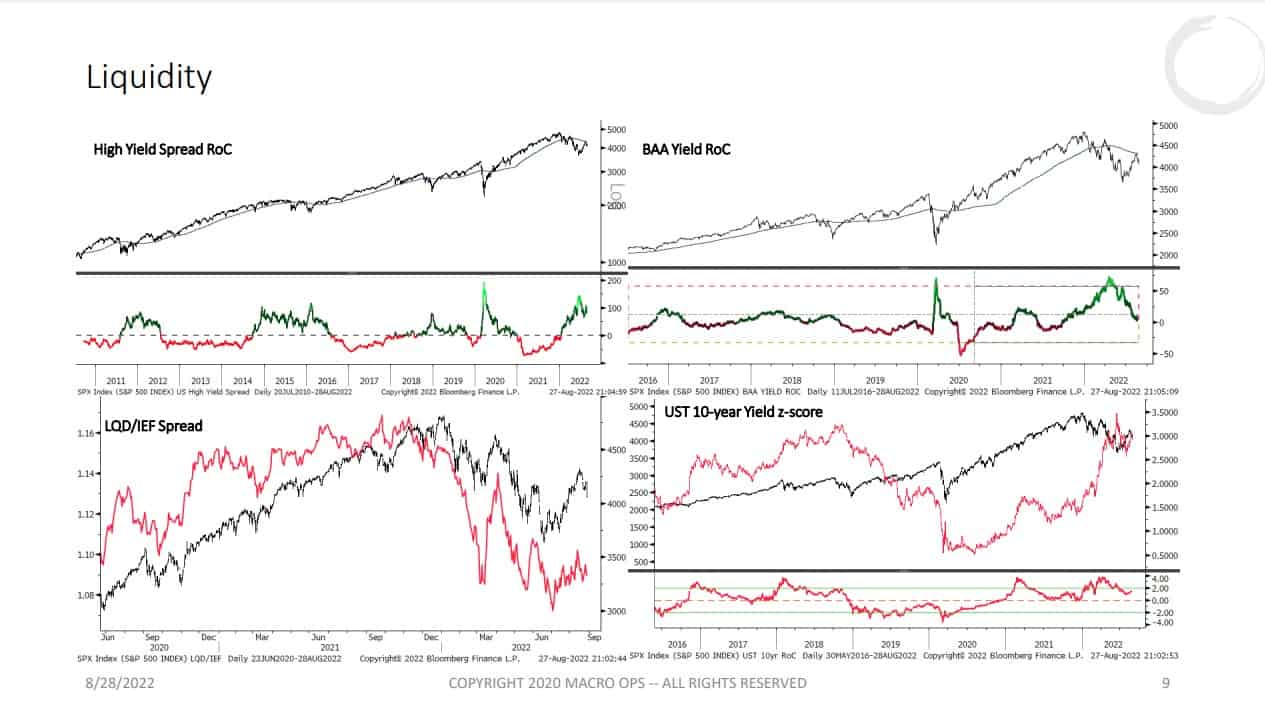
- This breadth thrust, along with a number of others that fired last month, are important signals. But, as all things market related, they need to be looked at in context. And the biggest killer of any further market rally here is yields. If bonds fail to catch a strong enough bid (yields down) on the back of market weakness, then expect an acceleration in risk-off.
As of now, bonds have not offered much of a countervailing force to risk-off in stocks. This is good reason to be cautious if you’re bullish here. To find out more about how I view the market holistically, read The Hierarchy of Market Technicals.
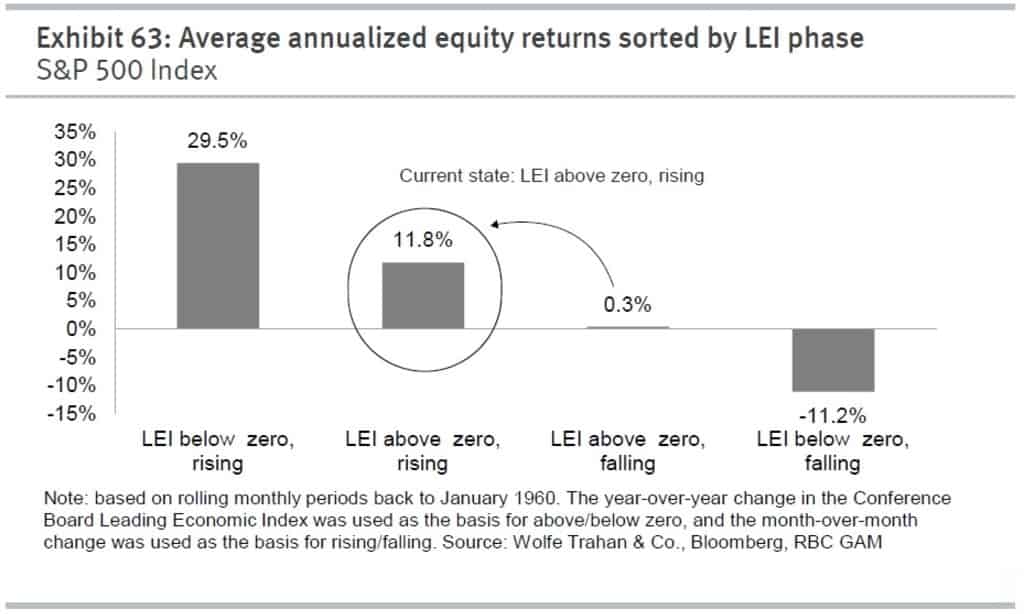
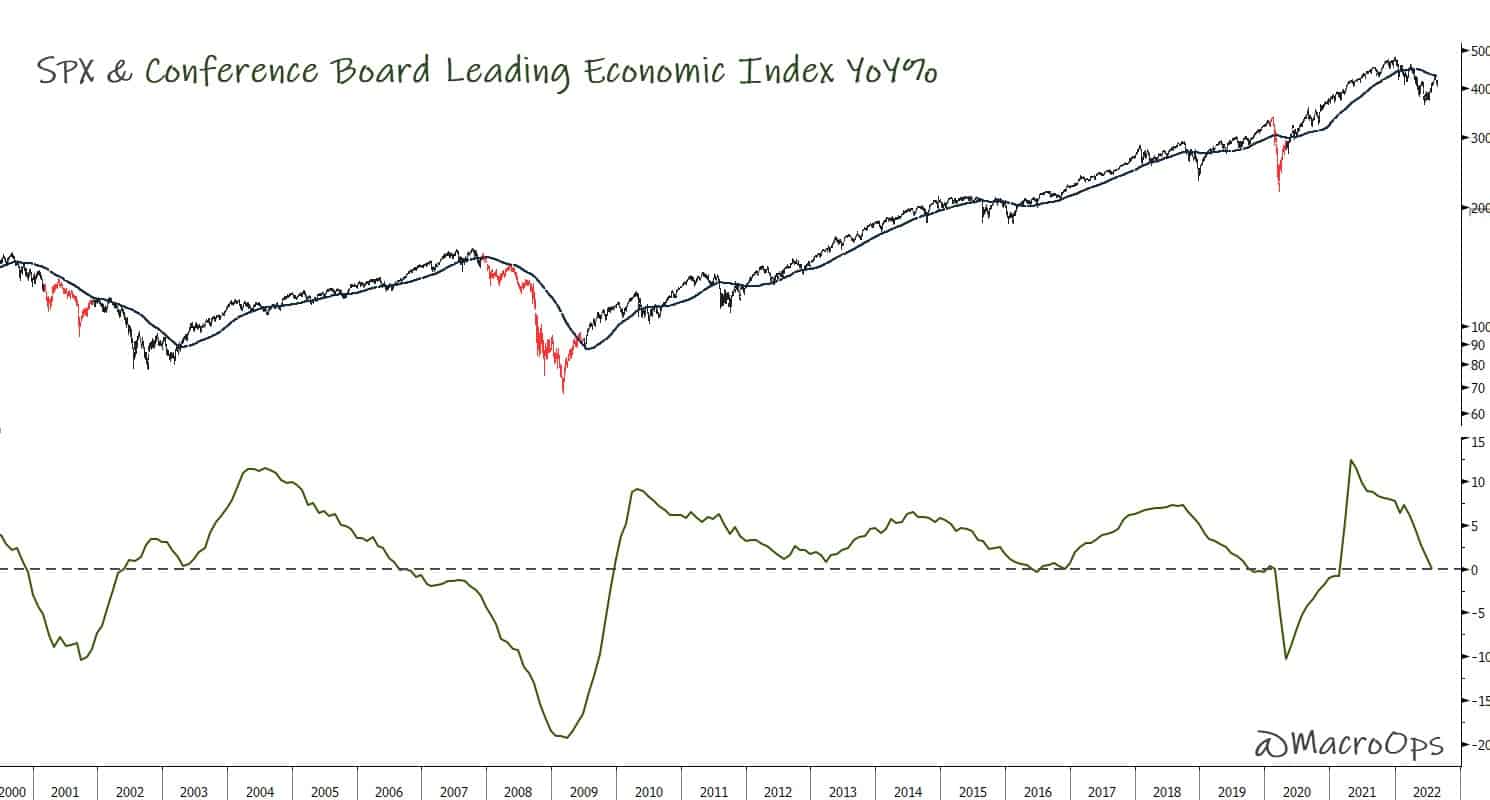
- The Conference Board Leading Economic Index (LEI) recently hit 0% on a YoY basis. If it continues to fall, which we very much expect it will. Then stocks will be in their lowest returning environment per the LEI, where the average annualized market return is -11.2%.
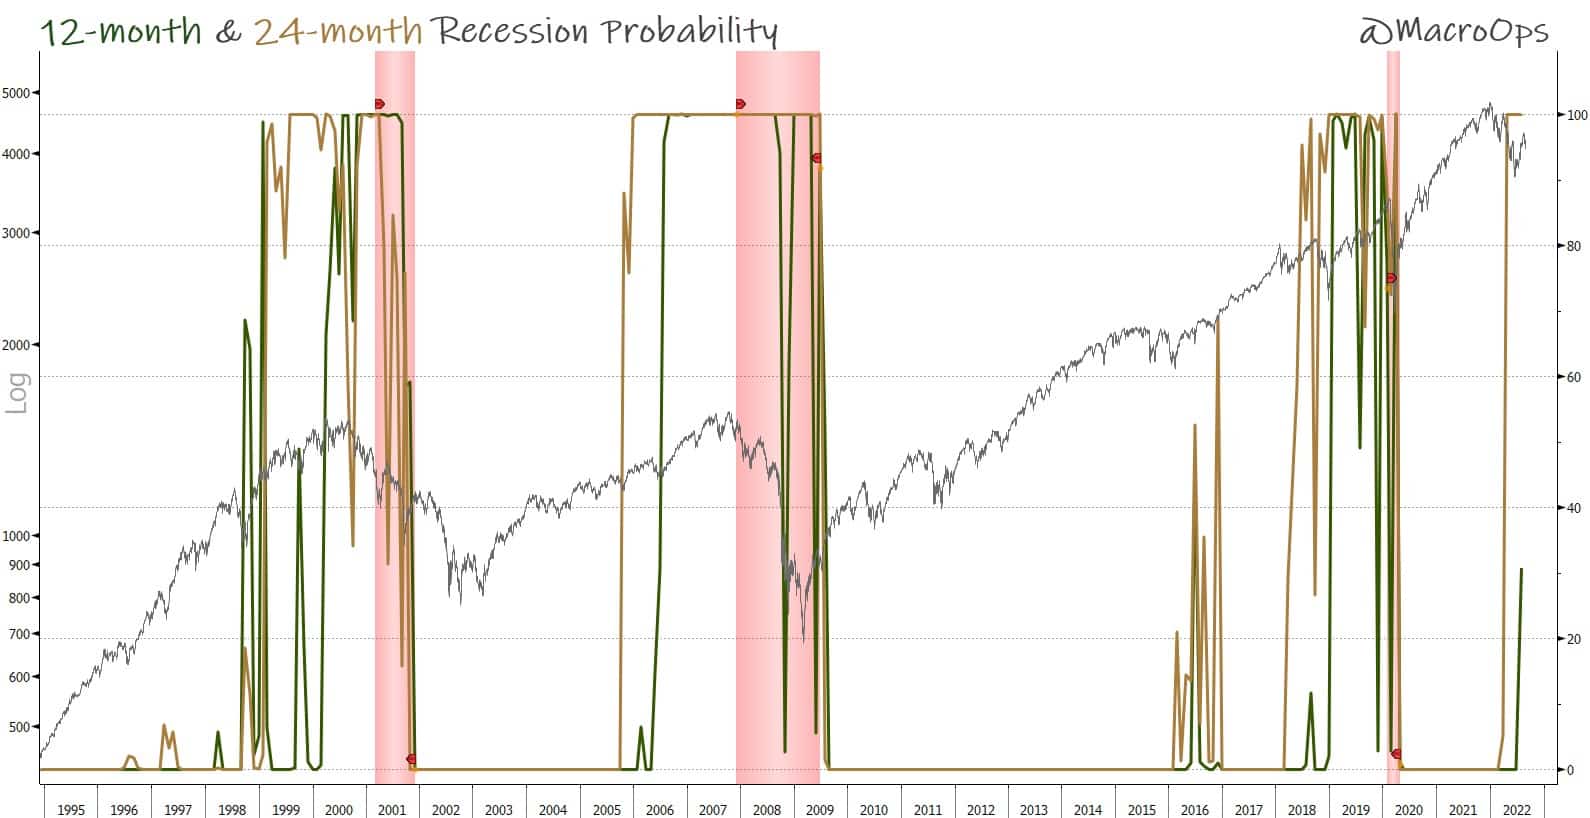
- The 12 (green) and 24-month (tan) US recession probit model has perked up dramatically over the past two months. This probit model uses 17 various hard econ, financial, and market inputs to assess the probability of a recession over the coming 12 and 24 months. It currently assigns a 100% probability of a recession within the next two years and a 30% probability of one within the next 12 months.
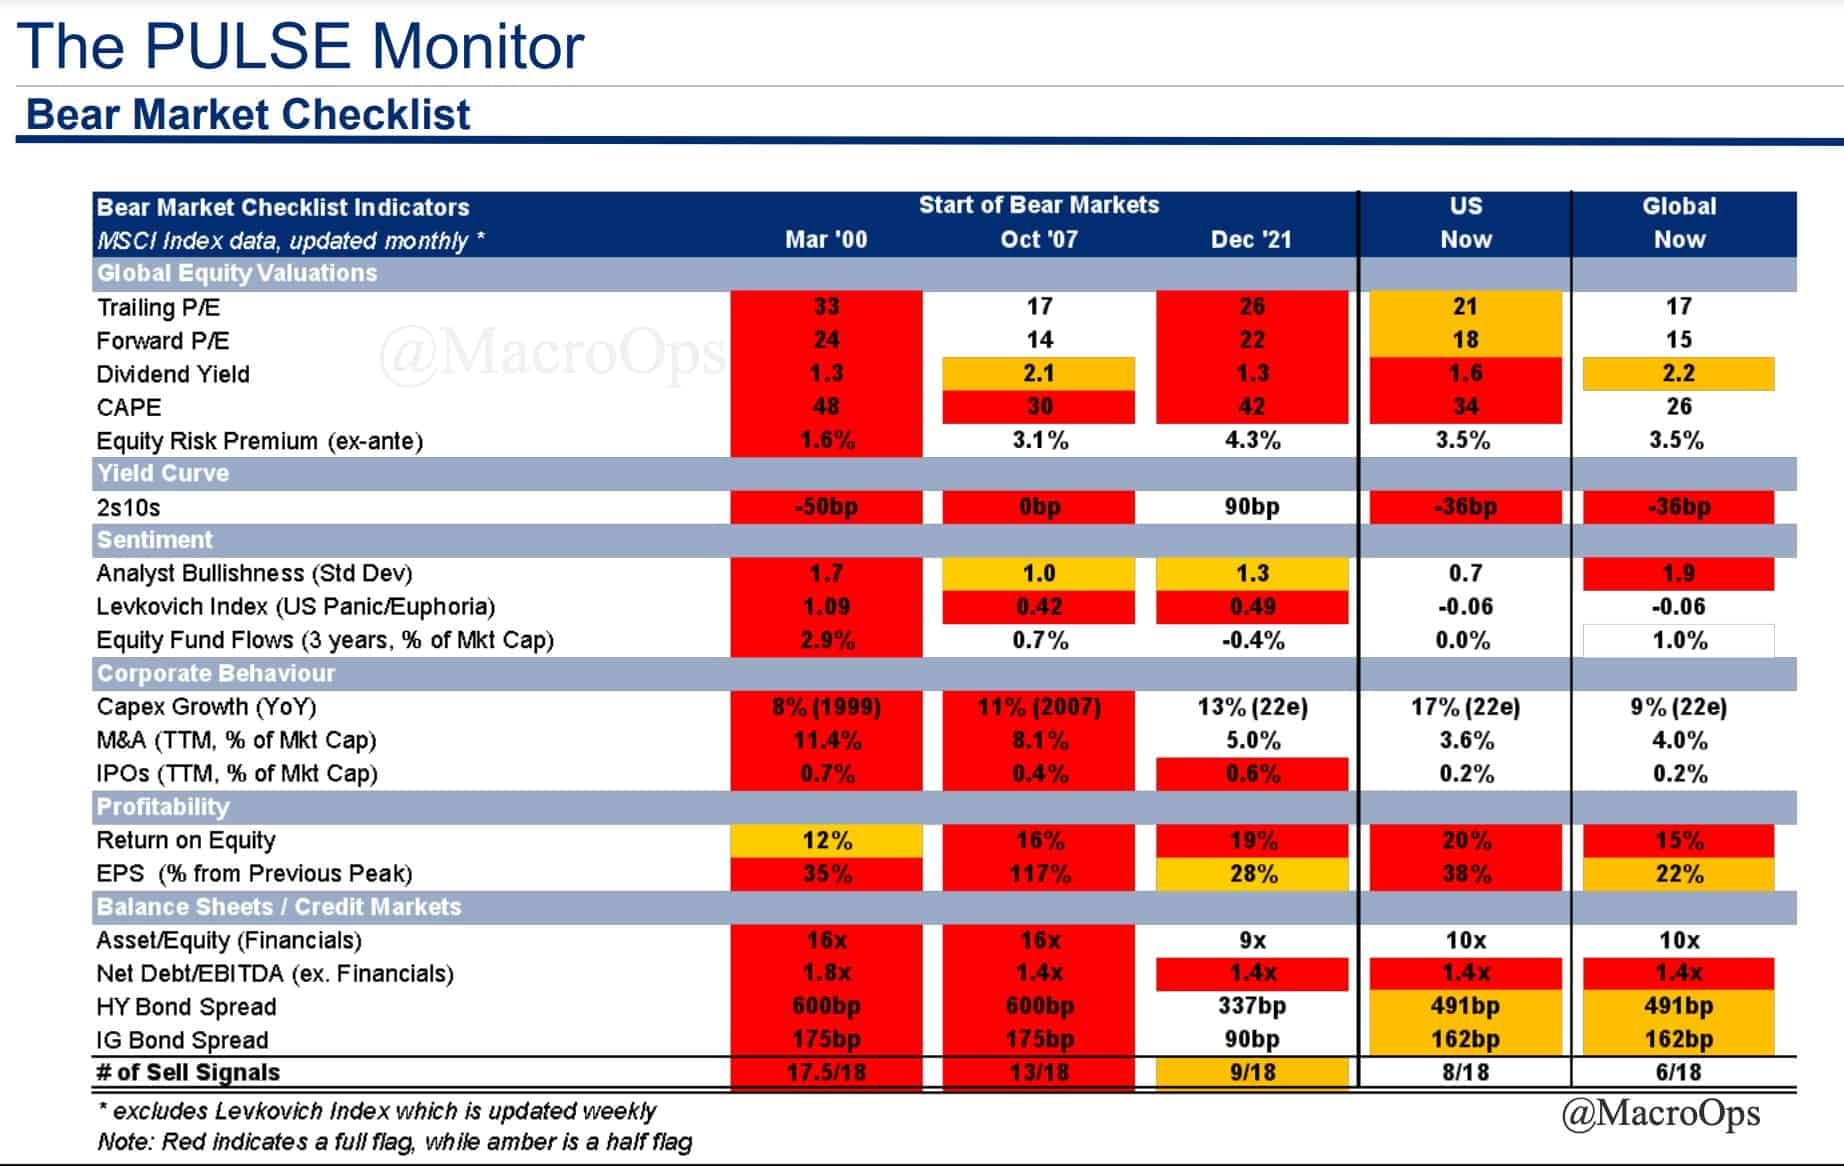
- Citi’s Bear Market Checklist now has 8 sell signals within the US and 6 for the world (out of 18 total). When half the number of signals say sell (are red), a cyclical bear market typically follows.
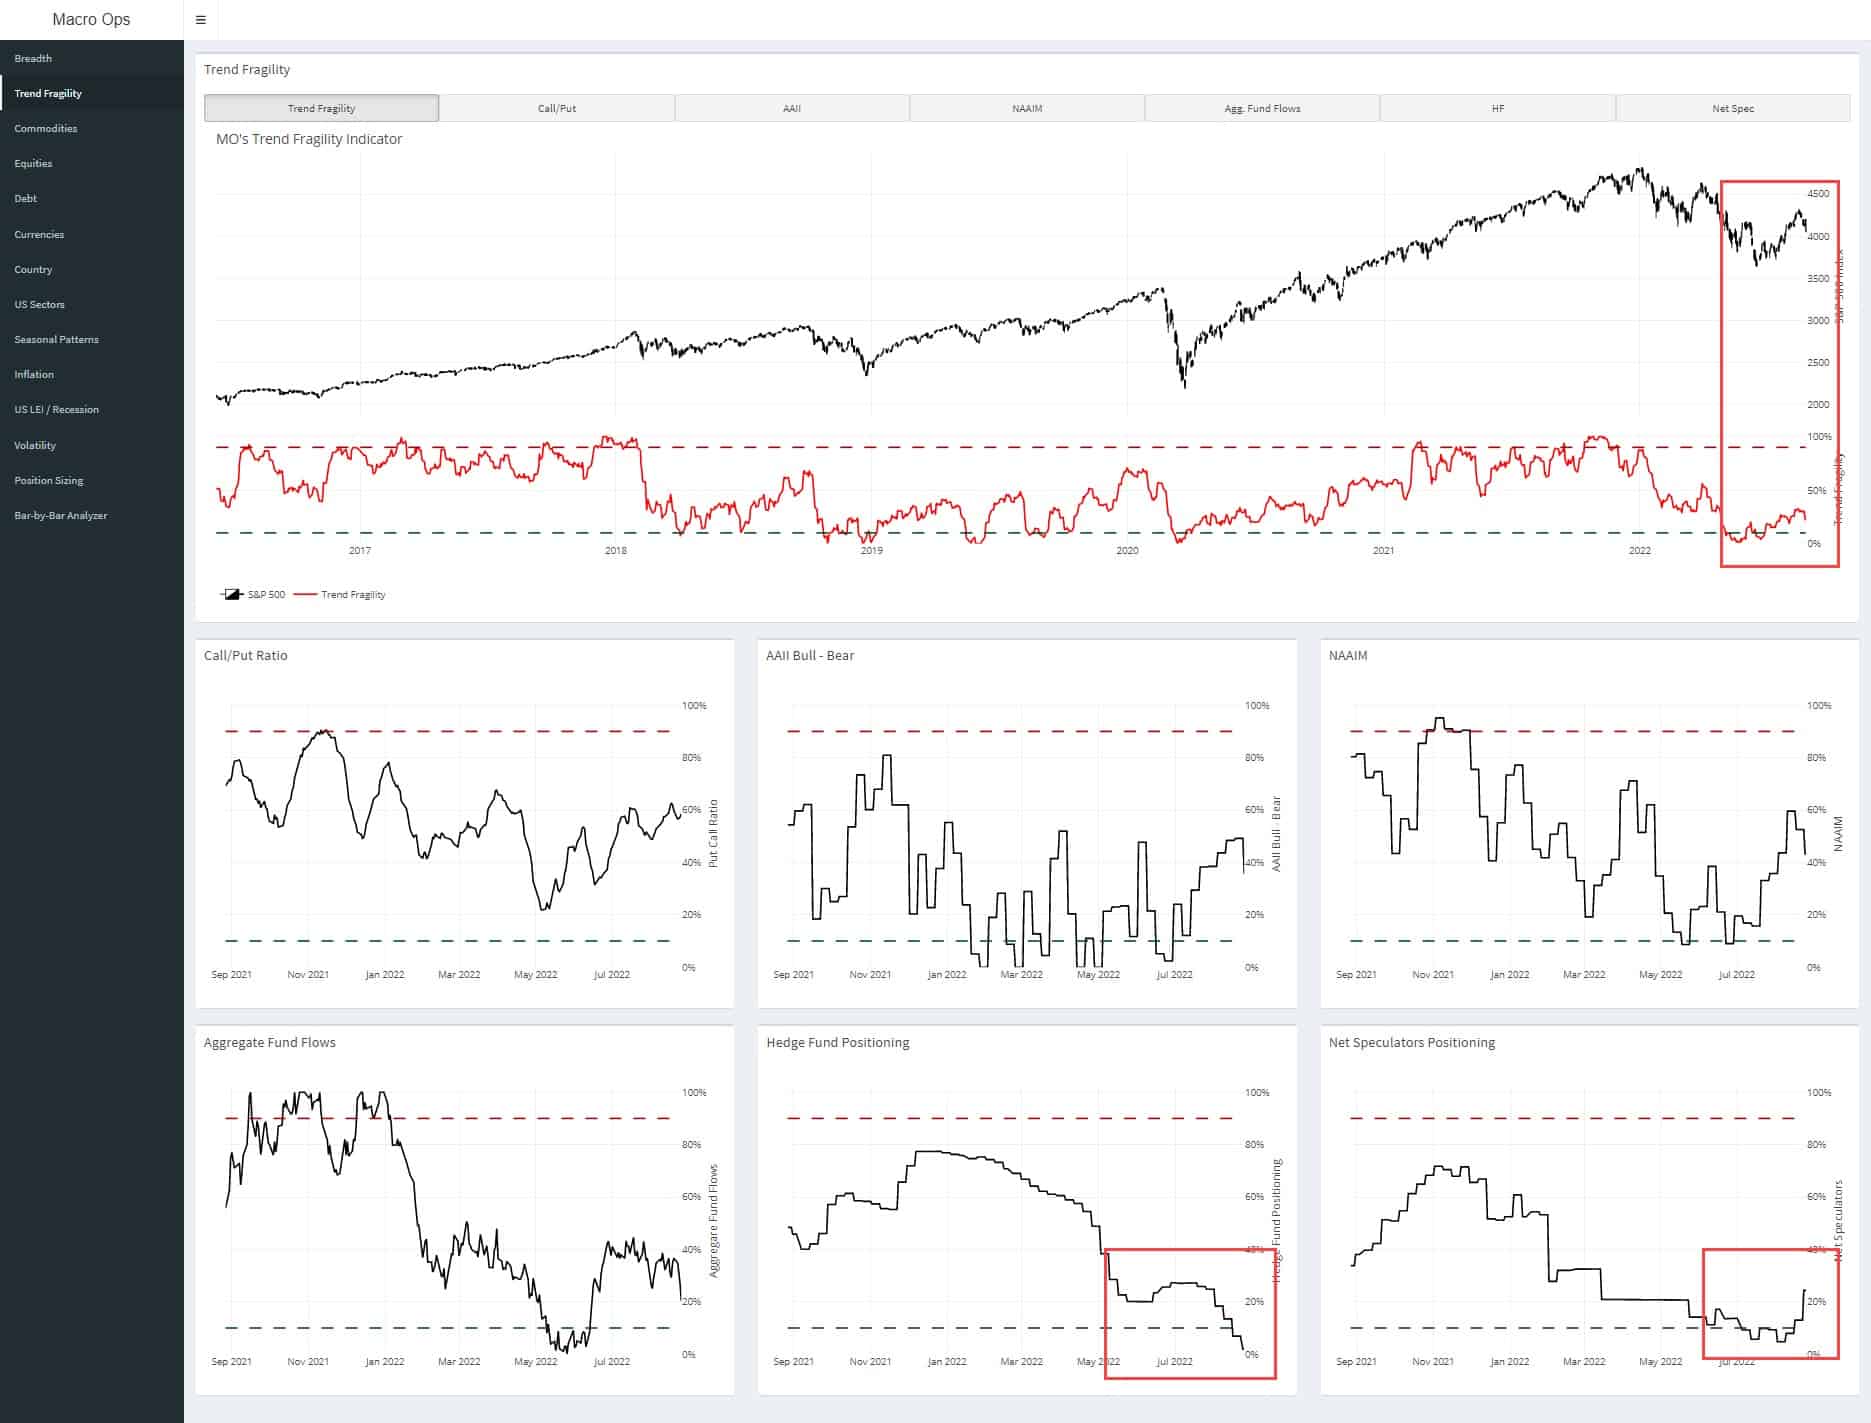
- One of the reasons why we called and positioned for a summer rally back in early July was because sentiment and positioning were maxed out bearish. And it’s difficult for the market to remain at negative extremes for too long, especially when financial conditions remain as loose as they are.
While our Trend Fragility Index (a composite of 7 different sentiment and positioning data points) has risen from these extremes. It is still quite depressed. 3yr net hedge fund positioning is in the 3rd %tile, and net speculative positioning across all major indices is in the 24th %tile. This, along with the chart below, are largely why I believe stocks will surprise everyone to the upside over the next few months before turning over again.
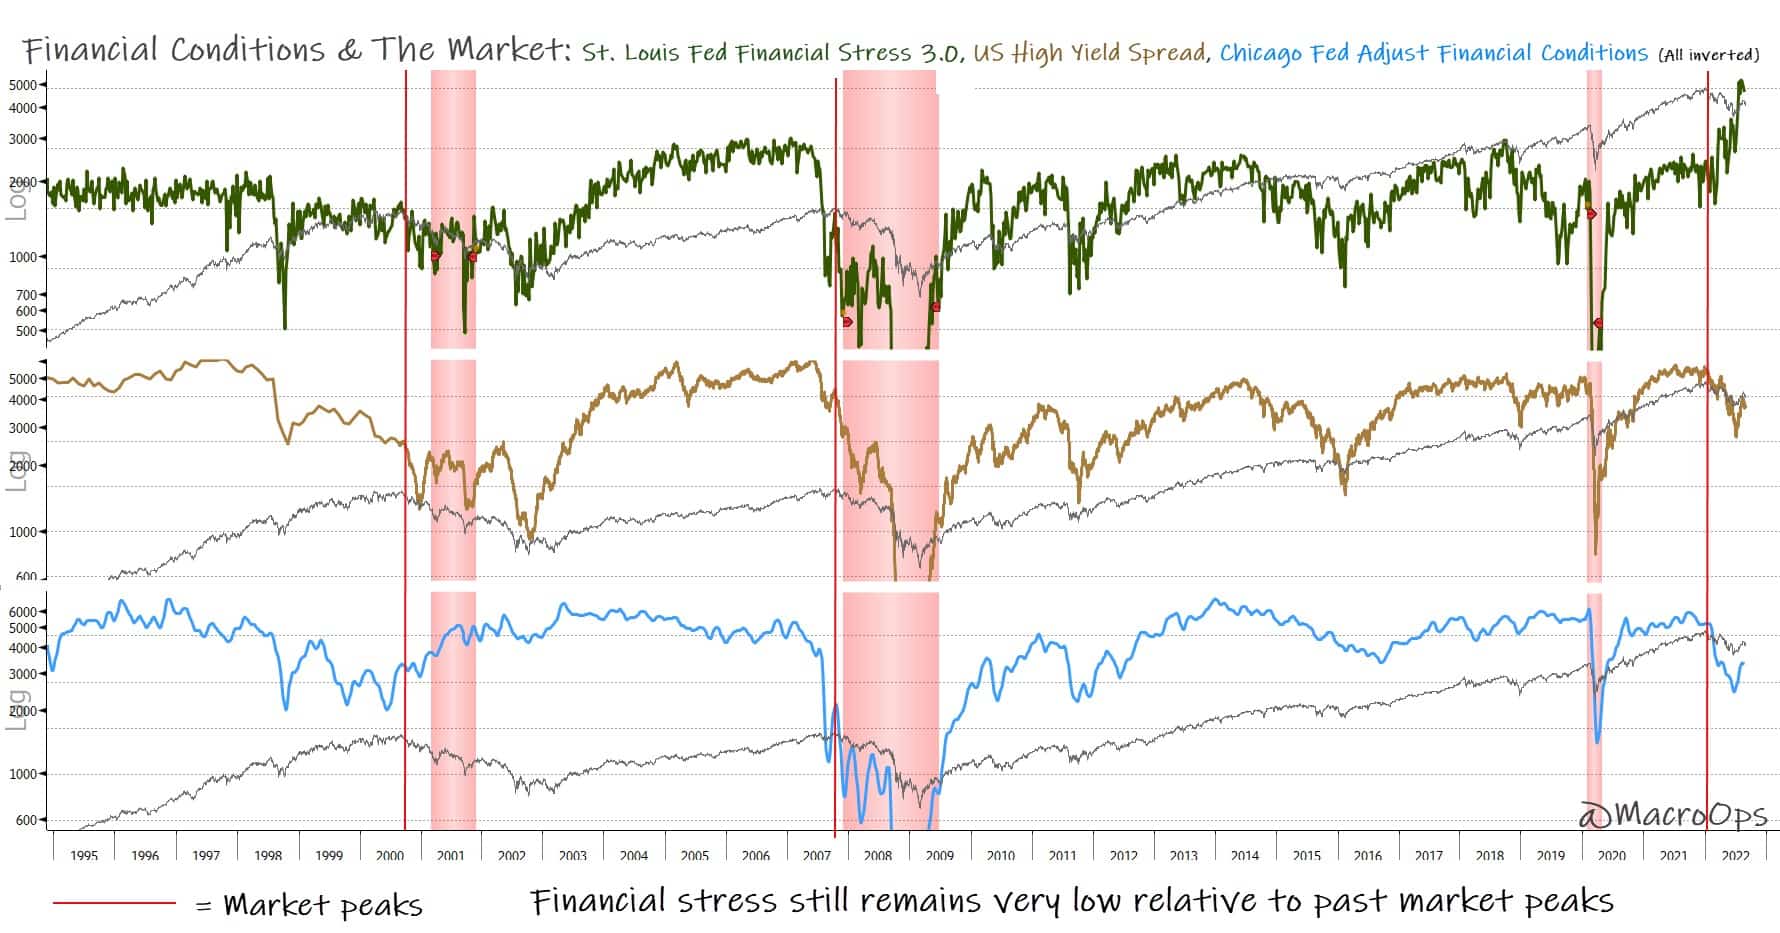
- It’s hard for stocks to fall too far too fast without a significant tightening of financial conditions, which we haven’t seen yet. The chart below shows the St. Louis Fed Financial Conditions Index 3.0 (green line), US High Yield Spread (tan line), and Chicago Fed Adjusted Financial Conditions Index (blue line). All are inverted, so lower readings mean financial conditions are tightening. Vertical red lines mark past market tops.
Apologies for the busy chart, but it shows an important fact. Financial conditions, in general, remain quite loose. Yes, they are broadly tightening. And that should continue to accelerate as the Fed raises rates and the economy slows. But if you look at where they are today relative to past market tops. Well, it’s a different story entirely. Just another data point to muddy the water and argue for weak opinions even more weakly held.
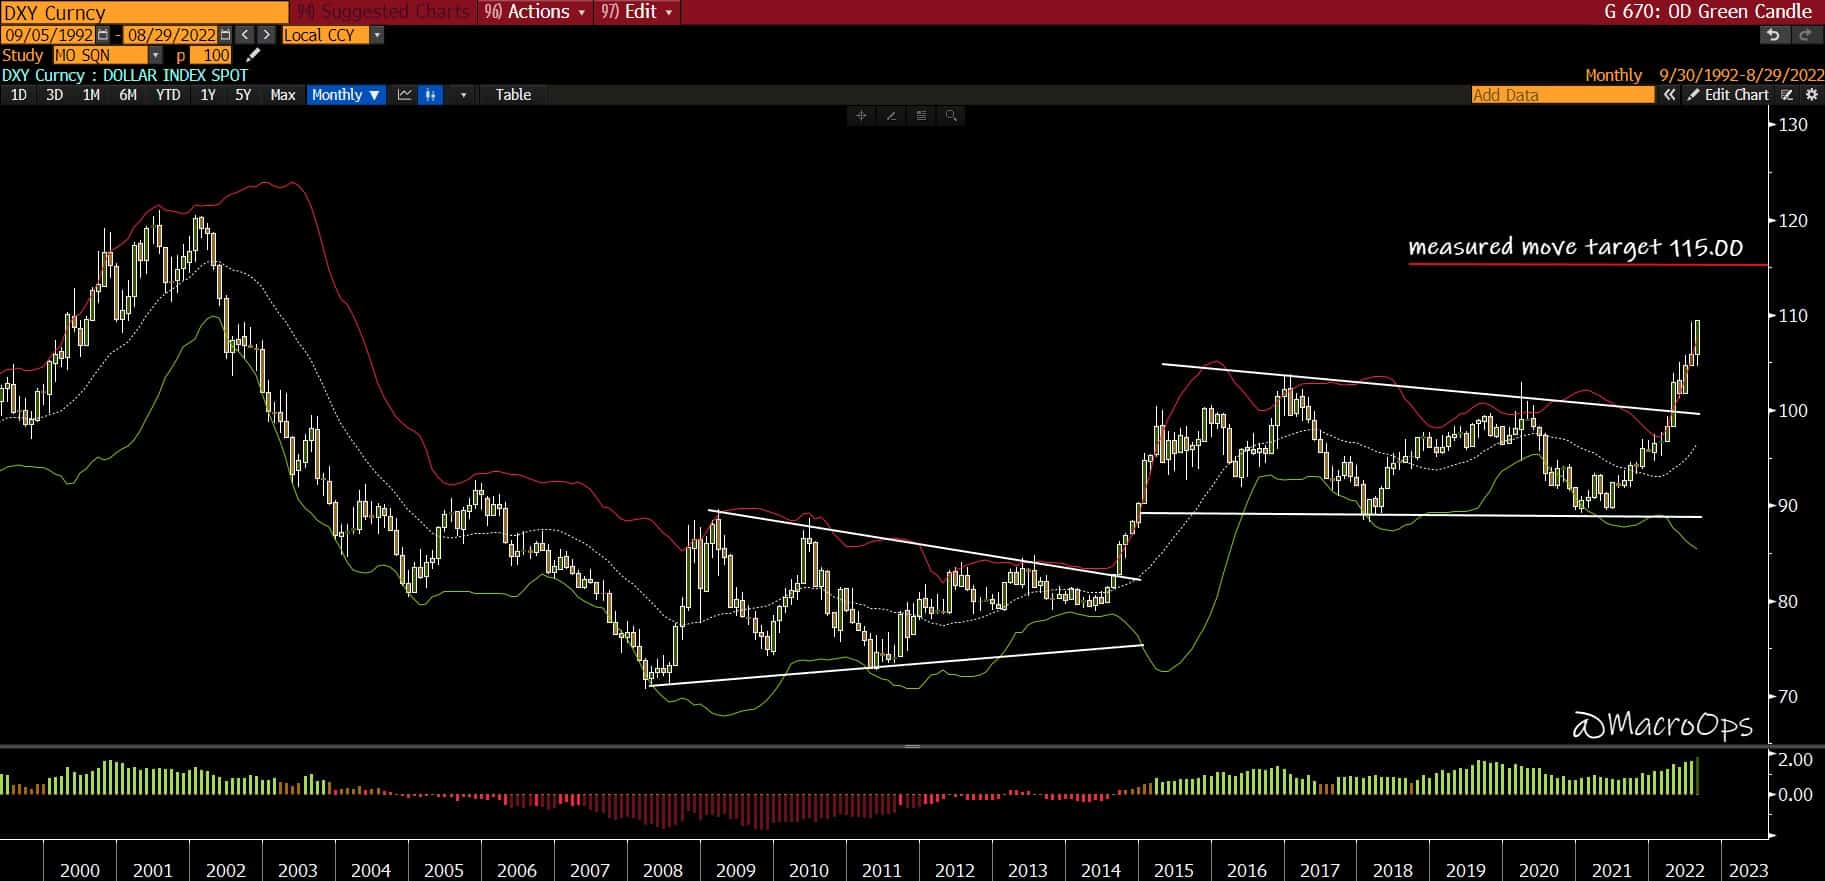
- Back in May, I wrote in these Dirty Dozen pages that “tHe uS doLlaR iS loSinG iTs gLobAL REseRvE cUrRencY STatuS bUY bItCOin… We are long DXY in the Collective and will add on technical setups”.
That trend is still very much intact. The measured move target on DXY is 115.
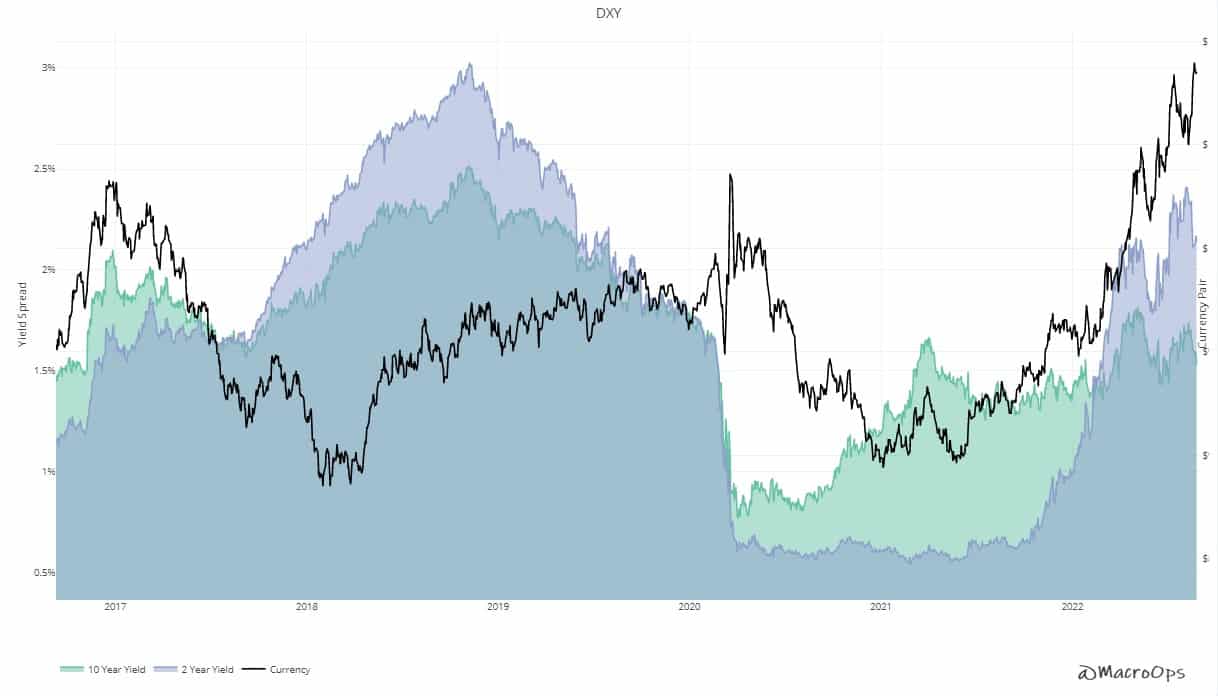
- Yield differentials have been the critical driver behind this parabolic move in the USD. The chart below from our Collective Heads Up Display (HUD) shows the 2, and 10yr yield differentials between the DXY weighted against its trading partners.
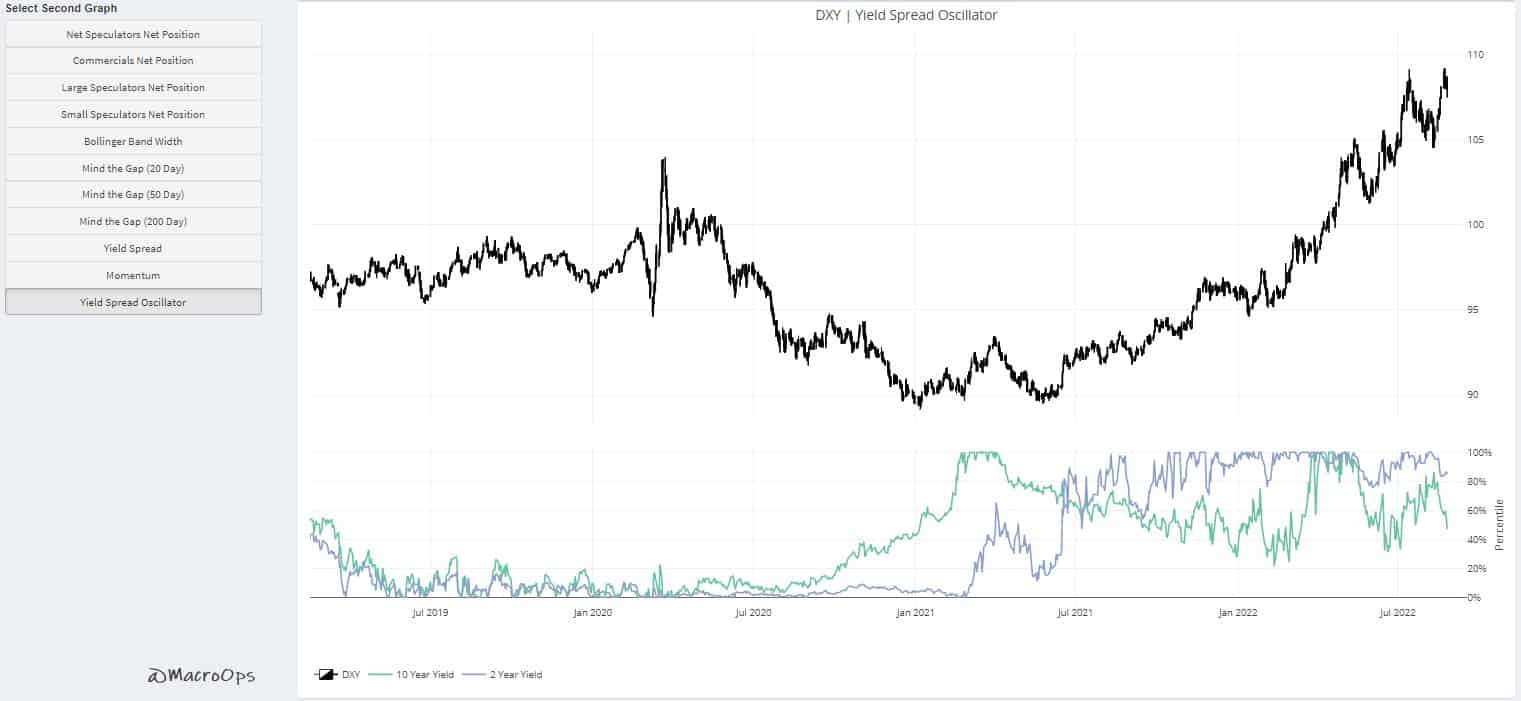
The second chart is our yield oscillator, which shows waxing/waning momentum in yields. This indicator is still positive for both 2 and 10yr yields (a positive reading is anything above 50%), but we’ll want to keep an eye on this as yield spreads tend to turn well before the currency does.
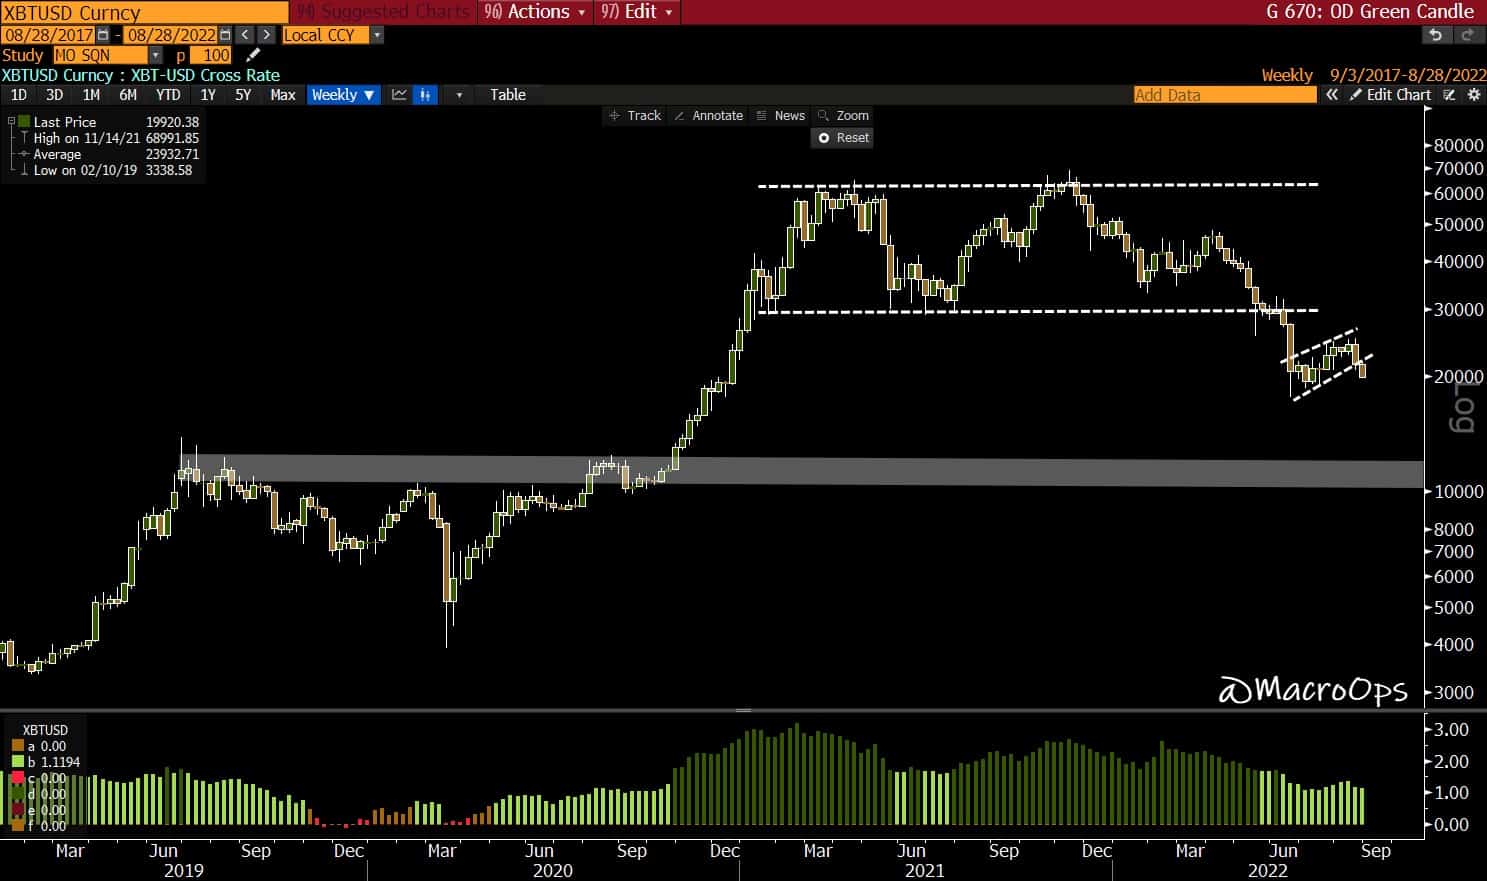
- Another way to play this other than being long USD majors is to short BTCUSD and ETHUSD (we’re currently short the latter). A fast-rising USD is a wrecking ball for risky assets. Of which, crypto is the poster child. I expect BTCUSD ends up near the 10k level before this cycle is over.
Thanks for reading.
Stay frosty and keep your head on a swivel.