An old-fashioned bear doesn’t stab you with a sword, as in the crash of 1987 and the mini-crash of 1989. It nicks you with a thousand cuts. ~ John Dorfman
Good morning!
In this week’s Dirty Dozen [CHART PACK] we look at bear market stats, recessions, panic insurance buying, credit cascades and more. Let’s dive in…
***click charts to enlarge***
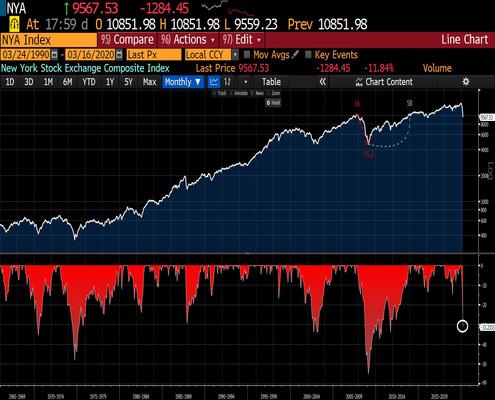
- The NYSE Index is down 32% from its all-time highs just two months ago. As a reference point, the index fell a total of 35% over the course of the 2-year long bear market in 2000. The second chart shows every peak to trough drawdown of the NYA over the last 60-years.


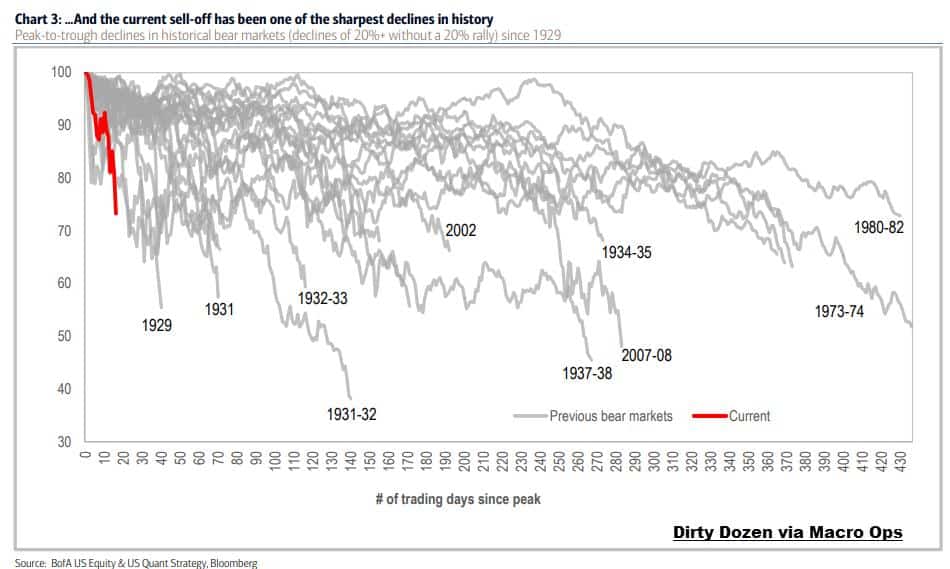
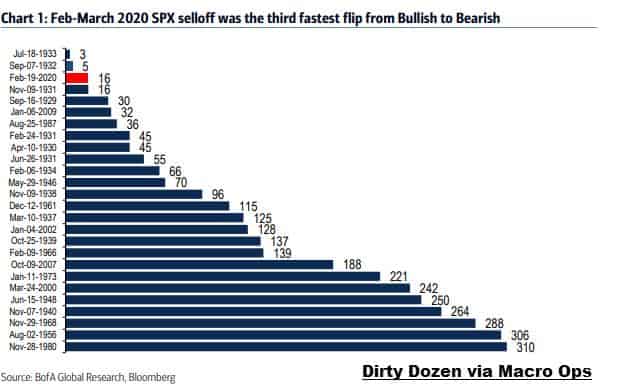
- This chart from BofA shows that this market peak to 20%+ decline has been one of the fastest in history.
- Apparently it’s the 3rd fastest flip from bullish to bearish trend in history, outdone only by the market selloffs of 32’ and 33’ (chart via BofA).
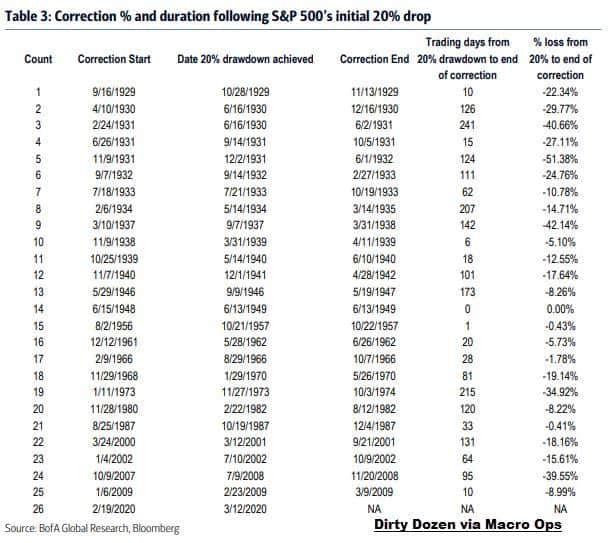
- The pain tends to linger following a 20% market drop. According to BofA, “The 25 bear markets from 1929 to-date saw corrections continue for 85 days on average (81 median) following the dip below 20% into bear territory on an average pullback of 18.41% (15.61% median)… While history does show us examples of quick turn arounds after moving into a bear market, the tendency is for pain to linger, with further downside, over the two to three months that follow the initial 20% drop”.
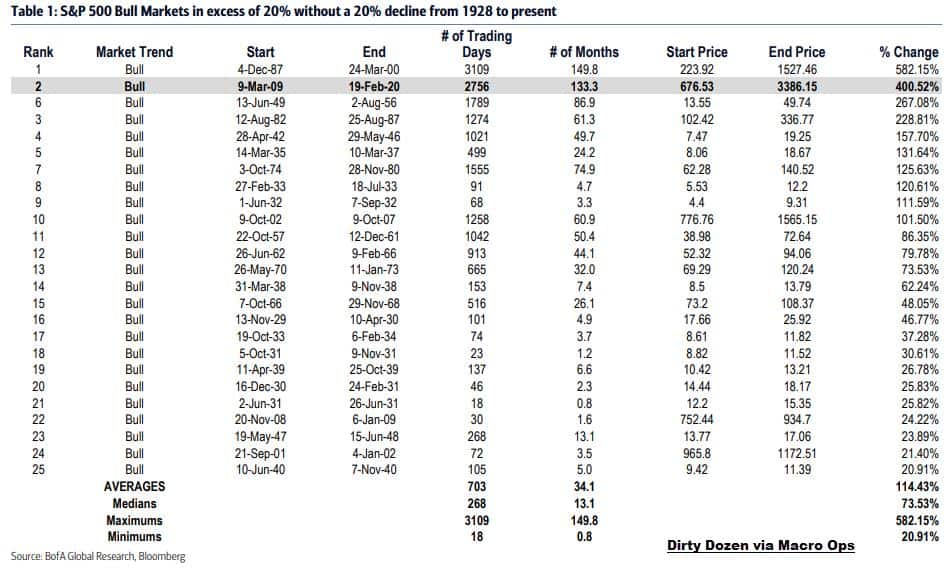
- BofA notes the historical context of SPX bear markets since 1929, writing:
-
- Median peak-to-trough price decline of ~30% (we have seen 26.7%)
- Peak to trough trailing P/E compression of 18x to 12x (we are at 13.9x)
- Bear market historically lasted about a year and a half (it has been just over 3 weeks)
- Peak of market has generally preceded an economic recession (if one occurred by three quarters).
- EPS peaks have varied but have occurred on average two quarters after the market peak.
- EPS recessions (which have not occurred in every bear market) have seen an average ~20% peak-to-trough decline.
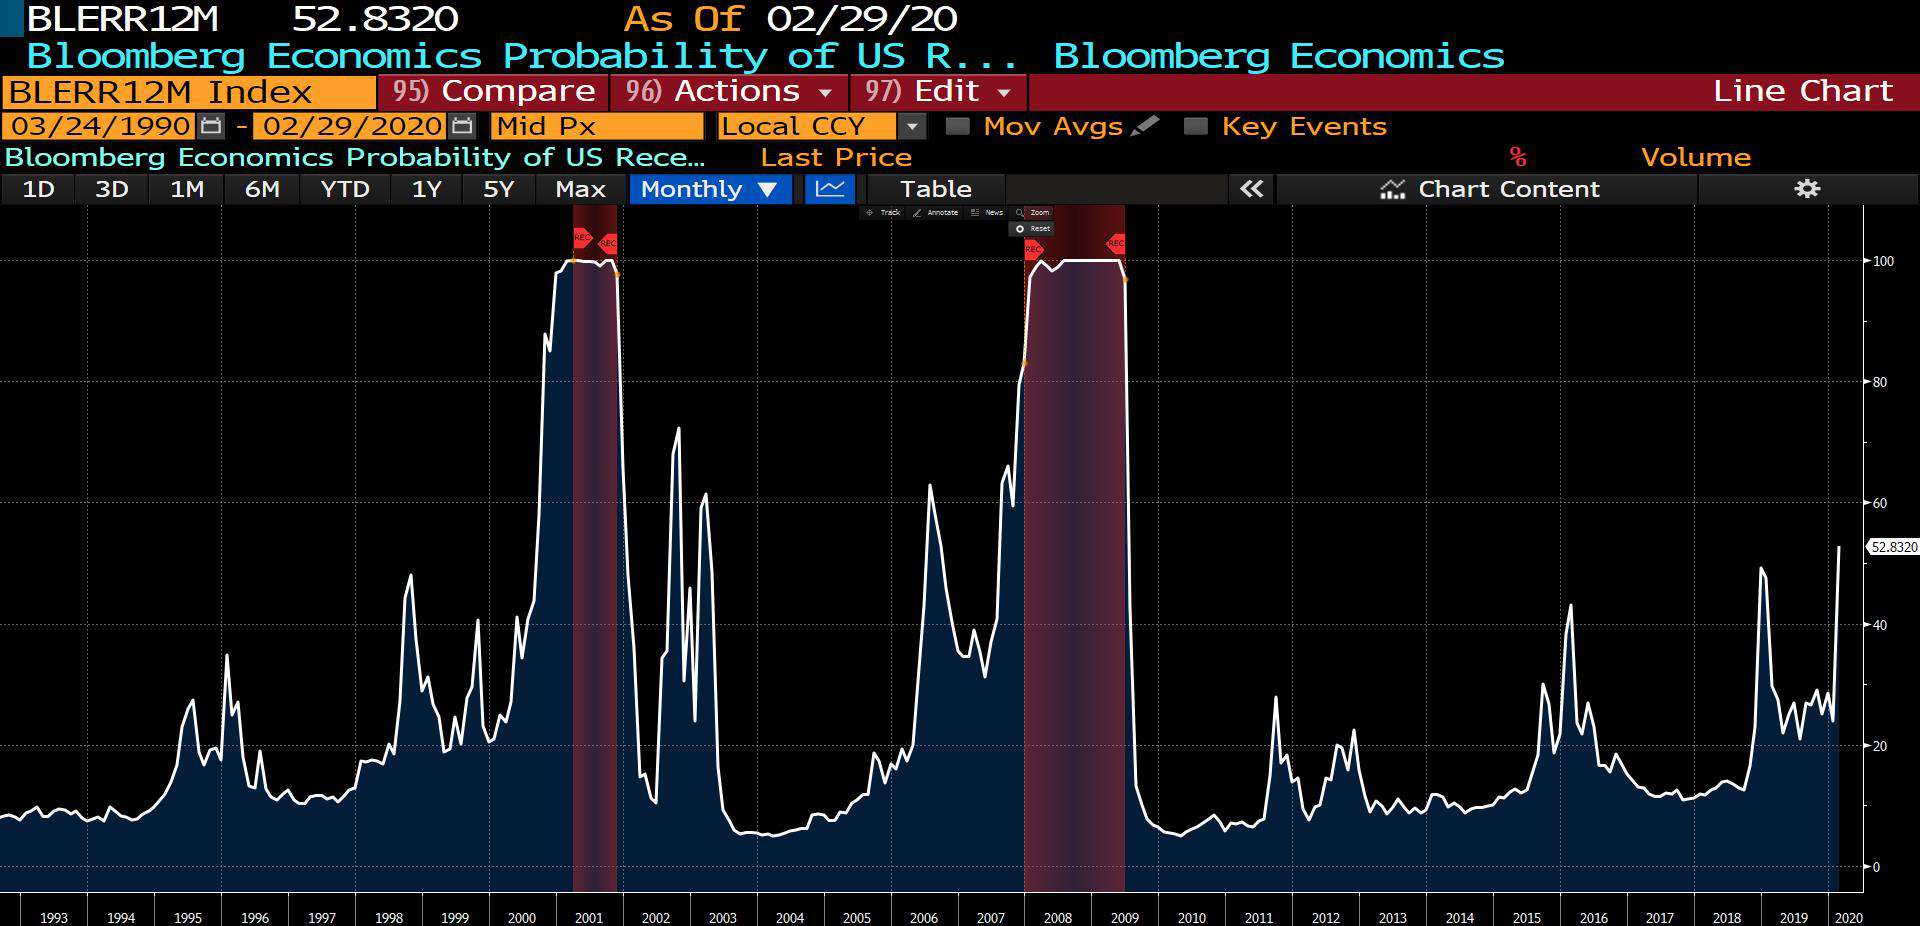
- It’s looking ever more likely that this virus is going to push us into recession. Bloomberg’s Recession Probability Index is at its highest point of this cycle. It’s currently showing a 53% chance of a recession within the next 12-months. I’d say those odds are a bit on the low side too.
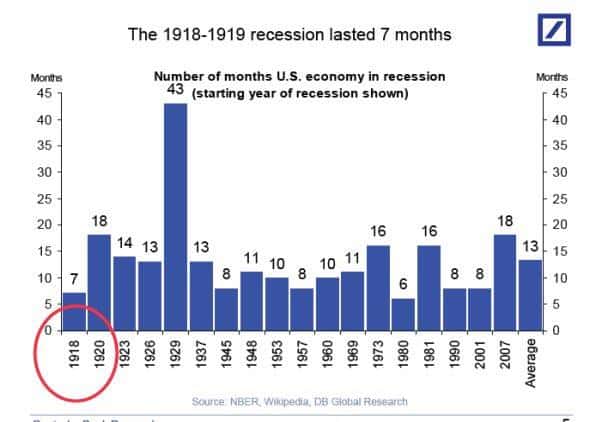
- The average recession lasts 13-months according to Deutsche Bank.
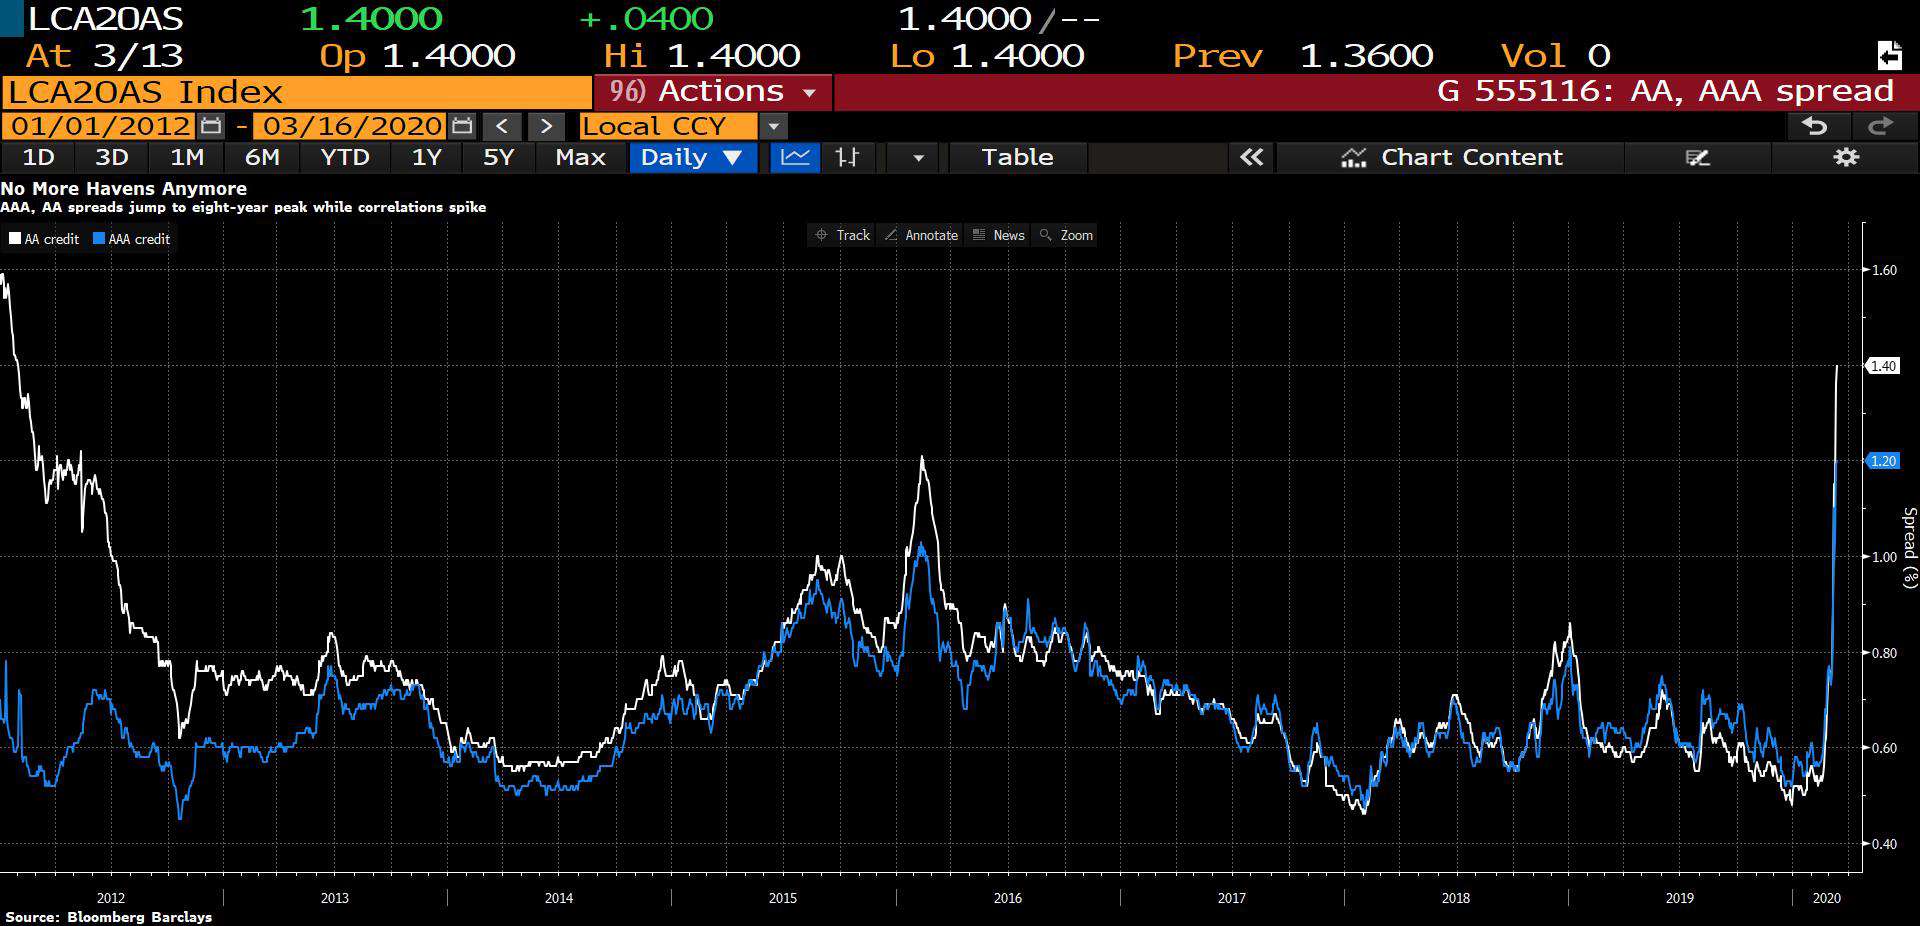
- The risks of a full-blown credit cascade (which I wrote about last week, here’s the link) are increasing. Even investment-grade credit spreads are blowing out and correlations are going to 1 as liquidity providers step back and de-risk their exposure.
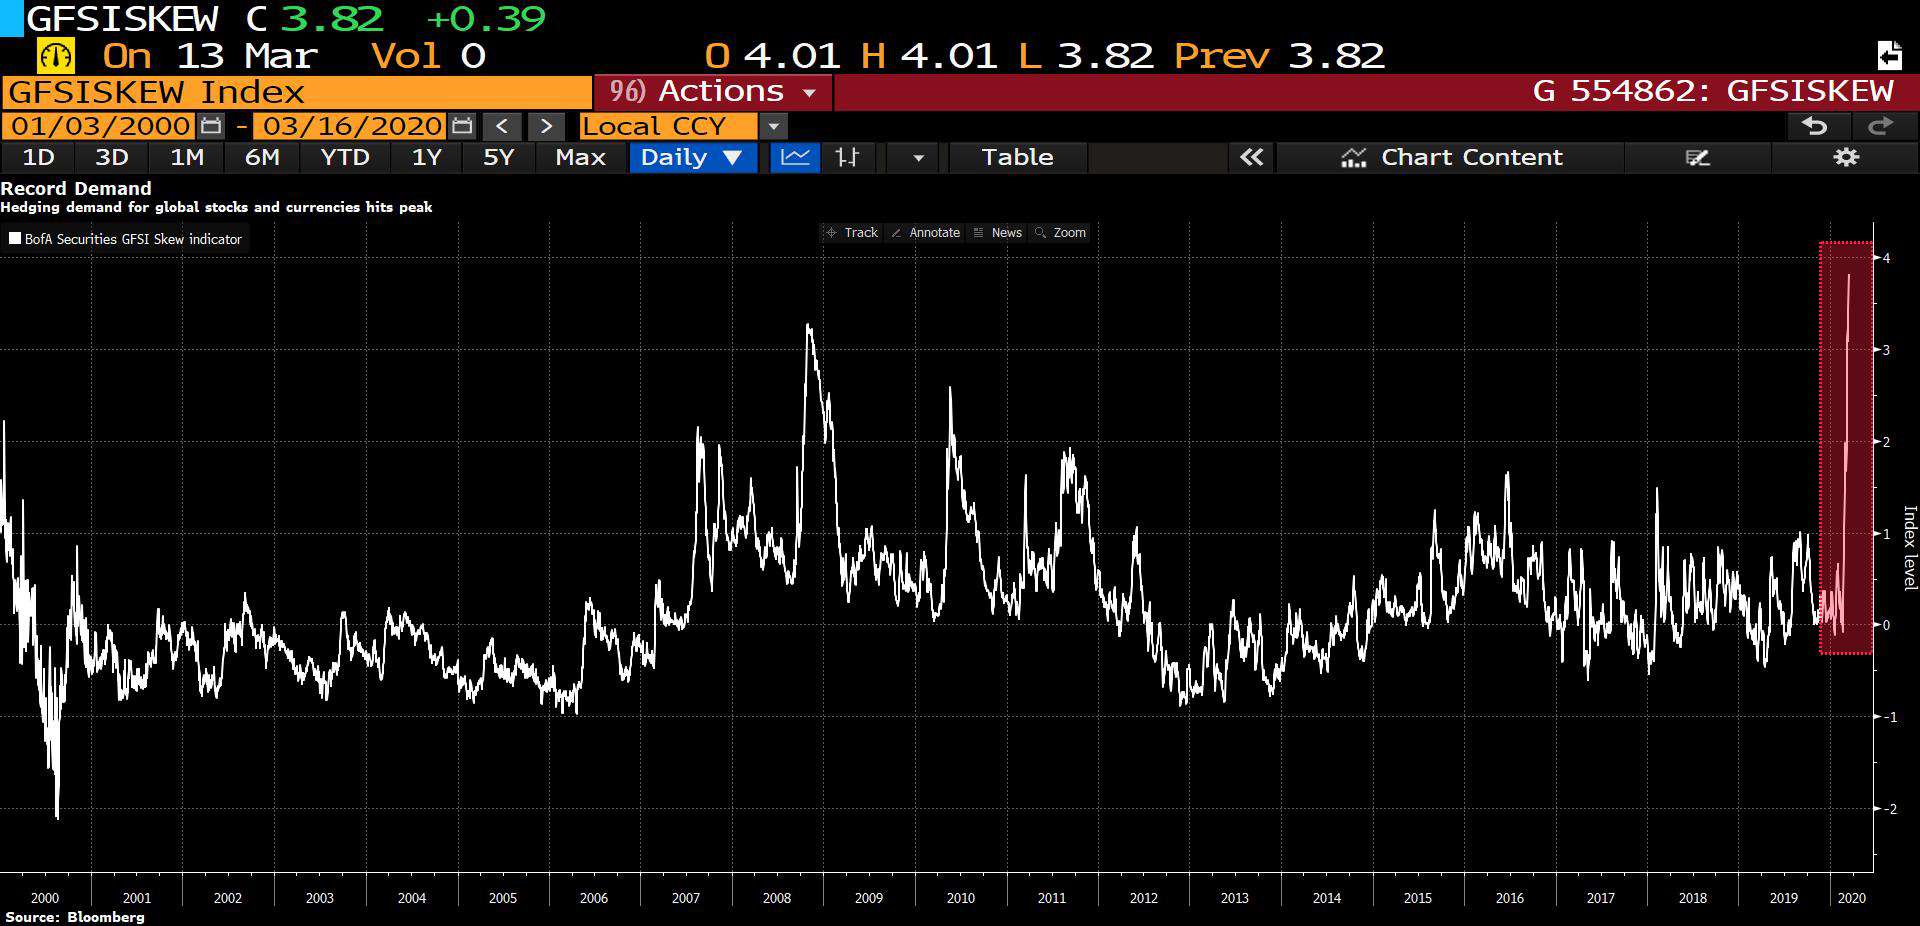
- In another sign of increasing investor panic, BofA’s GFSI Skew Index which measures investor demand for downside protection just hit an all-time high.
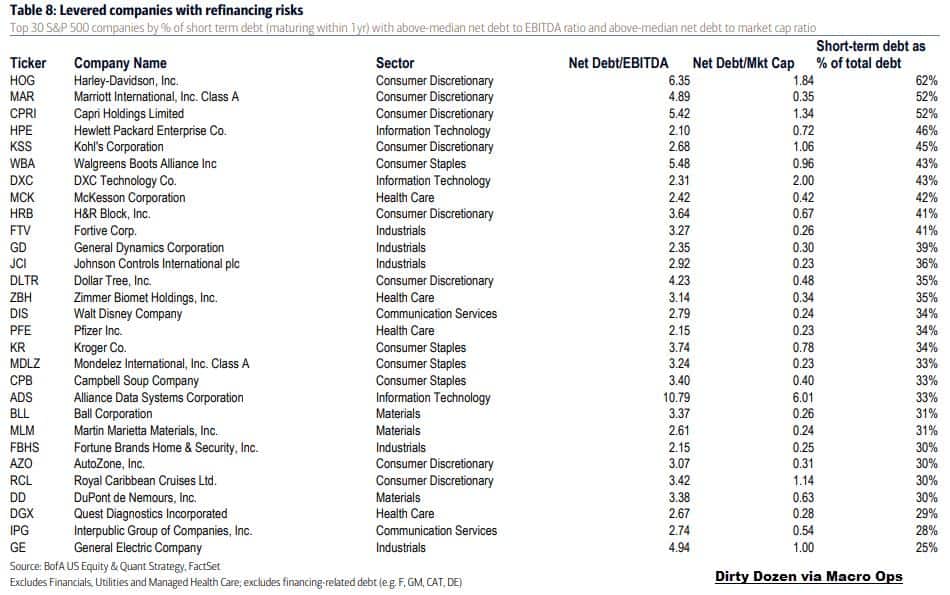
- Companies with the most leveraged balance sheets have been getting hit the hardest. This list from BofA shows the top 30 S&P 500 companies with the most refinancing risks (ie, good potential short candidates).
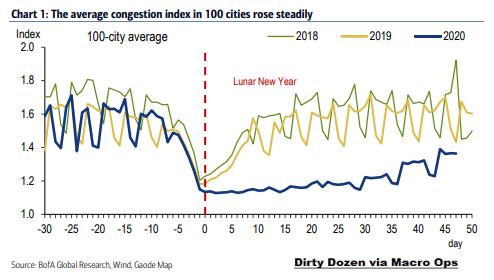
- There is some good news though and that is that the data shows China’s economy is slowly trending up to more normal levels of activity. A stable and growing China is needed to help put a floor under commodity prices.
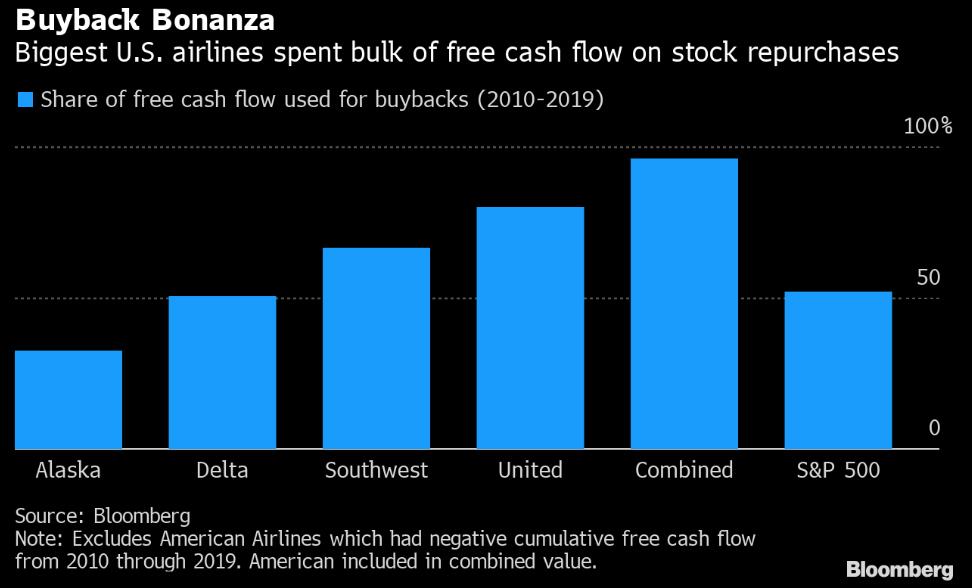
- And finally, you may have heard about the CEOs of US airline companies asking for a $54bn government bailout. Now, it’s understandable that airlines, one of the hardest-hit industries from this virus, would need some financing to help them weather the storm. But… at the same time, maybe US companies need to learn to keep a rainy day fund for such exogenous shocks. Instead of, say, spending “96% of free cash flow” over the last decade to buy back their own shares — which, just so happens to boost said CEOs takehome pay.
Stay safe out there and keep your head on a swivel!