It is the courage to make a clean breast of it in the face of every question that makes the philosopher. He must be like Sophocles’ Oedipus, who, seeking enlightenment concerning his terrible fate, pursues his indefatigable inquiry even though he divines that appalling horror awaits him in the answer. But most of us carry with us the Jocasta in our hearts, who begs Oedipus, for God’s sake, not to inquire further. ~ Arthur Schopenhauer, in a letter to Johann Wolfgang von Goethe
(Housekeeping note: I sent out an email last week breaking down the repo market and explaining why the spike in ON rates is not a huge deal. A few paragraphs were accidentally left out of the email so if you’d like to read my full note on the topic then click here.)
Good morning!
In this week’s Dirty Dozen [CHART PACK] we look at MORE bearish positioning across equities, fund managers buying protection against a fall at a record rate, signs of an intermediate top in gold, and macro indicators that say a recession is still a long ways off, plus more. Here we go…
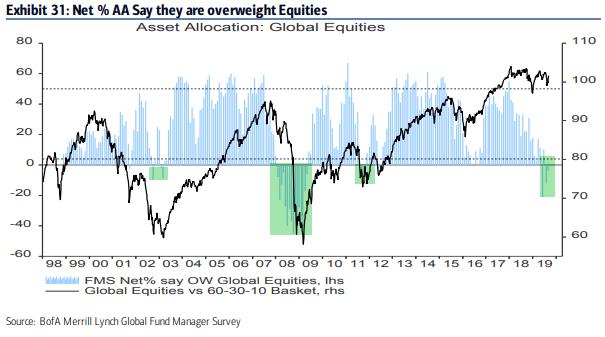
- Those of you who are members of our Collective are already familiar with this one. But it’s one of the most important charts right now which is why I’m showing it again. The latest BofAML Global FMS shows that fund managers have their lowest exposure to equities since 09’. Investors across the board — from professional to retail — are positioned for a crisis.
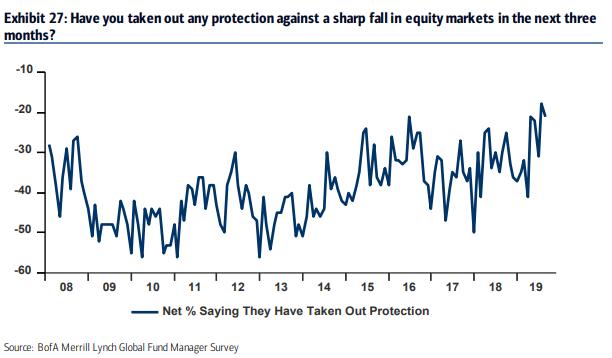
- From the same survey: Fund managers are buying protection against a drop in the market at their highest rate for which there is data. Once again… Investors are expecting DOOM.
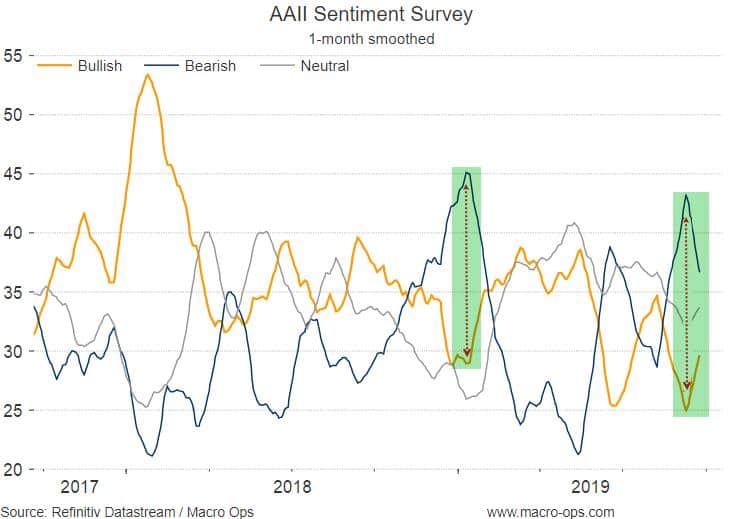
- The 1-month smoothed gap between bears (blue line) and bulls (orange line) is reverting from its widest point since the start of this year.
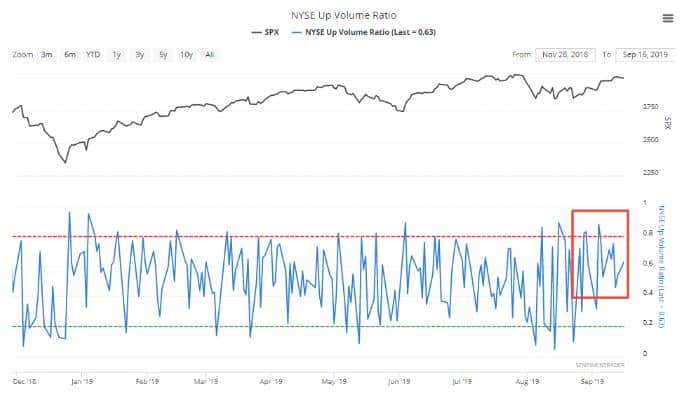
- And yet, markets are within a hair’s breadth from all-time record highs. In addition, we’re seeing a plethora of extremely strong positive breadth signals in most major markets around the world. @MacroCharts did an excellent job highlighting these in his recent post (link here). This NYSE Up Volume Ratio is just another one of these charts. It shows that more money is flowing into stocks that are going up versus ones that are going down (chart via Sentiment Trader).
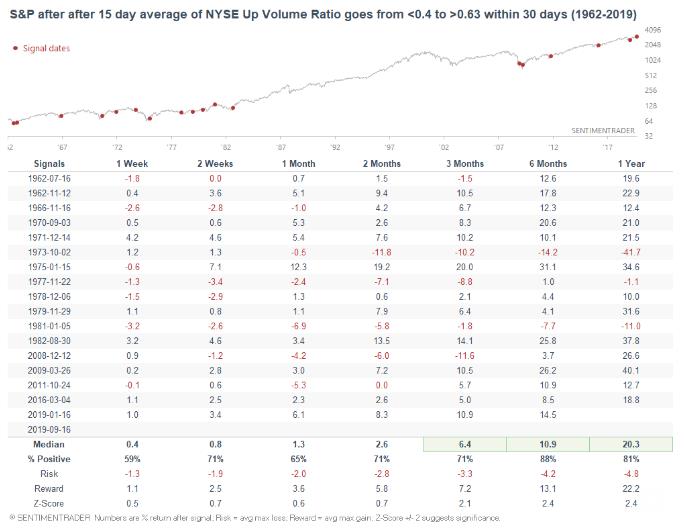
- When this has happened in the past, the market has tended to rally significantly over the following 6-12 months (table via Sentiment Trader).
- I believe its high odds that a new major leg of this bull market kicks off within the next 3-weeks — possibly following one more dip lower to trap the bears. If so, crowded safe-haven trades such as bonds and gold, are going to get crushed. Take gold for example. It’s currently trading above its upper monthly Bollinger Band.
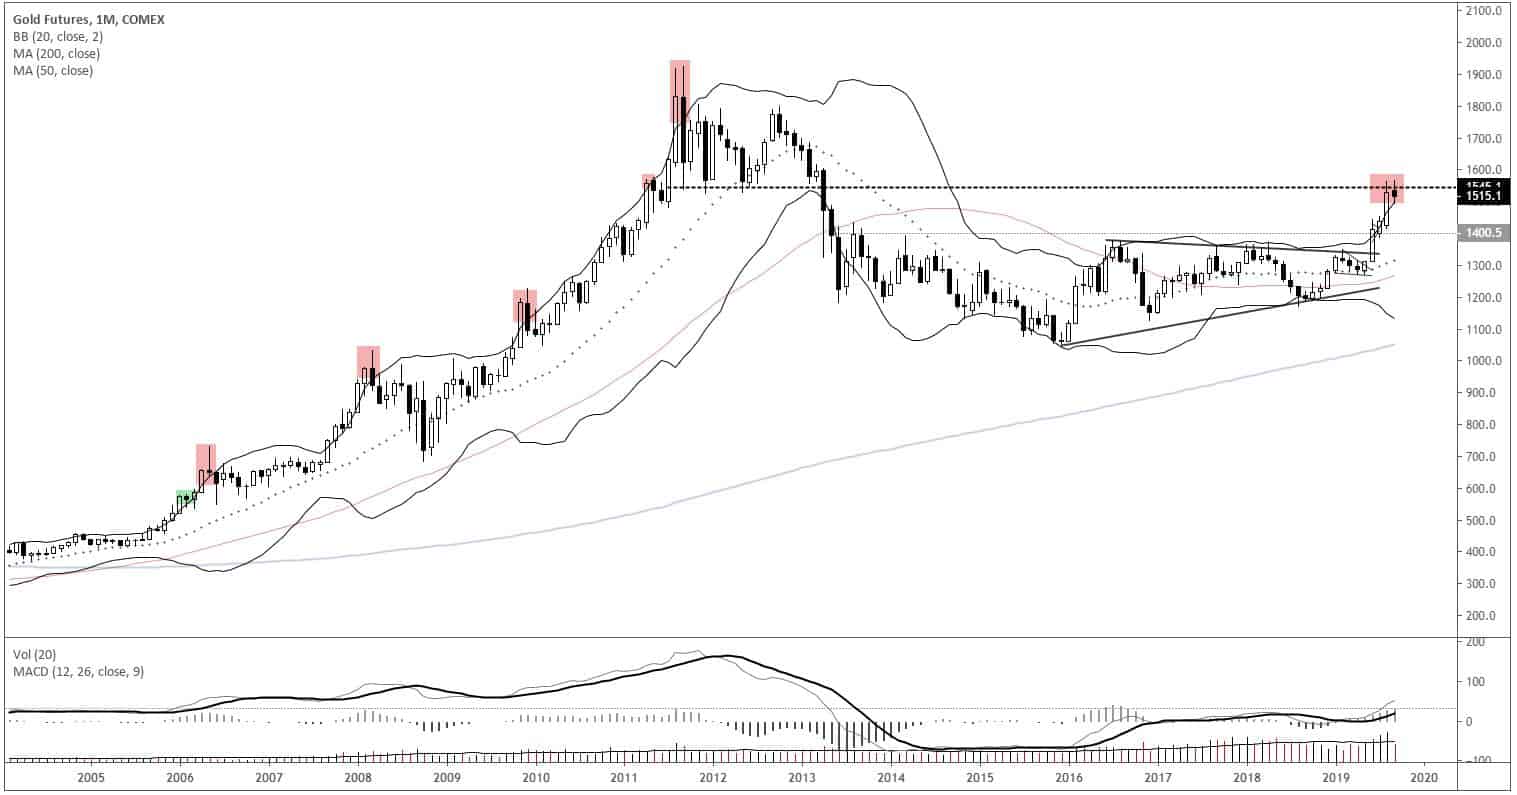
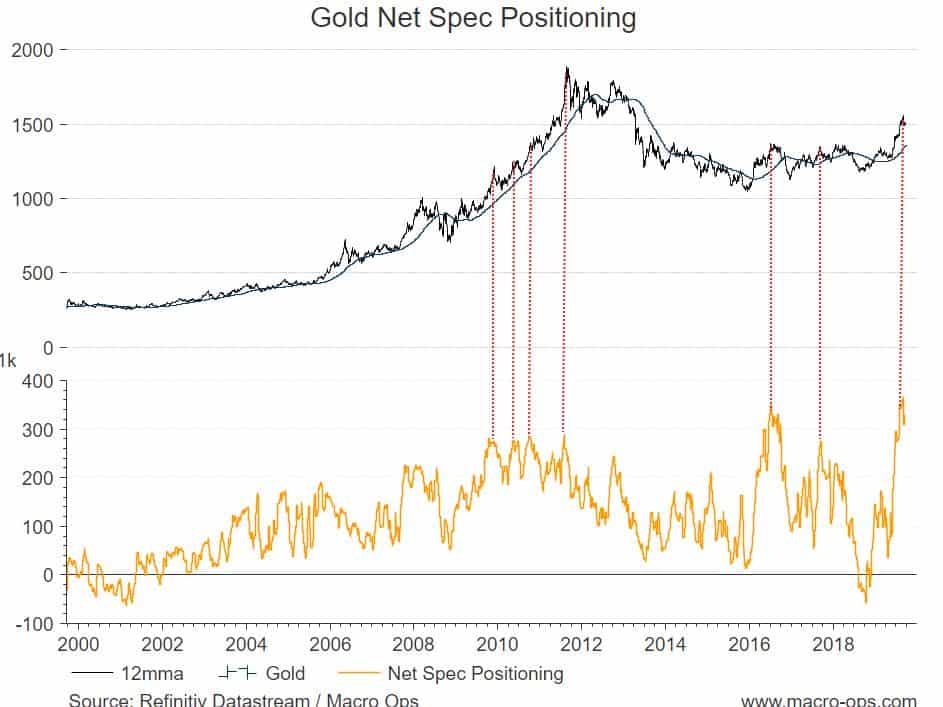
- Net Spec positioning is near record levels. This trade is CROWDED. I think it pulls back to near the $1,400 level. Looked at on a daily timeframe, it appears to be forming a small H&S top. A break below the $1,490 level would confirm this short setup. For what it’s worth, I’m bullish gold longer-term (and have made some good money on this trend higher) but I expect we’ll see a multi-month pullback and consolidation begin soon.
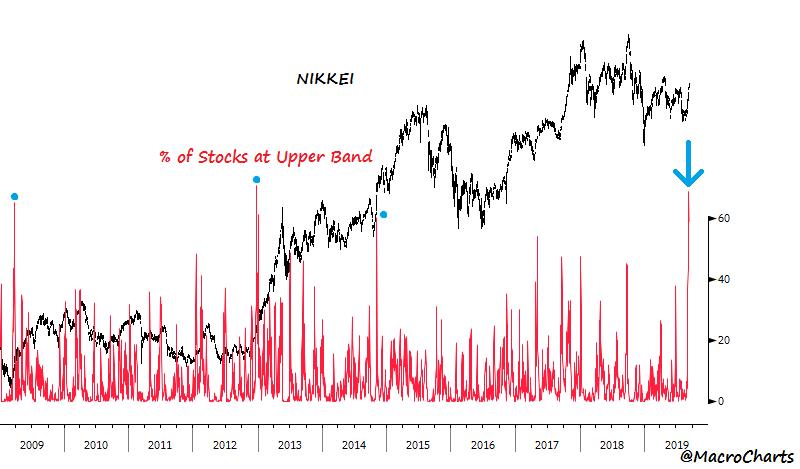
- A few weeks ago I pointed out the bullish technical setup in Japan’s Nikkei and shared some fundamental factors for why I like long trade (link here). @MacroCharts had a number of great charts in his breadth writeup and here’s one of my favorites on the Nikkei. It shows the collective breadth thrust that just occurred by graphing the percentage of Nikkei index stocks that just hit their upper BB. Note the last three times this happened.
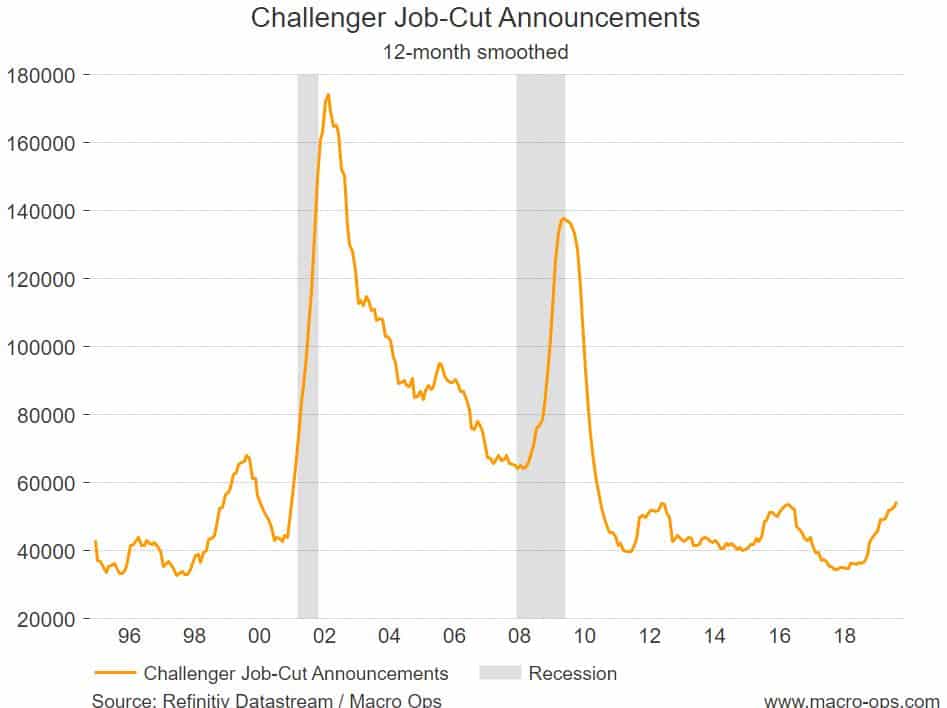
- I didn’t want to leave the bears amongst you completely unfed, so here’s a chart showing the 12-month moving average of US Challenger Job-Cut Announcements. The vast majority of my labor indicators are either bullish or neutral but if this keeps trending higher then we’ll want to take note.
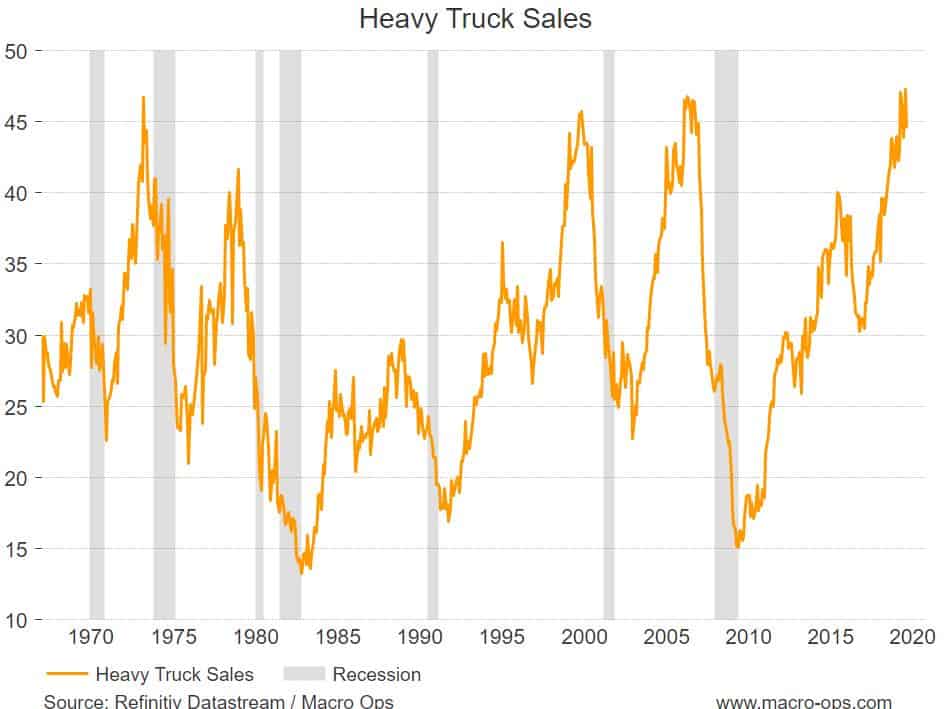
- Heavy truck sales (a solid leading econ indicator) though are right up near cycle highs. Heavy truck sales tend to lead both market tops and recessions by a good amount.
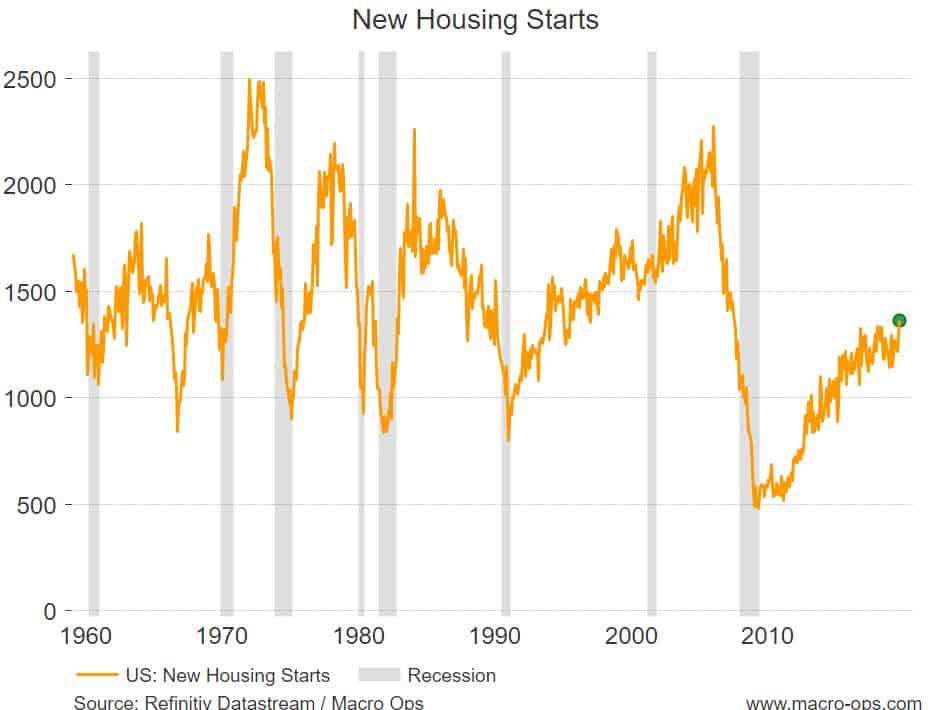
- Another high-fidelity recession indicator just made new cycle highs. US New Housing Starts have completely recovered from their December lows which shows the US consumer is alive and well. Housing starts typically peak 2-years or more before a recession (the median lead time is 28m from expansion high to the start of a recession).
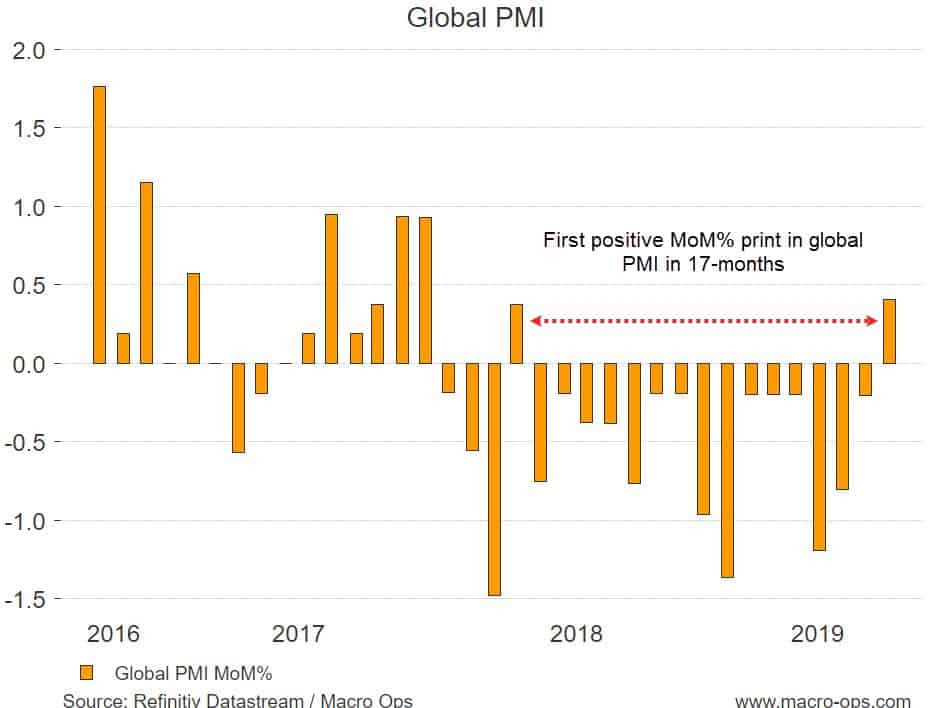
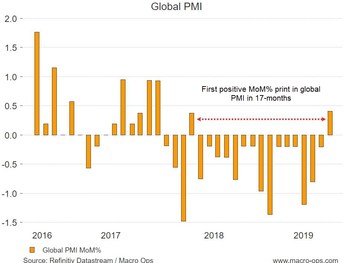
- And one final shot across the bear’s bow. Global PMI which has been contracting since May just put in its first positive month-over-month print since April of last year. Now, I know, hardly does 1-month make a trend but this might be the start of the turn.