The point of forecasting is not to attempt illusory certainty, but to identify the full range of possible outcomes. ~ Paul Saffo
Good morning!
In this week’s Dirty Dozen [CHART PACK] we look at more charts showing the pervasive bearishness amongst investors; from sentiment near multi-decade lows to persistent outflows in EM stocks. We also check out seasonality, some gold charts and more. Here we go…
- Credit Suisse’s Global Risk Appetite is at depressed levels showing investors around the world have grown increasingly bearish.

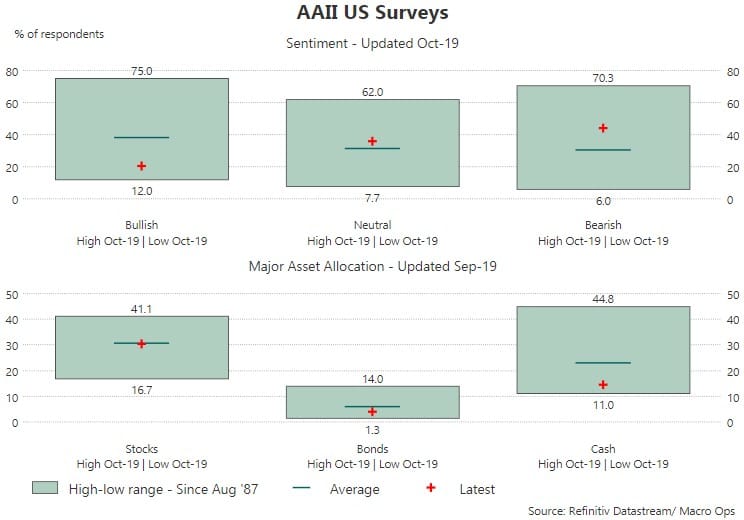
- Individual Investors in the US aren’t immune to the negativity. AAII %Bulls is near 30-year lows.
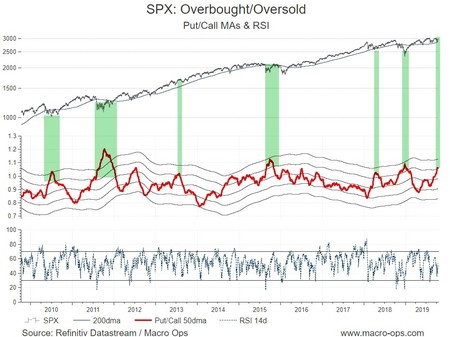
- The 50-day moving average of the Total Put/Call ratio is close to 2 Stdev above its 12-month rolling average. This means investors have been persistently buying downside protection at a high rate. Similar trends in the past have tended to mark major bottoms.

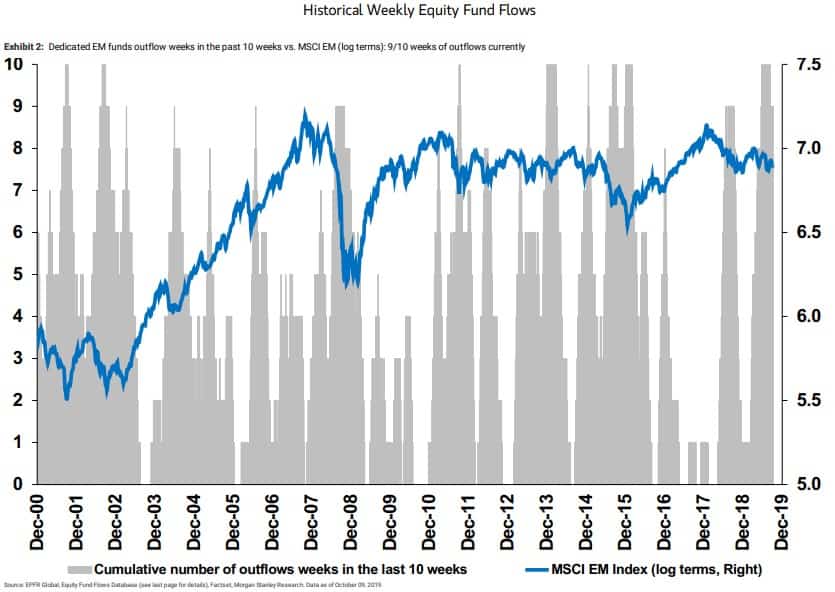
- Investors across the board (from retail to institutions) have been net sellers of EM stocks since the start of the year (chart via MS).

- The chart below from Morgan Stanley shows how consistent these outflows have been week after week.
- The graph below shows GEM Fund Manager weighting relative to the MSCI EM Index (via MS).

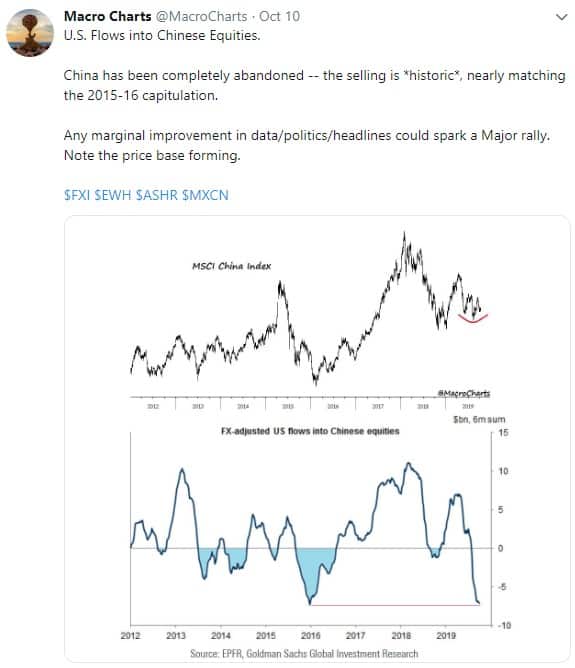
- @MacroCharts recently shared this great chart showing the FX-adjusted US flows into Chinese equities. The outflows are at extremes. I agree with his thinking below. Many EM charts have built a nice coiled base. Weak hands look like they’ve all been washed out. It’s not going to take much in the way of “positive surprises” to reverse these flows.
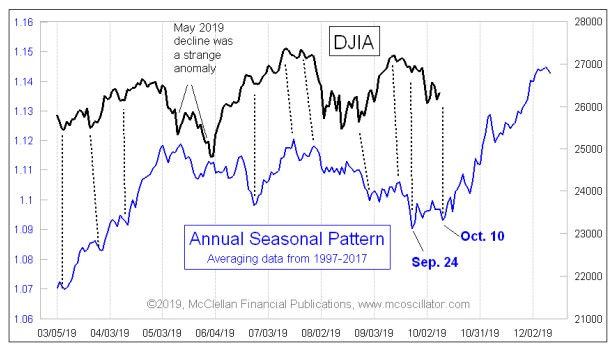
- Tom McClellan noted in a recent blog post (link here) how the equity market’s seasonal have been shifting forward in recent years.
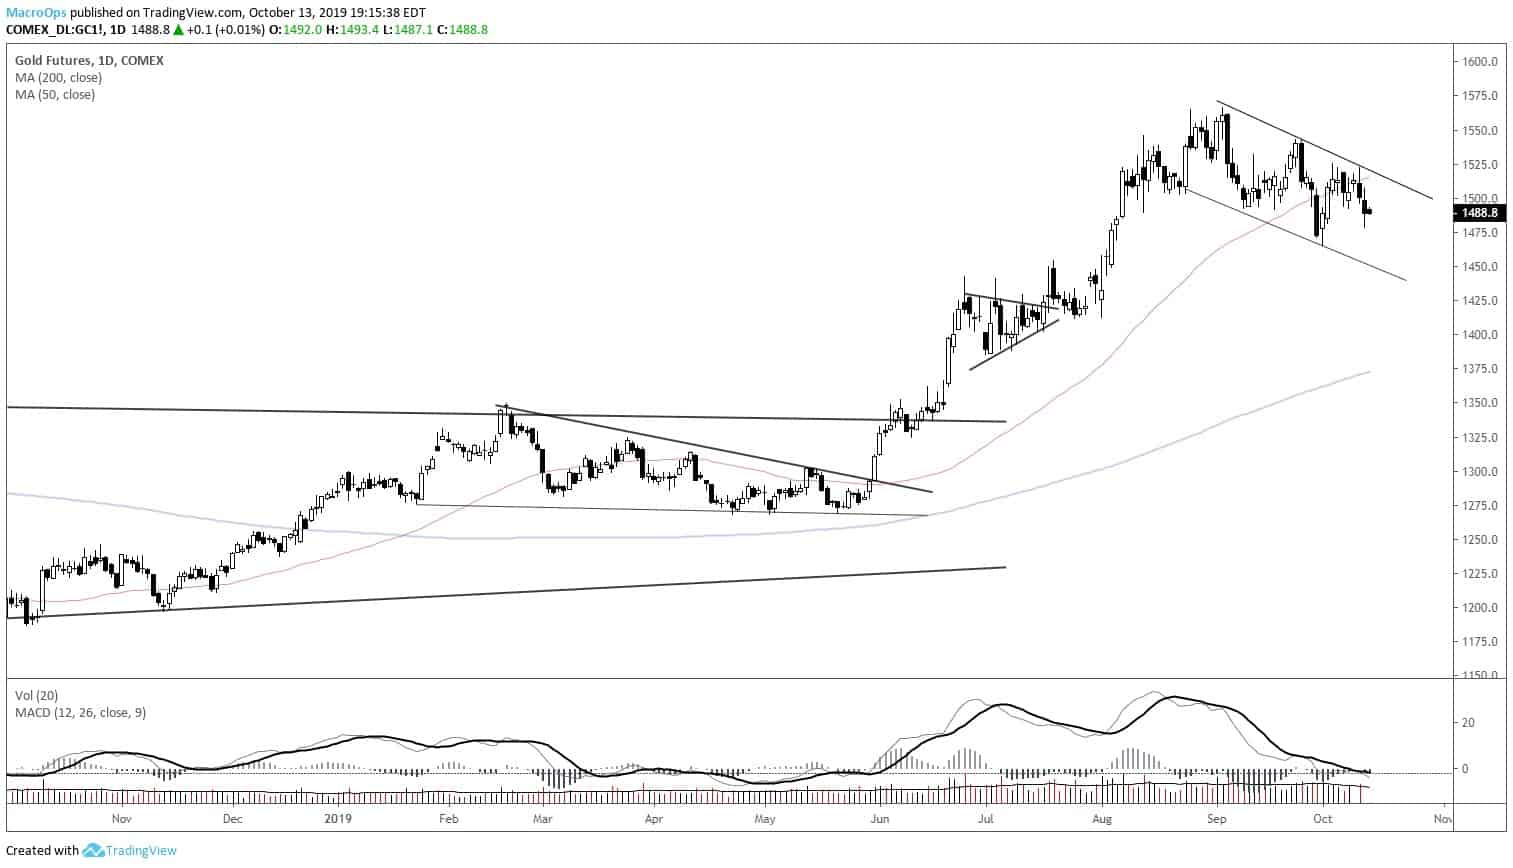
- If stocks start getting bid and we enter a new period of risk-on then bonds and gold should continue their recent bouts of weakness. Expect gold to continue to retrace and consolidate for a while.
- It’s probably going to take a few weeks if not a couple of months to work off the sentiment and FOMO buying that chased into this rally over the last few months. The chart below shows CFTC open interest (for futures only) spiking to all-time highs. We can see that similar spikes in speculation in the past have preceded extended retracements.
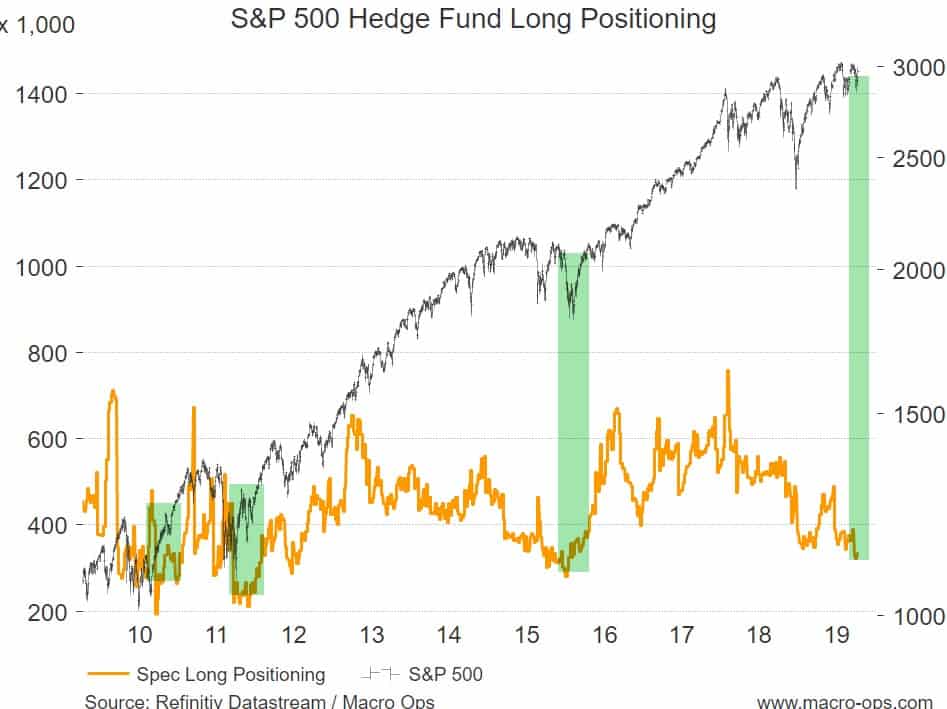
- Another data point showing extremely bearish positioning. Spec longs in the S&P are near levels that have marked major bottoms in the past. I hope you’re seeing the pattern here…
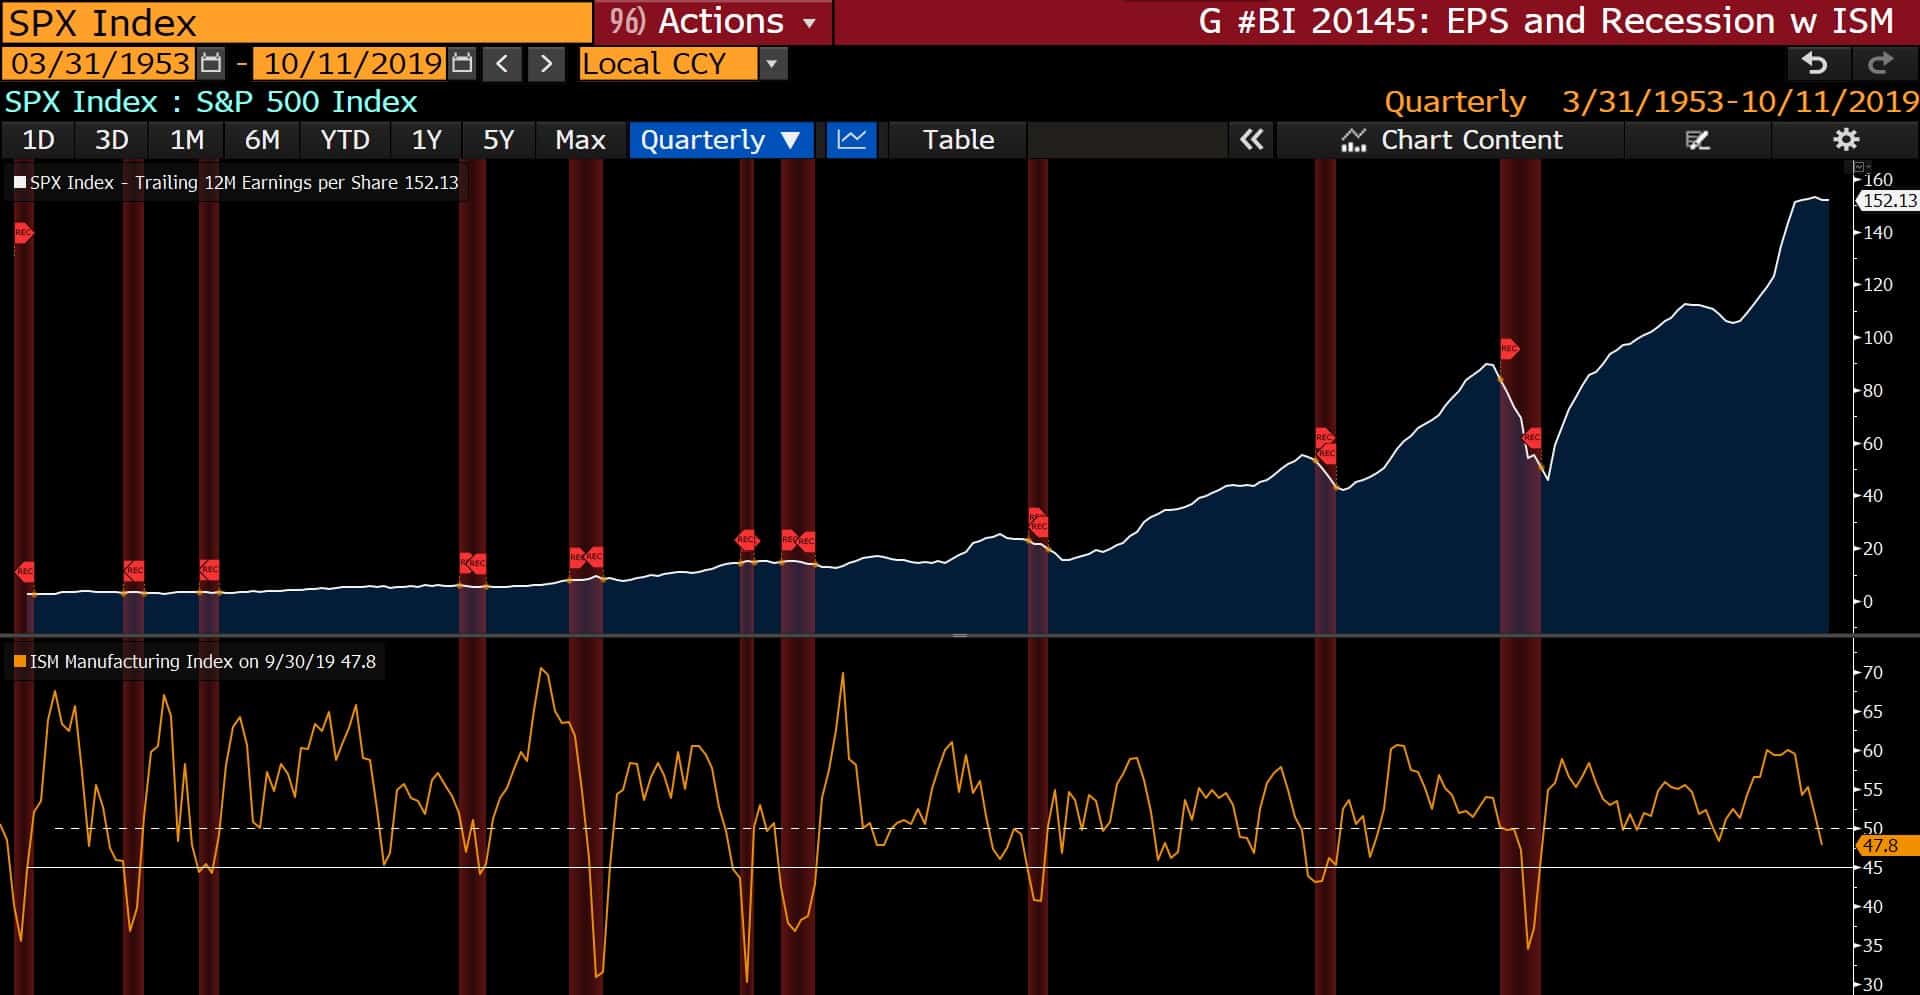
- We’re going to need to see the ISM bottom soon (I think it will) or else the odds increase that we’re on the cusp of an earnings recession. The chart below shows the ISM Manufacturing Index and TTM EPS for the SPX.