History repeats itself – first as tragedy, second as farce. ~ Karl Marx
In this week’s Dirty Dozen [CHART PACK] we look at Democratic Primary probabilities, then give a coronavirus update along with potential regional economic impacts, and end with some monthly and weekly charts on major assets along with a high-probability short setup. Let’s dive in…
SUBSCRIBE TO THE MONDAY DIRTY DOZEN HERE
***click charts to enlarge***
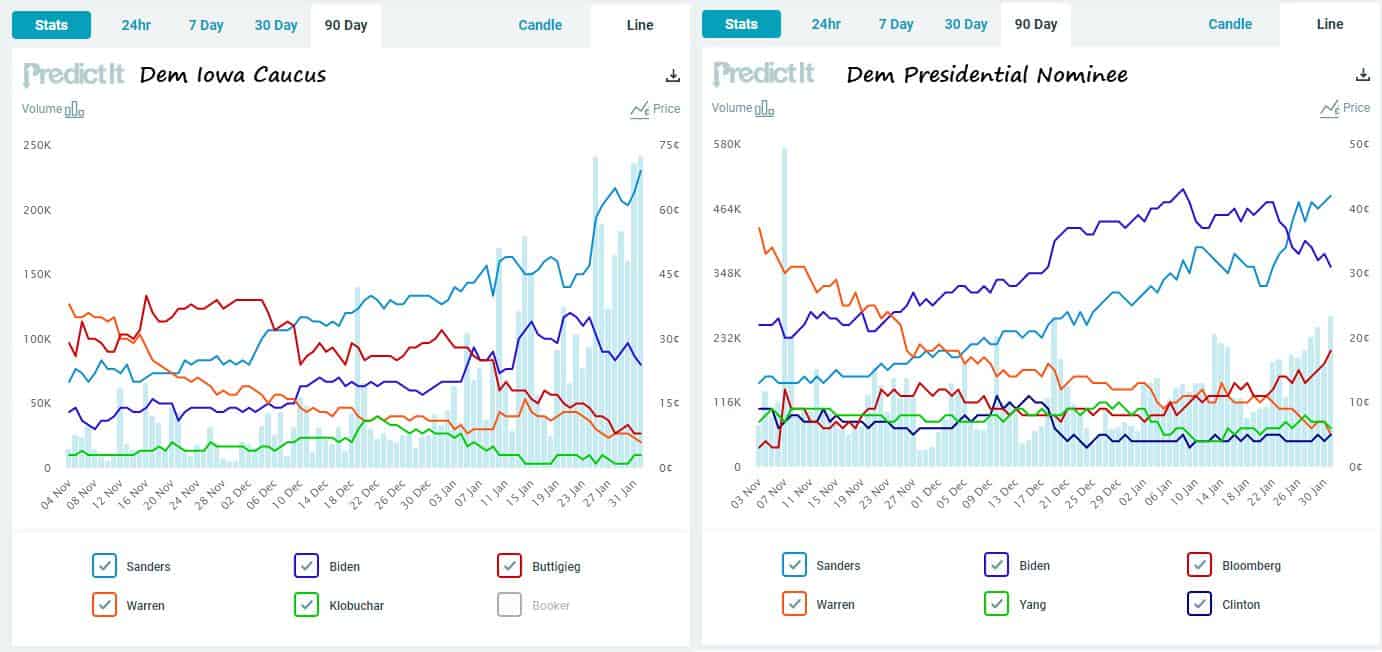
- The Iowa Democratic caucus is today. PredictIt, an online betting market, currently has Bernie Sanders as the clear frontrunner in both the Iowa Caucus and overall Democratic primary; recently overtaking Joe Biden for the top spot. Sanders, a Democratic Socialist and someone who was heavily involved in a Marxist Political Group called the “Socialist Workers Party” in the 80s, has a very good chance of being the Democratic Presidential Nominee. If so, we could very well expect some interesting action in bonds, the dollar, and big tech stocks in the months ahead. Keep a close eye on this one.
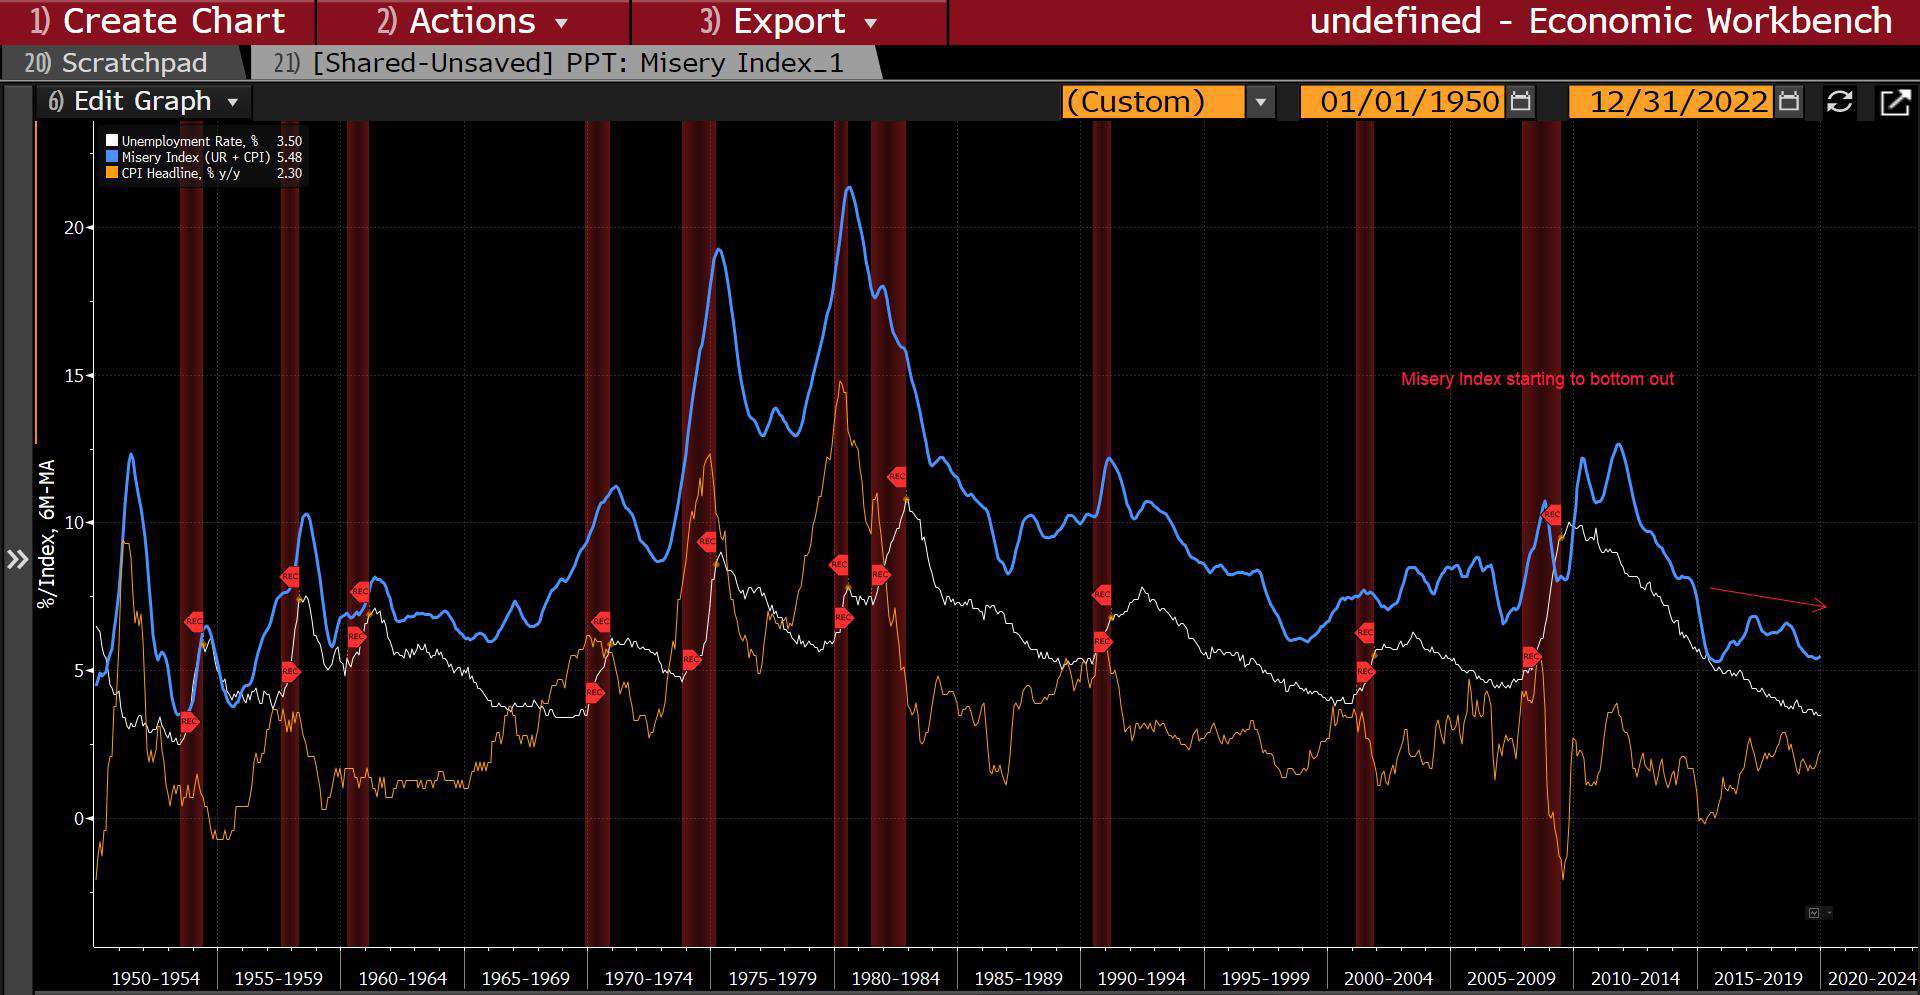
- The Economic Misery Index, which is a measure of the level of unemployment and the rate of inflation, has a high success rate in predicting whether the incumbent President will be re-elected. It currently has Trump coasting to an easy win, with both inflation and the unemployment rate low. But… it’s a long way between now and November and as Bloomberg recently noted: “expectations for sub-2% GDP growth and a mild uptick in unemployment would nudge the Misery Index into tossup territory.”
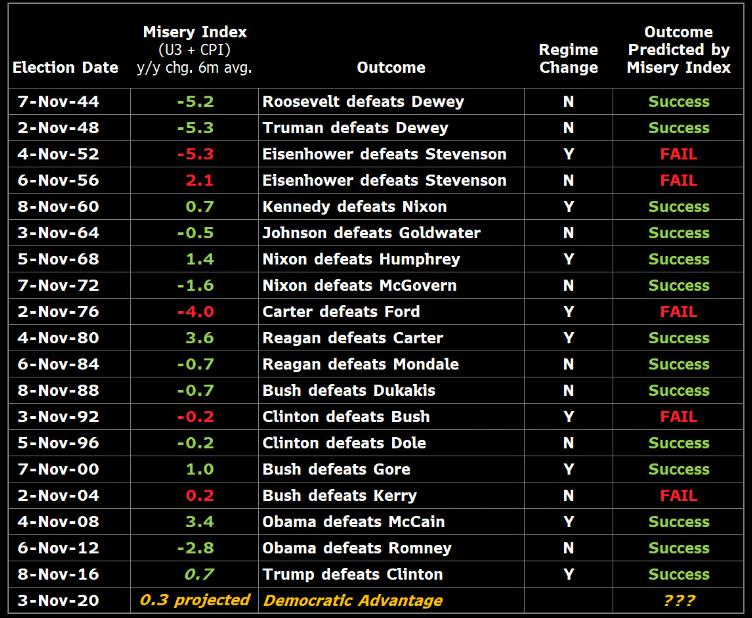
- Below is the index’s record. According to Bloomberg, “the trend in the index as election day approached accurately signaled voters’ sentiment toward the incumbent or incumbent party. This gauge’s movement in the year preceding an election accurately predicted 75% of outcomes since 1944 and 80% post-Eisenhower.”
- I’ve written a number of times over the last few weeks about how the market was ripe for a 5%+ sell-off, due to historically stretched levels in sentiment, positioning, and trend. The market is now down 4% from all-time highs and odds are we see at least one more leg lower. This retracement — I say retrace because we are still firmly in a longer-term bull trend — will likely be exacerbated by the above political narratives as well as concerns over the coronavirus.
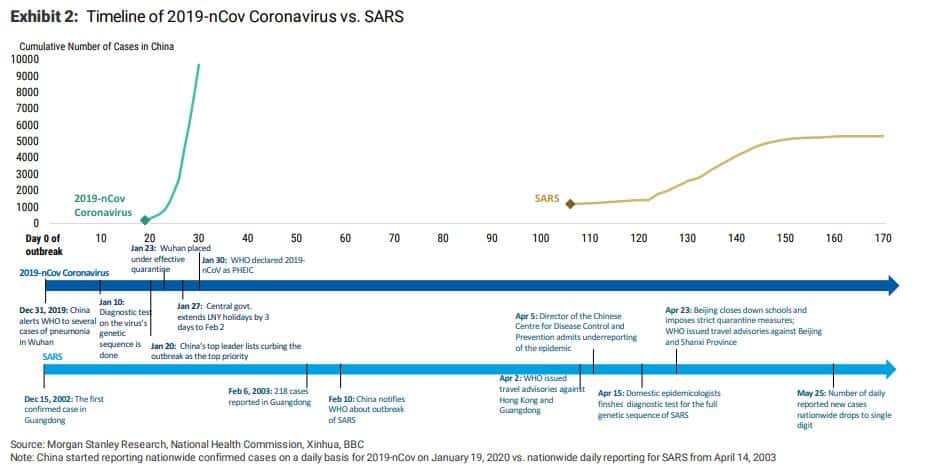
This graph from Morgan Stanley shows a timeline comparison between the coronavirus and SARS. China currently has cities with a combined 40m+ inhabitants on total lockdown. Even if the virus’ growth rate peaks soon, we’ll still see a considerable hit to China’s GDP.
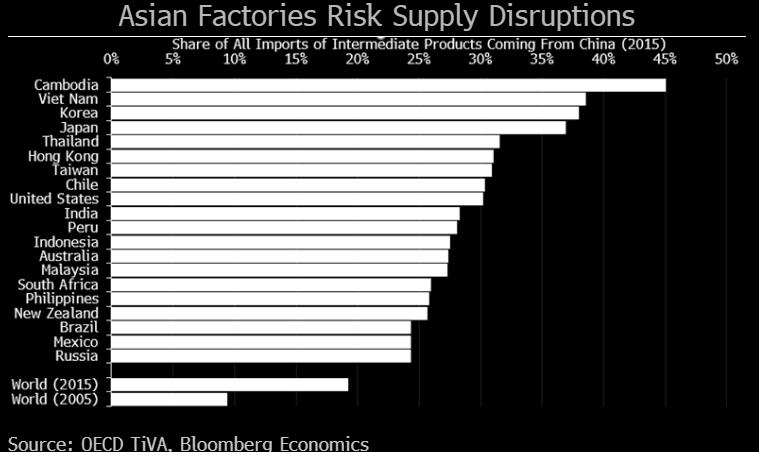
- This wide-scale lockdown will have cascading effects throughout the global economy. Bloomberg notes the following: “China is the world’s largest exporter of intermediate manufactured products – components destined for use in supply chains across the world. The longer the coronavirus curtails China’s factory output, the bigger the risk of disruption elsewhere. Using detailed OECD trade data, we assess which economies are most vulnerable.”
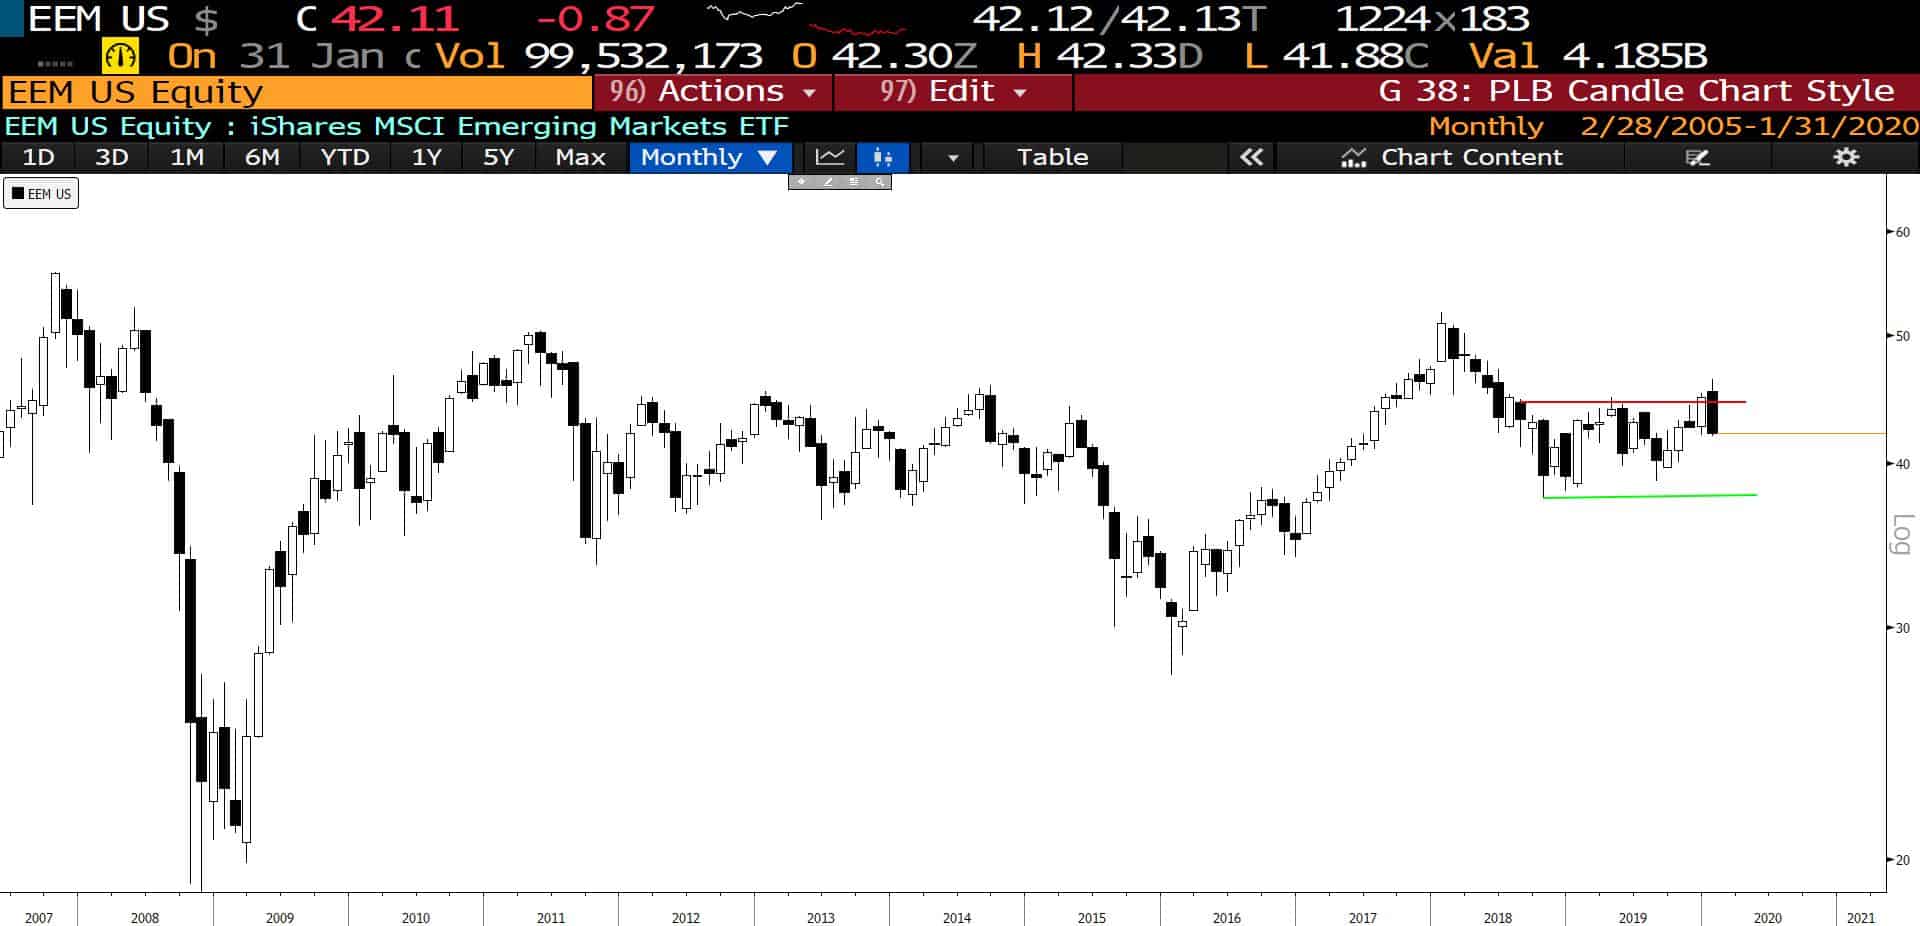
- This monthly chart of the MSCI Emerging Market Index (EEM) shows that EM just put in a failed breakout and complete reversal, forming an engulfing bear candle closing near its lows for the month. Odds are that we see follow through to at least the bottom of the channel, near its Jan 19’ lows.
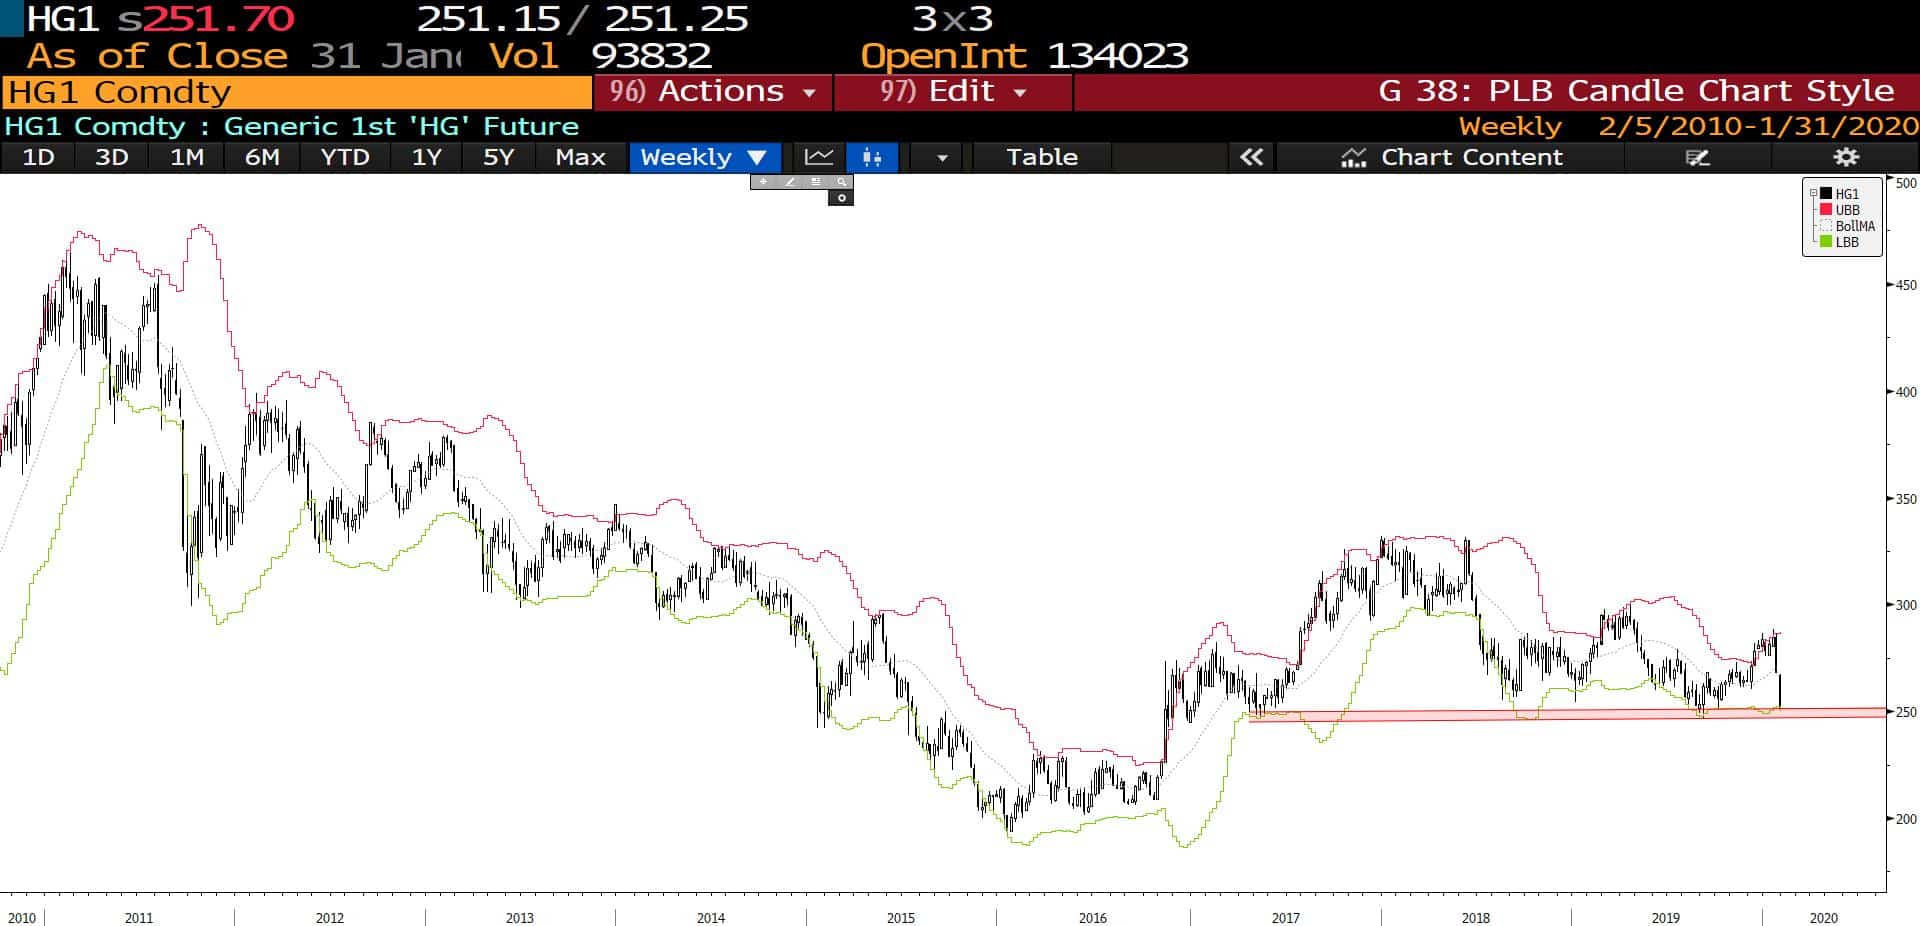
- A key market to watch as the coronavirus situation develops is copper. In the hierarchy of markets — regarding their signaling value — metals sit at the top. China consumes roughly 50% of the world’s copper, which is why the metal recently experienced its worst selloffs in years. Copper should be first to sniff out the all-clear from coronavirus fears. Currently, it’s near its lower Bollinger Band as well as the bottom of its 3-year trading range.
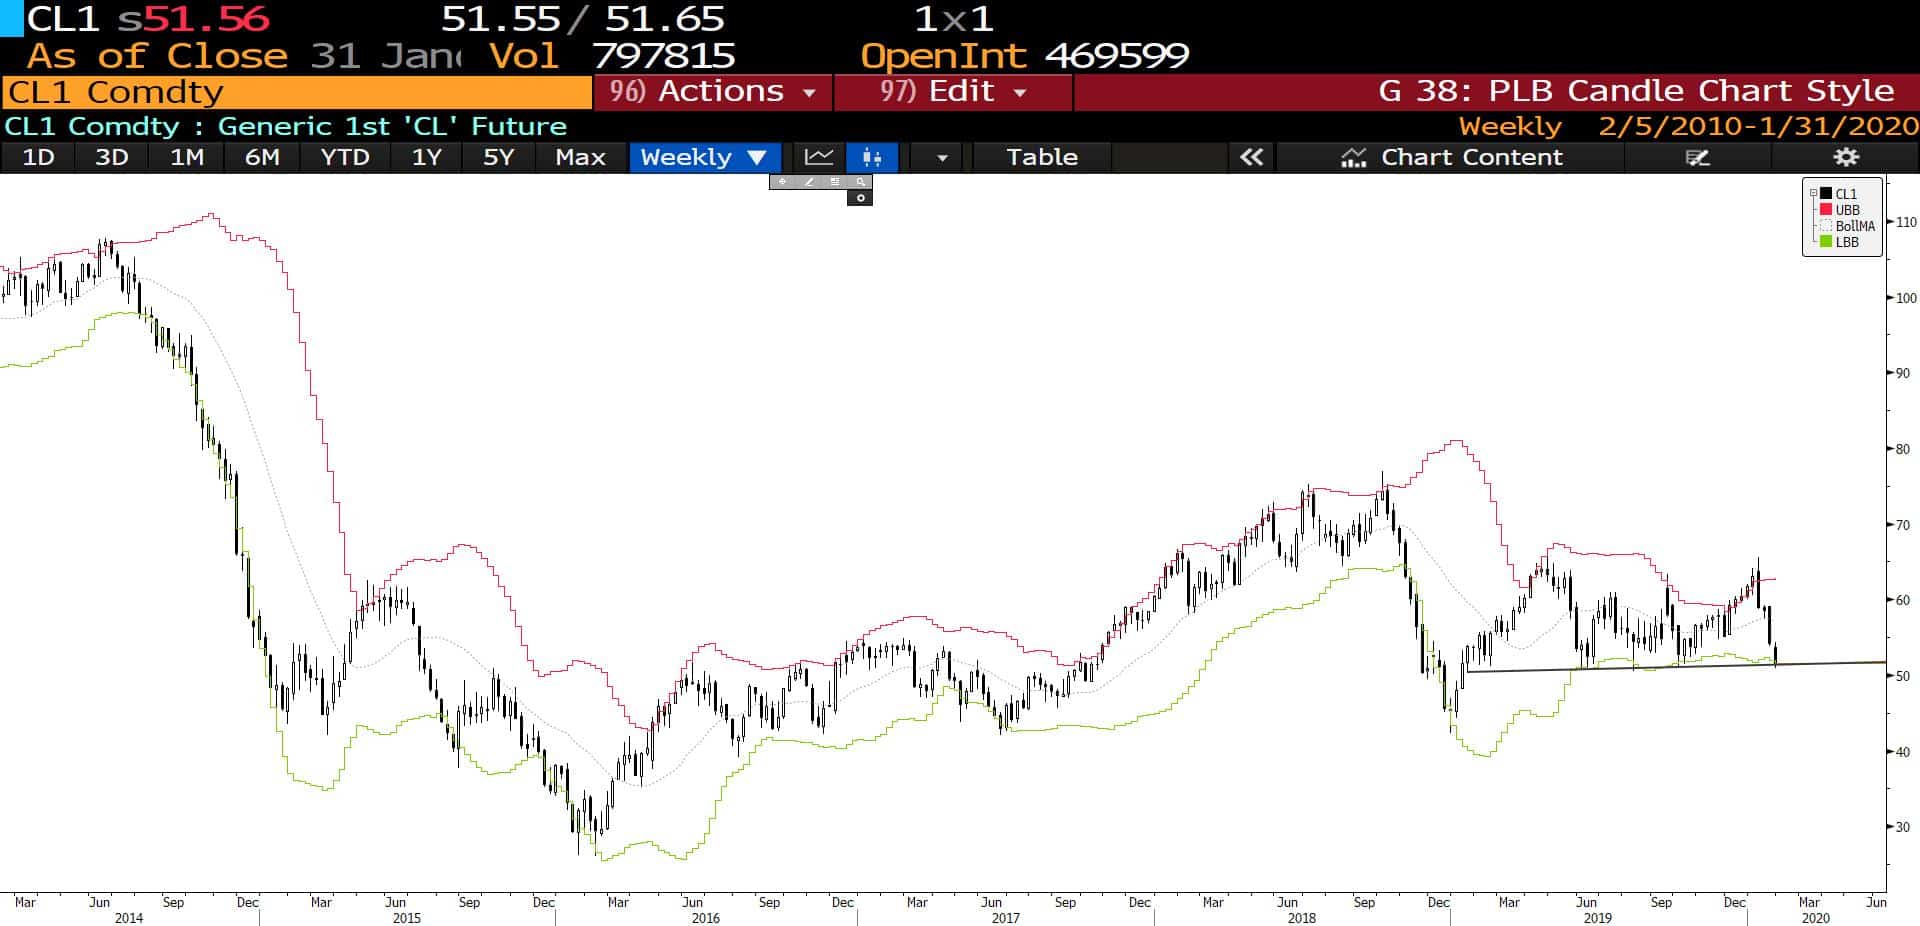
- Since China is a large consumer of oil, the crude market is another good tell. Below is a chart of weekly WTI crude (CL_F). Like copper, crude is now at its lower Bollinger Band as well as the bottom of its year-long trading range. It’s now trading at the breakeven cost of production for US frackers. A dip below this range could set up a major buying opportunity.
- Long bonds have by far been our biggest position over the last few weeks. So far, this trade has paid out nicely and I expect it to continue to do so for at least a few more weeks. The chart below shows that bond yields saw their steepest decline since August of last year.

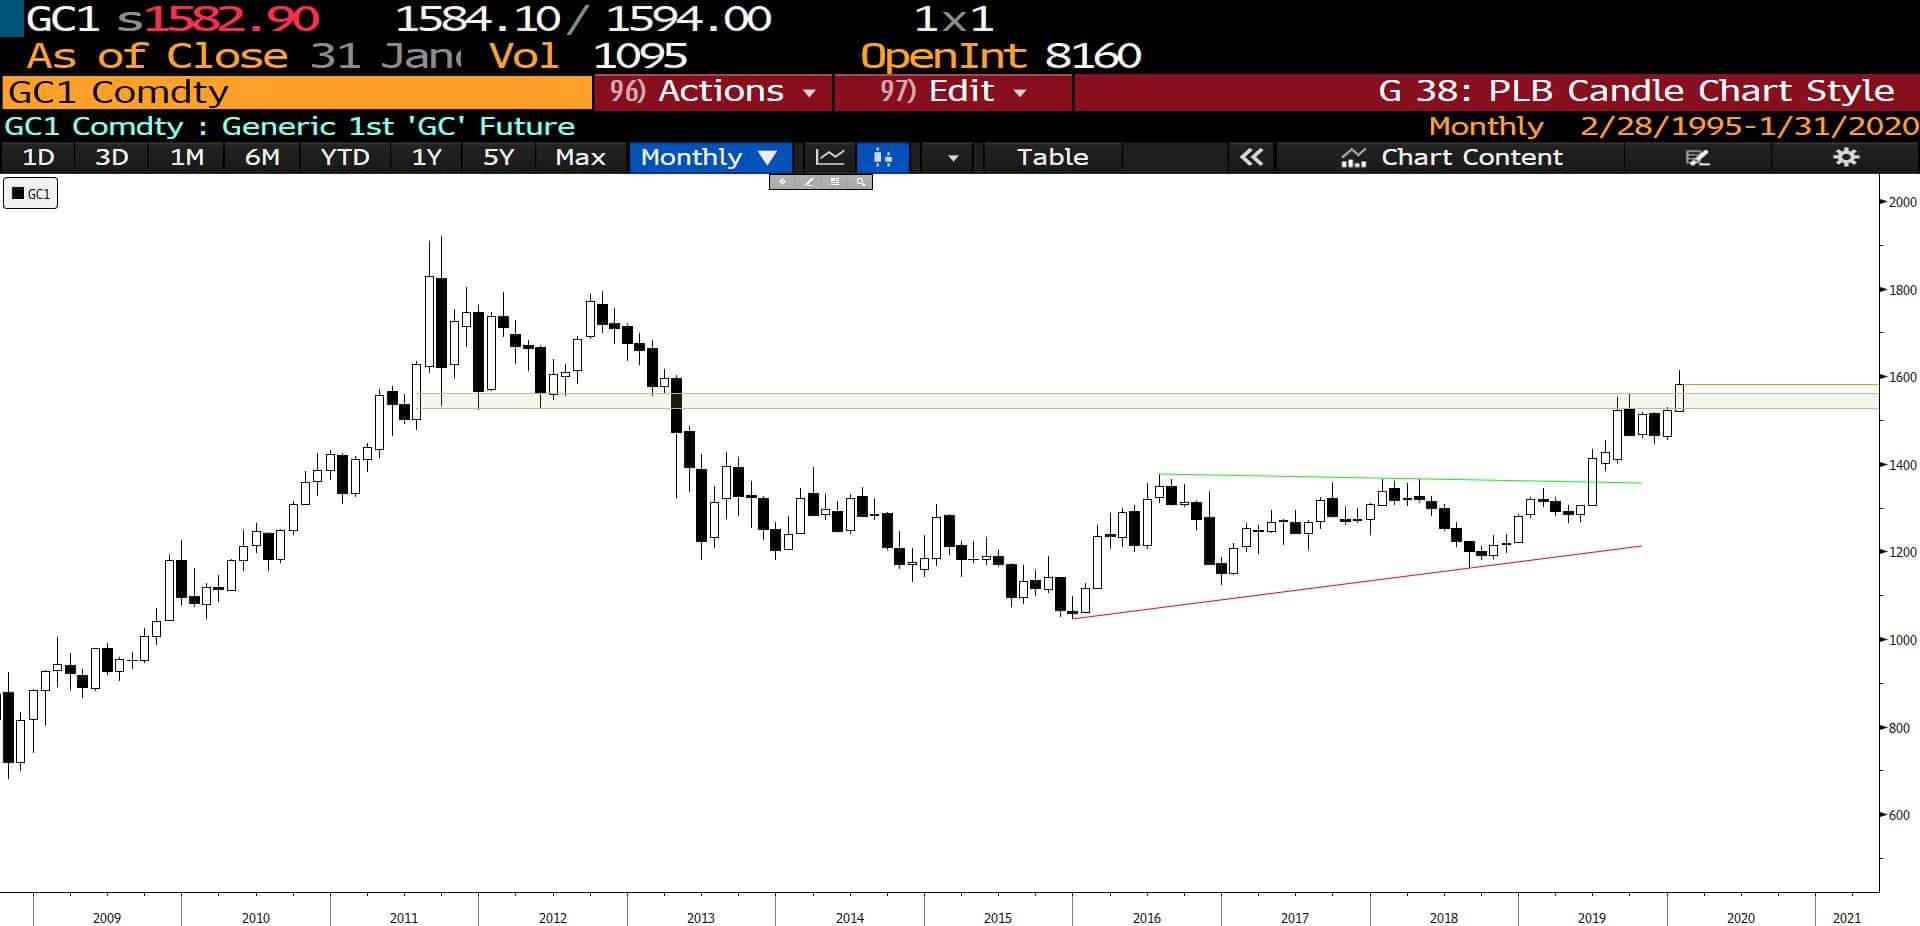
- Falling real yields have been a great tail-wind for gold which just made a new 6+ year high. The chart below is a monthly and shows that the yellow metal was able to punch through a major area of resistance. It’s now battling the big 1,600 level. The path of least resistance is up.
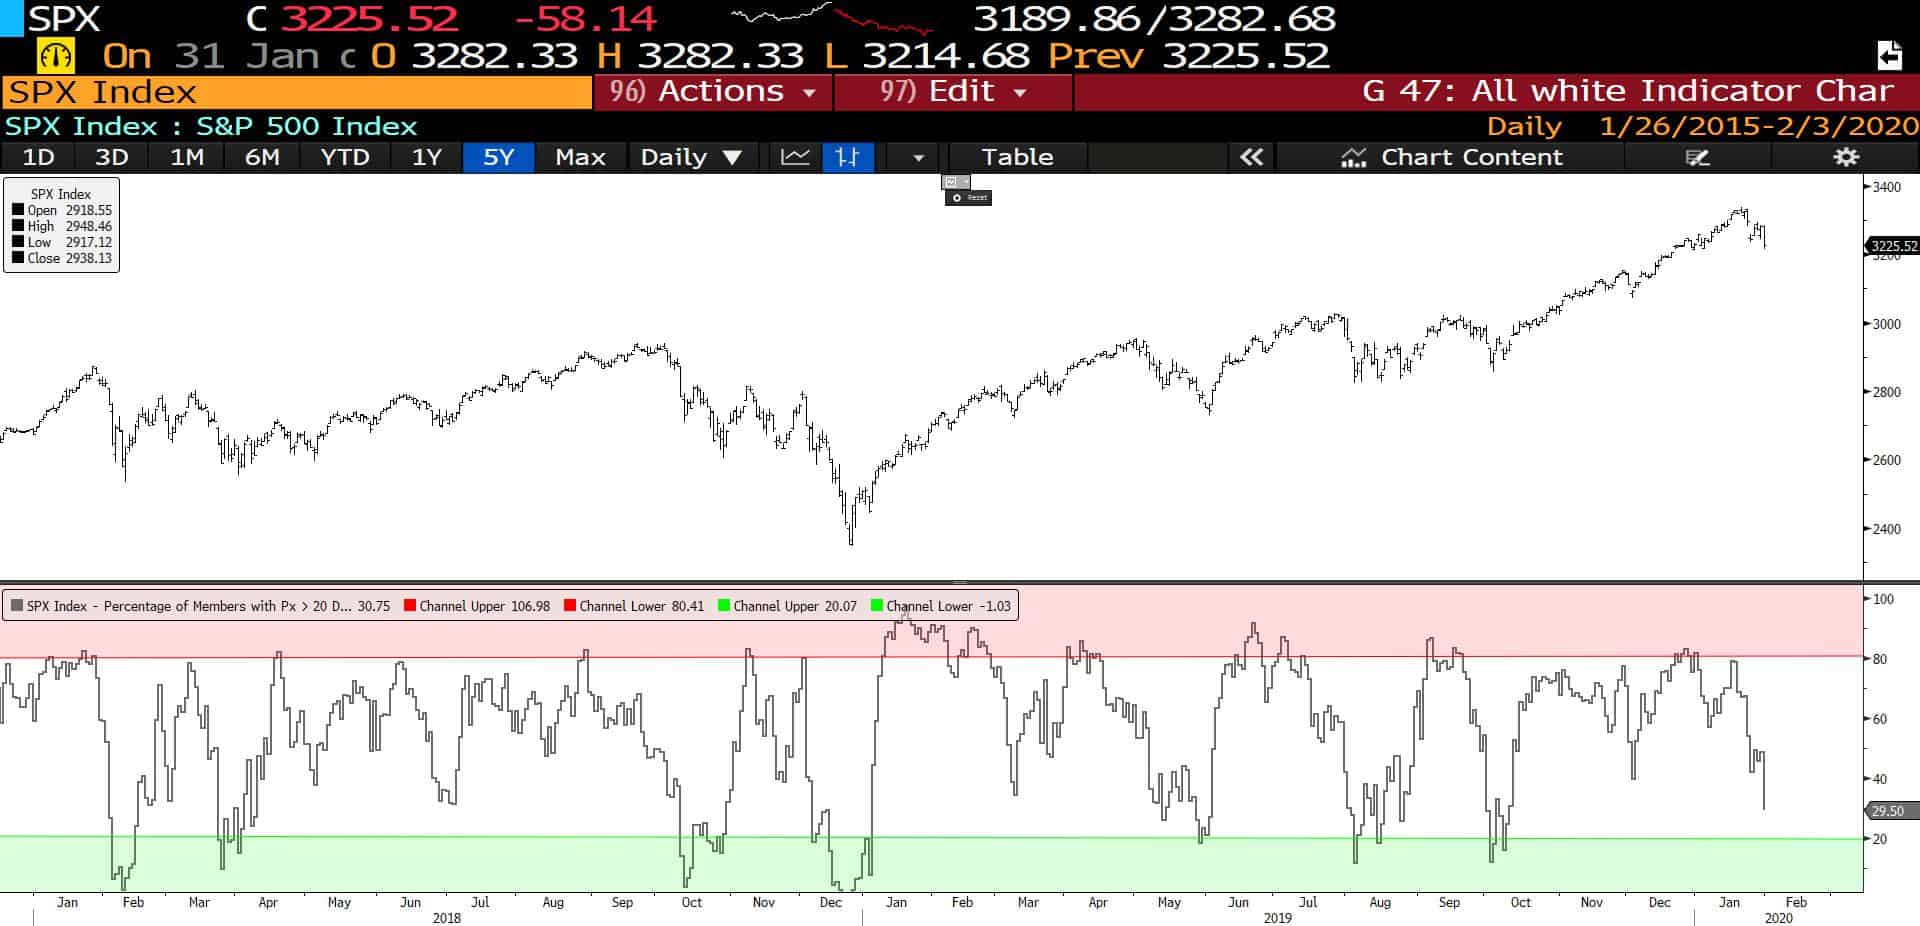
- I’ve received a handful of emails asking about what I look for to gauge when this market selloff might be over. While there’s a number of indicators I track for such a thing, here’s an important one: it’s the percent of stocks trading above their 20-day moving averages. Most selloffs will continue until that percentage falls below at least the 20% level. We still have a bit of a ways to go…
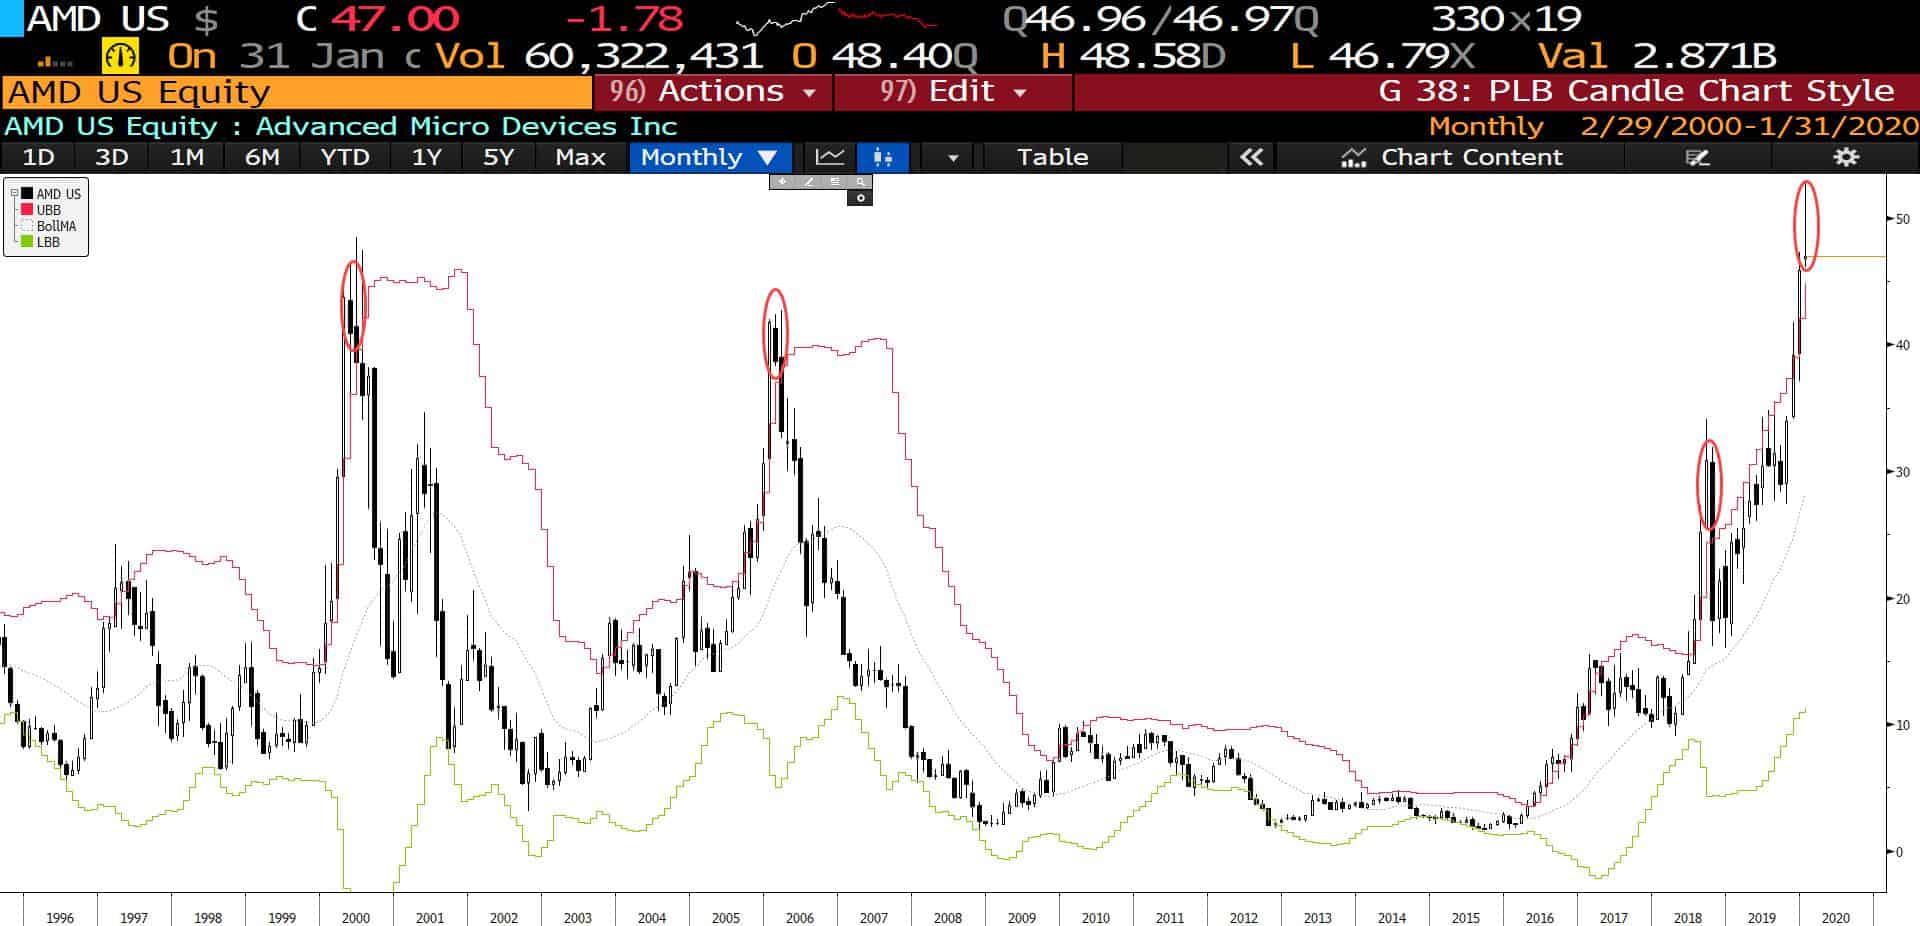
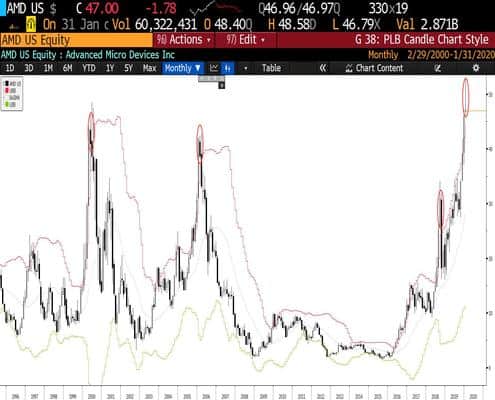
- Earlier this month I pointed out the extreme overbought levels in a number of semi stocks, most notably Advanced Micro Devices (AMD). The red circles show every time that the stock has had a monthly candle trade completely above its upper monthly Bollinger Band.
January marked the fourth occurrence over a 25-year period and January’s candle reversed to close exactly on its open which suggests there’s a high probability of major downside ahead. Also, approximately 25% of AMD’s revenues come from within China. Time for a short?