Since the mid-1980s, my mantra for this process is ‘strong opinions, weakly held.’ Allow your intuition to guide you to a conclusion, no matter how imperfect — this is the ‘strong opinion’ part. Then — and this is the ‘weakly held’ part — prove yourself wrong. Engage in creative doubt…Eventually, your intuition will kick in and a new hypothesis will emerge out of the rubble, ready to be ruthlessly torn apart once again. You will be surprised by how quickly the sequence of faulty forecasts will deliver you to a useful result. ~ Paul Saffo
Good morning!
In this week’s Dirty Dozen [CHART PACK] we look at numerous signs of glaring complacency, over positioning, and excessively silly bullish sentiment in the market. Let’s dive in…
***click charts to enlarge***
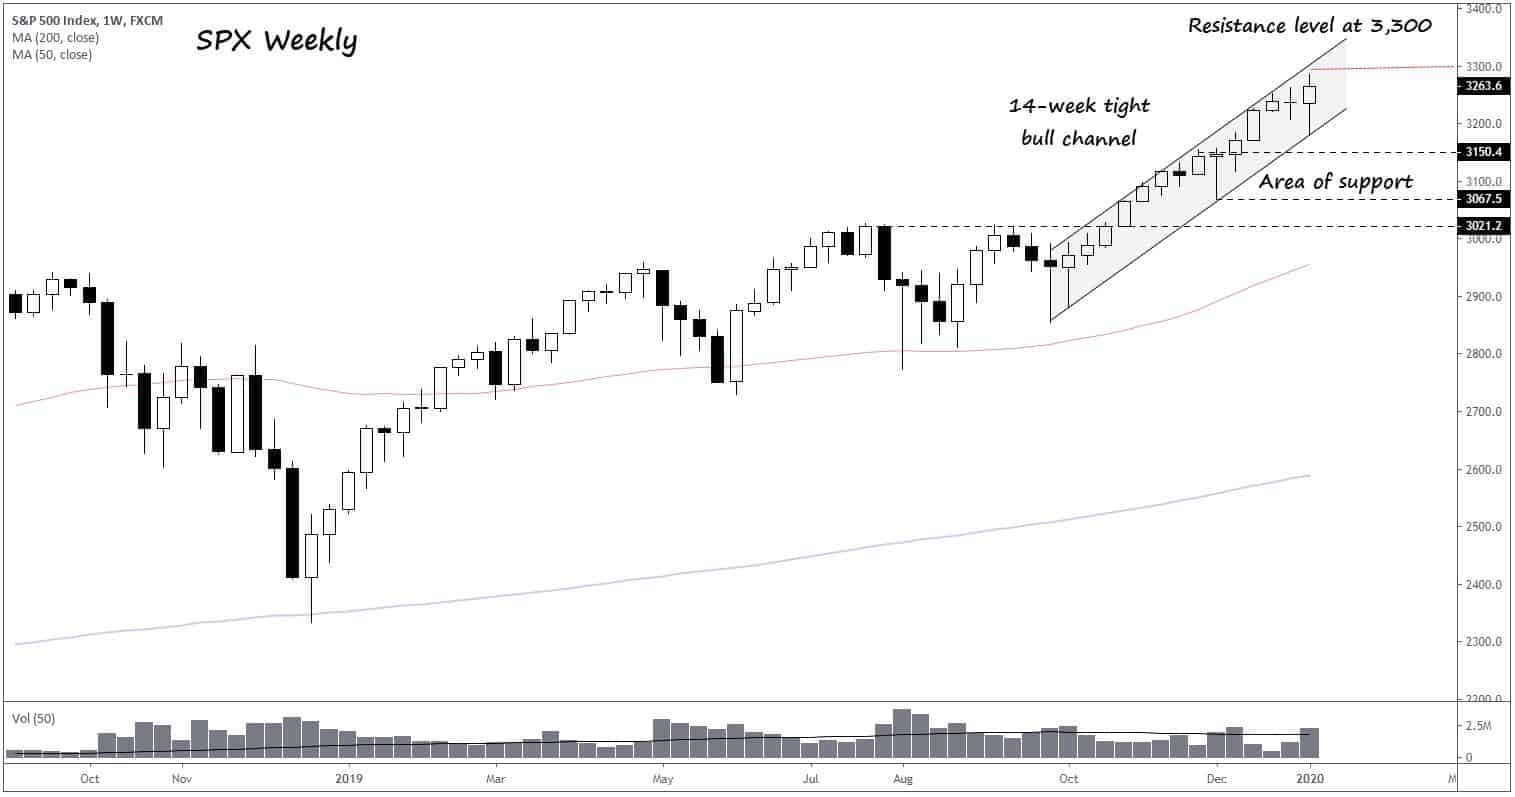
- The SPX briefly sold off last week on Iran war hysteria only to rebound perfectly off of the lower line of its 14-week micro bull channel, putting in a new weekly all-time closing high. Its next test will be the 3,300 level and should it fail and break below the bull channel we should expect a sell-off at least down to its next major area of support which is in the 3,100ish range.
As I’ll show, sentiment and positioning are at extreme levels. This makes the market susceptible to a sizable correction (5%+) in the near future. But, breadth and technicals are still mostly intact and momentum is on the market’s side for higher prices. I suspect we could see a final buy climax following the signing of the US-China phase 1 trade deal this week. Takeaway: Now’s not the time to be chasing higher. Start hedging downside risk but wait for the market to confirm bull move is over before attempting to short. And don’t overreact, this selloff should set up some excellent buying opportunities.
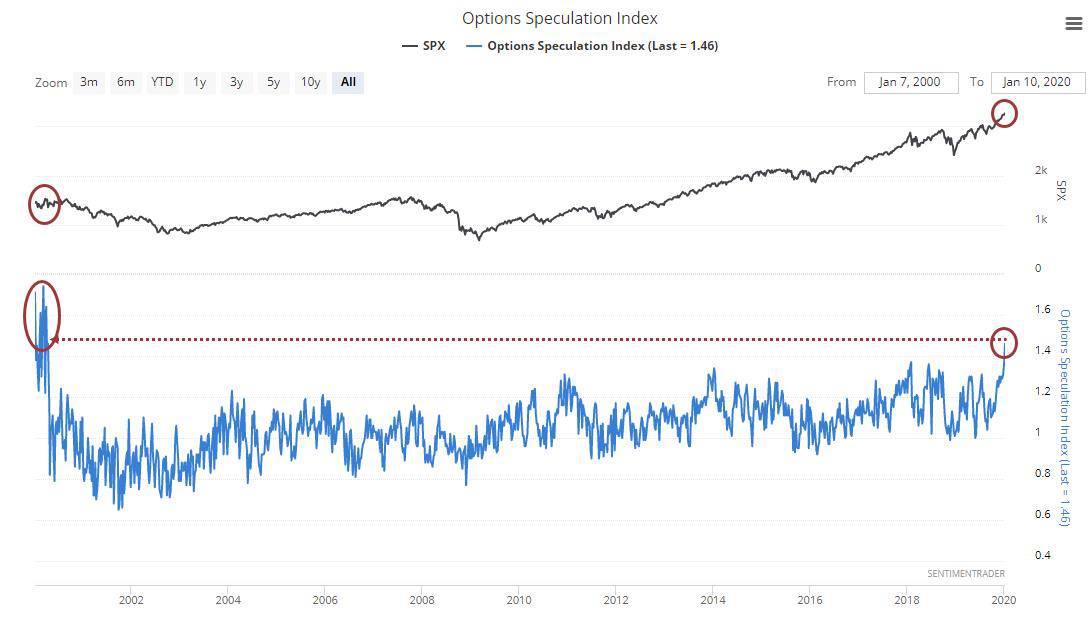
- SentimenTrader tweeted out the following message and chart “Last week, y’all bought to open 21.6 million speculative call options. That’s the most *ever*. Your previous record was 19.7 million during the week of Jan 26, 2018. Your total bullish / bearish volume was the most since March 2000. So…wow.”
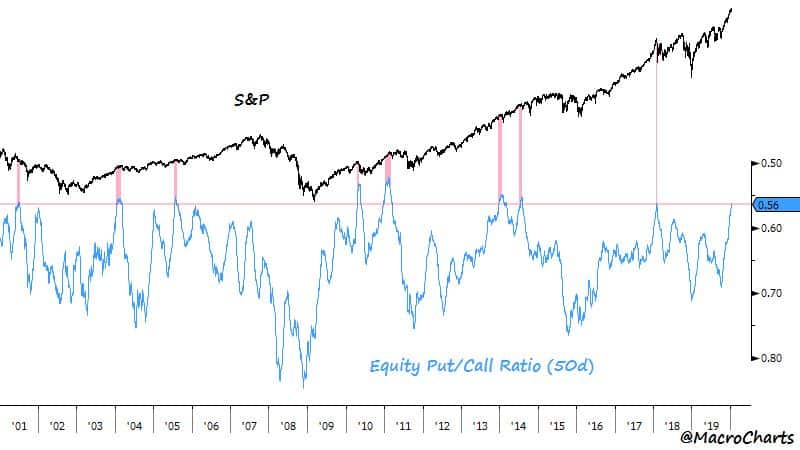
- Over the last two weeks, I’ve been writing about the incredibly stretched levels in put/call ratios. This last week @MacroCharts shared the following in a blog post noting the same “Above, the 50-day Put/Call Ratio (inverted) has dropped to 0.56, among the most extreme overbought readings in 20 years. Remember this is the same indicator I discussed in November – when people were pointing to a 1-day overbought Put/Call reading and saying markets were euphoric. They weren’t. But now they certainly look that way.” Link to the post.
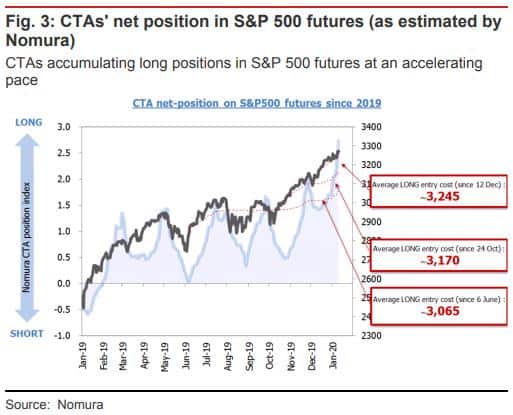
- The CTA’s are going all in… Read the following from Nomura, “It appears to us that the foremost concern in speculators’ minds right now is not the short-term risk of herding, but rather the risk of their managed funds underperforming the benchmark indices… we estimate that trend-chasing CTAs are adding to their aggregate net long position in S&P 500 futures at a furious pace. We think that this sprint to chase the market’s upward momentum is giving rise to a systematic market melt-up. We estimate that a hefty 47% of CTAs’ long positions in S&P 500 futures were acquired in the brief time since the beginning of December, and therefore break even (on average) at an S&P 500 reading of about 3,245, which is considerably higher than the average entry point for positions acquired earlier on.”
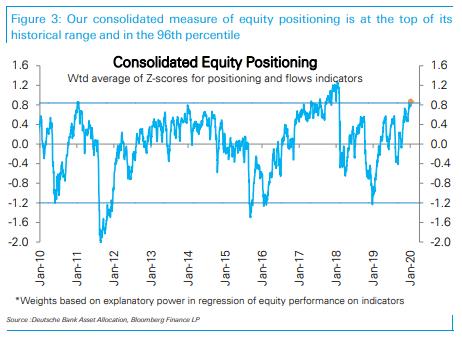
- This chart from Deutsche Bank shows that total equity positioning is “at the top of its historical range and in the 96th percentile”.
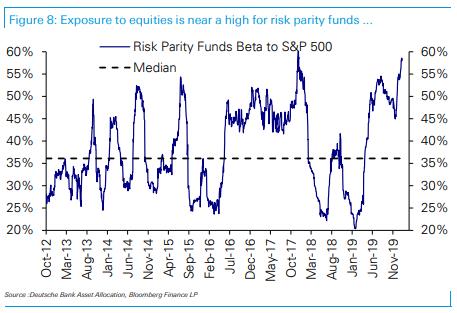
- Even Risk Parity funds have gone all-in on the equity ramp up. RP beta to the SPX is at its second-highest level this cycle, with only Jan 18’ exceeding it (chart from DB).
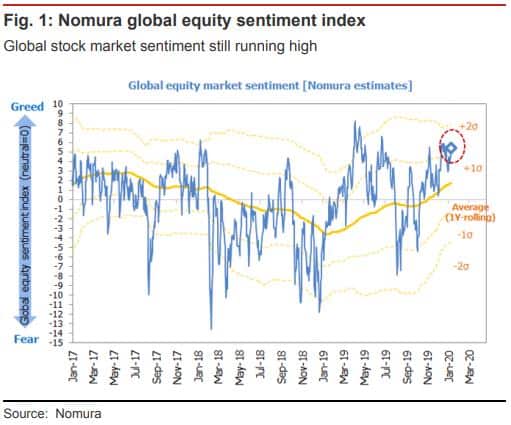
- Nomura’s global equity sentiment index is roughly 1.5 SD’s above its 1-year rolling average.
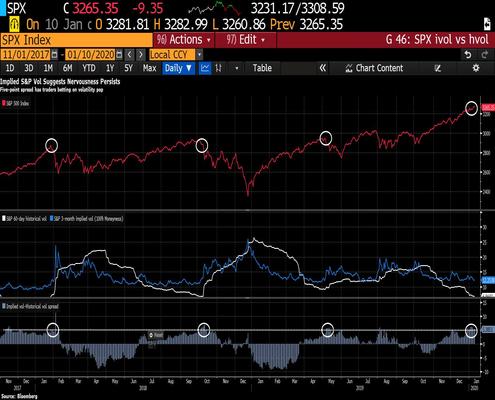
- Another interesting development is the widening spread between the SPX’s implied and realized volatility. This means traders are starting to bet on a pop in vol. The white circles note the prior three times the gap between implied and realized volatility reached these levels.

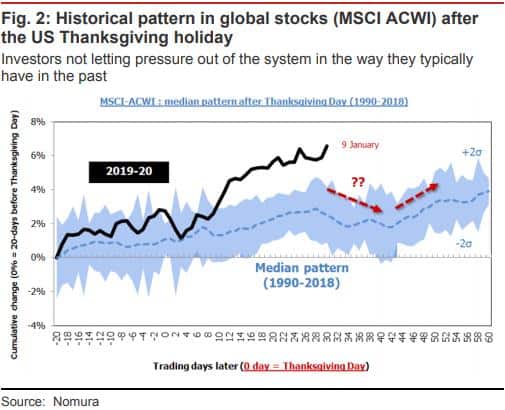
- This seasonality chart from Nomura shows that we’re entering a historically weak period for stock market returns over the next two weeks.
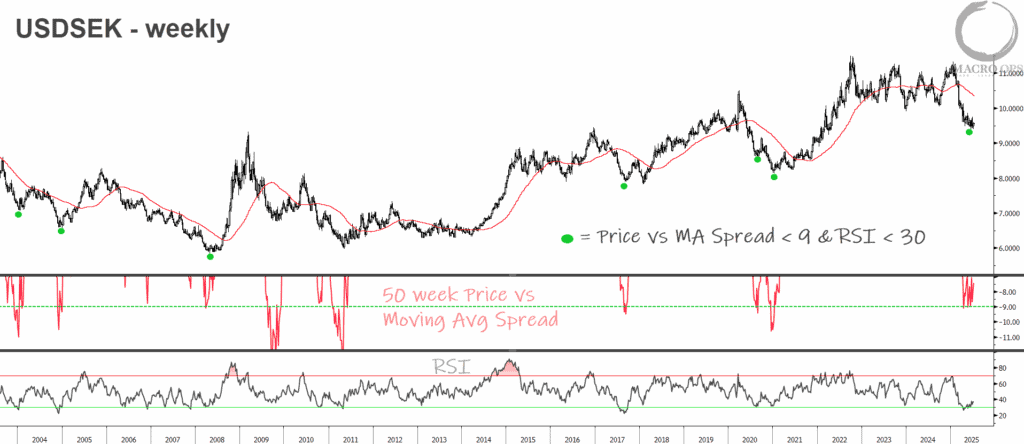
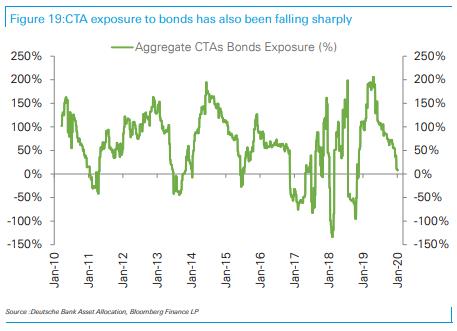
- I don’t know about you but this makes bonds — which have been holding up surprisingly well, considering — a good looking trade here. It also happens to be that CTA’s have near-zero exposure to them and positioning is extremely short (charts via DB).

- This is a cool chart from BofAML showing the number of months that a stock has made it with a market cap exceeding 4% of the S&P 500. MSFT is currently at 8 months and AAPL at 3. Another thing to point out (there wasn’t enough space in this week’s Dozen to do so) is that there’s a number of stocks trading completely above their upper monthly Bollinger Bands. Not only is this usual but it tends to not last very long, often marking intermediate buy climaxes. AAPL and the semi index (SOX) are two current examples.

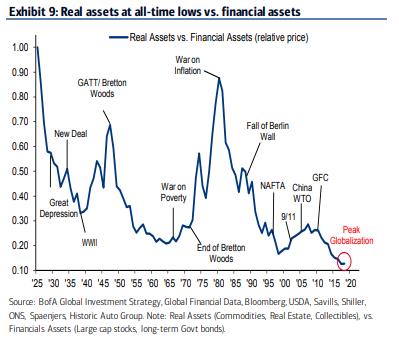
- Now, THIS is a great chart from BofAML. Real assets are trading at ALL-TIME LOWS vs financial assets. Do you think this trend will persist or are we nearing the turn?